
Key risk events today:
Crude Oil Inventories; FOMC Members Kaplan and Kashkari Speak.
(Previous analysis as well as outside sources – italics).
EUR/USD:
The US dollar index, measures the value of the US dollar against a basket of foreign currencies, remained on the backfoot Tuesday, aided by less-than-stellar US consumer confidence, with the unit poised to continue declining until reaching daily support at 98.45.
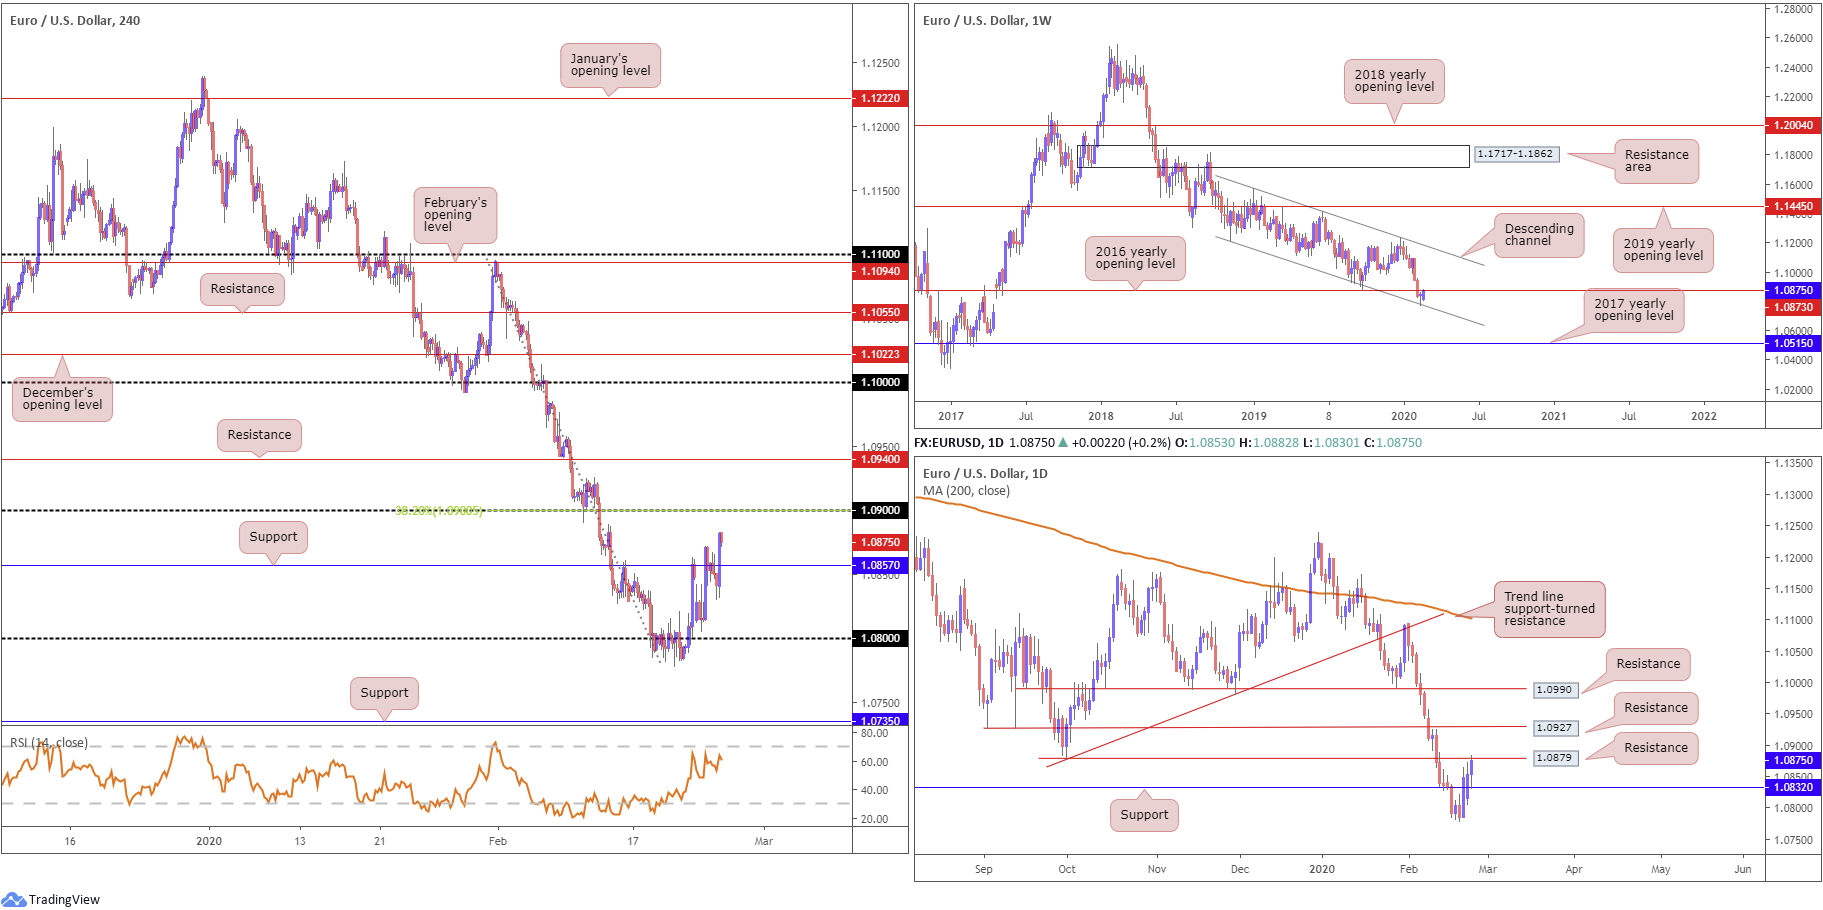
EUR/USD, therefore, remained on the winning side of the table yesterday, establishing firm position north of H4 support at 1.0857 with an eye now for the 1.09 handle. Note, 1.09 also links with a 38.2% Fibonacci retracement ratio. Beyond this point we can see H4 resistance plotted at 1.0940. Indicator-based traders also have the relative strength index (RSI) languishing beneath overbought waters, unable to breach 68.00.
Further out, weekly price is testing resistance at 1.0873, formed by way of the 2016 yearly opening level. This follows last week’s rejection off channel support, taken from the low 1.1109, shaped in the form of a bullish hammer candlestick pattern. A move above 1.0873 could eventually see an approach emerge towards channel resistance, extended from the high 1.1569.
The response from the weekly channel support has so far generated relatively enthusiastic upside, reclaiming daily resistance at 1.0832 (now a serving support) and, in recent sessions, testing daily resistance at 1.0879, the October 1st low. A break highlights resistance at 1.0927, followed by another layer of resistance coming in at 1.0990.
Areas of consideration:
Well done to any readers long north of 1.08; this was a noted setup to watch for last week. Reducing risk to breakeven and banking partial profits remains a priority, given the test at weekly resistance from 1.0873 and daily resistance at 1.0879. The next port of call above the said levels is the 1.09 handle on the H4.
Although upside may be hampered by the aforementioned weekly and daily resistances, a retest at 1.09 is still a possibility, knowing it aligns with the 38.2% H4 Fibonacci retracement. 1.09, therefore, could be a layer of resistance worthy of shorts today, though owing to round numbers being prone to whipsaws, conservative traders will likely pursue additional confirmation before pulling the trigger.
GBP/USD:
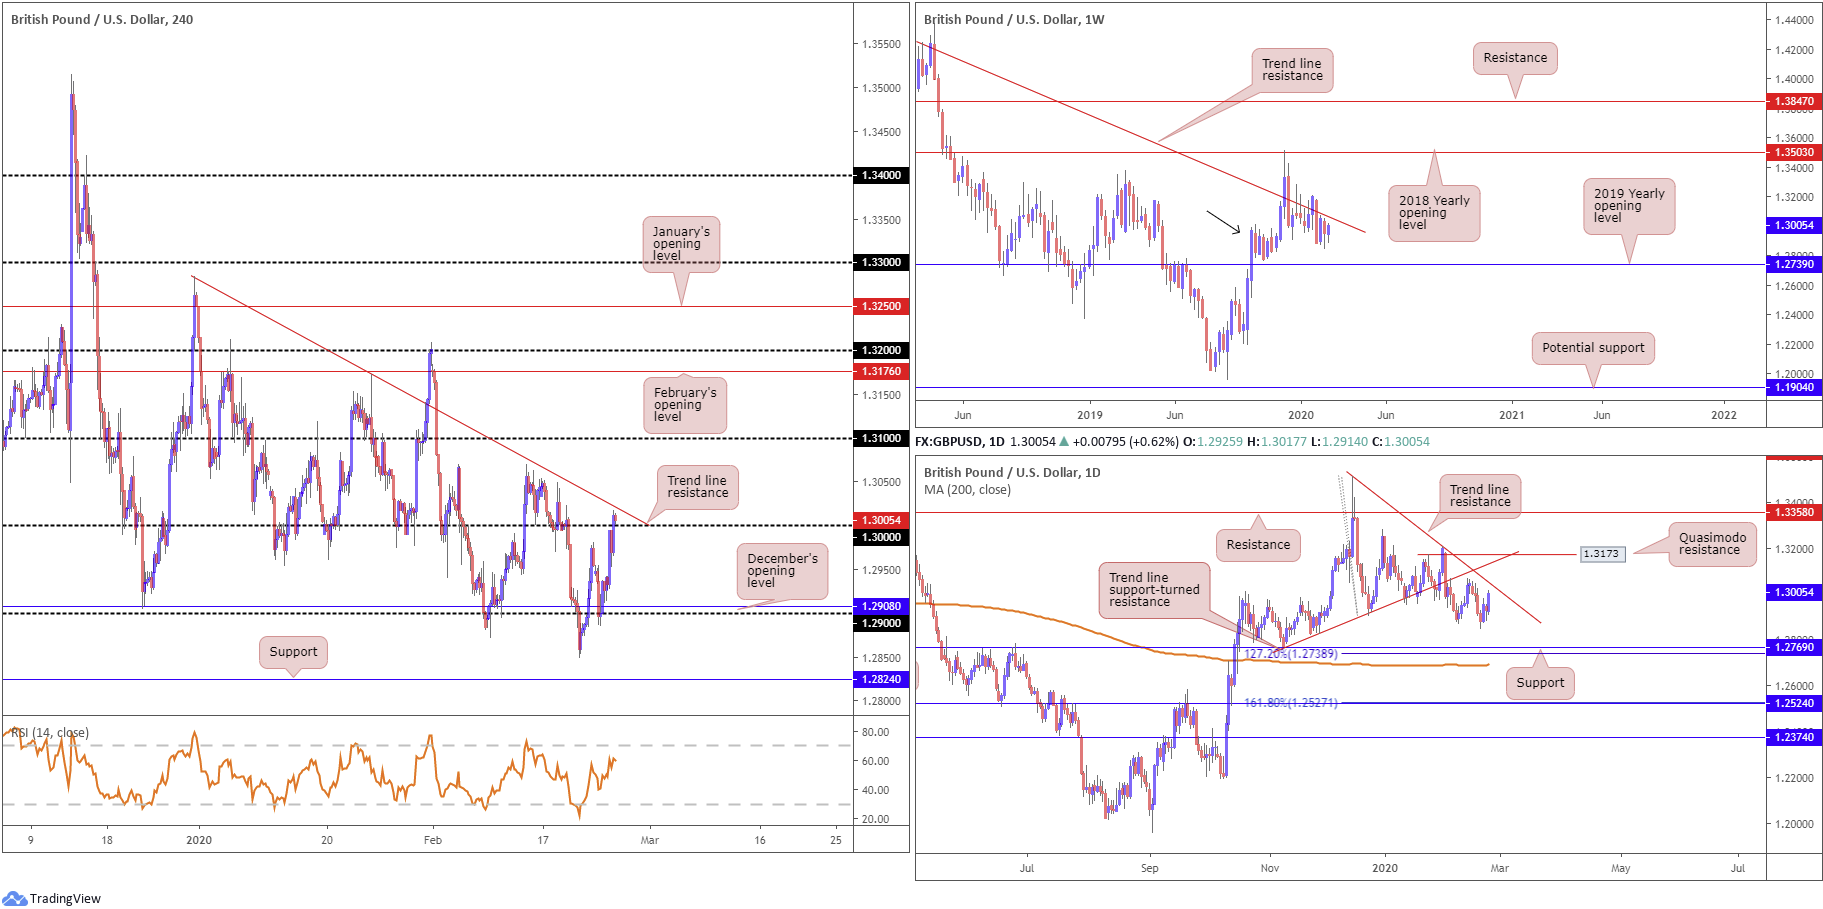
Despite a fleeting pullback Monday, Tuesday observed increased upside in GBP/USD, eventually abandoning the key figure 1.30 applied to the H4 timeframe. As you can see, trend line resistance resides close by, taken from the high 1.3284. While upside could be hindered off the said trend line resistance, traders likely identify this as a potentially weakened base, due to the pair rupturing the line in late January and shaking hands with the 1.32 handle. Aside from possible resistance emerging off tops around the 1.3070ish neighbourhood, the 1.31 handle offers logical resistance on this scale. The relative strength index (RSI) trades a touch above 60.00, threatening a run to overbought levels.
Weekly price is seen languishing beneath long-standing trend line resistance, pencilled in from the high 1.5930, though demand around the 1.2939 region is also still in motion (black arrow). Continued downside may imply a break of the said demand, tripping sell stops and testing the 2019 yearly opening level at 1.2739. A break higher, on the other hand, could see the 2018 yearly opening level enter the fight at 1.3503.
From the daily timeframe, we can see that after engulfing the 1.2872 10th February low, sterling has clawed back the majority of last week’s downside and is on track to cross paths with trend line resistance, taken from the high 1.3514. A rotation to the downside from here, nevertheless, has support fixed at 1.2769, a 127.2% Fibonacci extension at 1.2738 and the 200-day SMA (1.2690). Note the said SMA has been flattening since mid-October 2019.
Areas of consideration:
Although H4 price invites a possible approach to 1.31, chart studies indicate some reasonably heavyweight resistances before we connect with the said round number: weekly and daily trend line resistances. So, while a break above 1.30 is considered a bullish indication, trade with caution as higher-timeframe sellers may lie in wait. With this being the case, and assuming selling does indeed take over, a H4 close beneath 1.30 could reopen the door for bearish scenarios back to at least the 1.29 region. A retest at the underside of 1.30 would be particularly attractive for sellers, especially if formed by way of a H4 bearish candlestick signal, a shooting star pattern, for example.
AUD/USD:
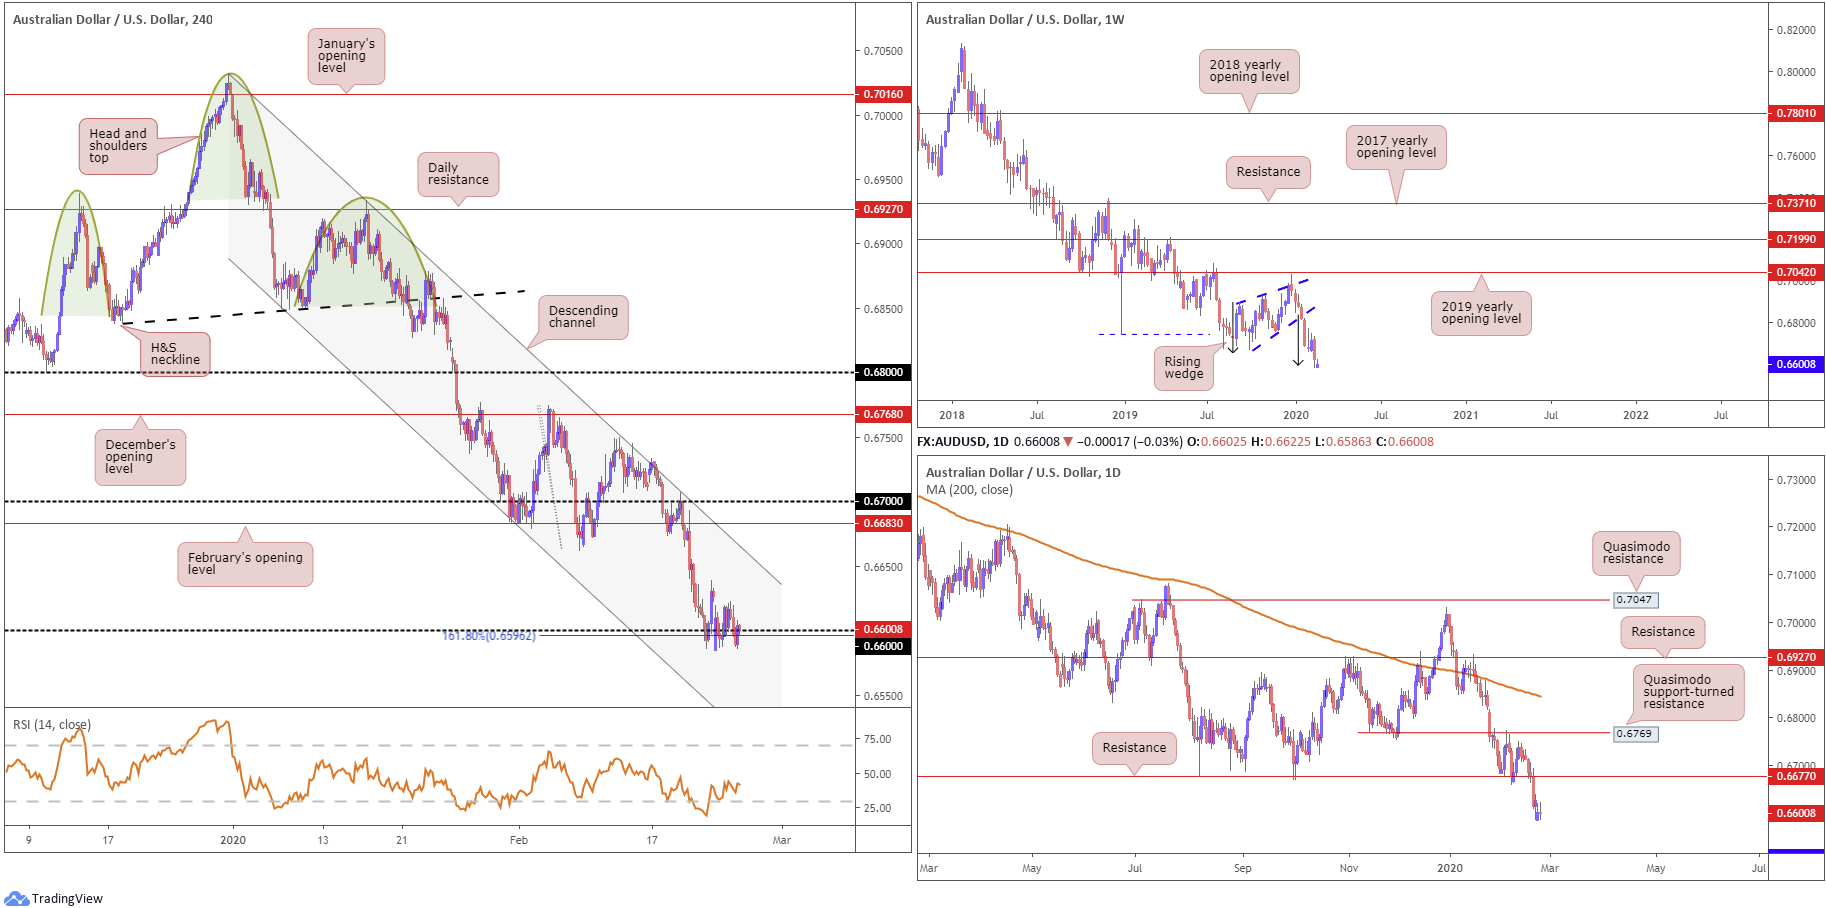
Despite the US dollar index voyaging to lower ground Tuesday, AUD/USD failed to capitalise off 0.66 and remained within a narrow range between 0.6622/0.6586, likely weighed by the latest coronavirus headlines. As a result, much of the following analysis will echo points raised in Tuesday’s briefing.
Reinforced by a 161.8% Fibonacci extension at 0.6596 and the relative strength index (RSI) recently elbowing its way out of oversold territory, the H4 candles half-heartedly continue to defend 0.66 as support. In the event 0.66 gives way, channel support, extended from the low 0.6850, may enter the fold, shadowed by the 0.65 handle.
On a wider perspective, longer-term movement on the weekly timeframe shook hands with a rising wedge take-profit target at 0.6599 (black arrows – calculated by taking the height of the base and adding it to the breakout point) in the later stages of last week, clocking multi-year lows. This pattern took five months to complete; well done to any readers who took part. With price nudging marginally beyond this barrier in recent trade, continued downside on this scale has support at 0.6359 (not visible on the screen) to target.
The key observation on the daily timeframe is the taking of support at 0.6677 last week, now a serving resistance level. The next support target beyond 0.6677 falls in around 0.6508 (not visible on the screen).
Areas of consideration:
Should 0.66 fall through today, which going by the current state of the H4 candles looks to be the case, breakout sellers likely have eyes for H4 channel support (highlighted above), and the 0.65 handle, which happens to merge with the next daily support target mentioned above at 0.6508.
As such, a decisive H4 close beneath 0.66 will likely entice selling, given the surrounding technical factors. A retest at 0.66 as resistance offers additional confirmation, more so if the H4 rejection candle closes by way of a bearish candlestick signal (entry and risk can then be set according to its structure).
USD/JPY:
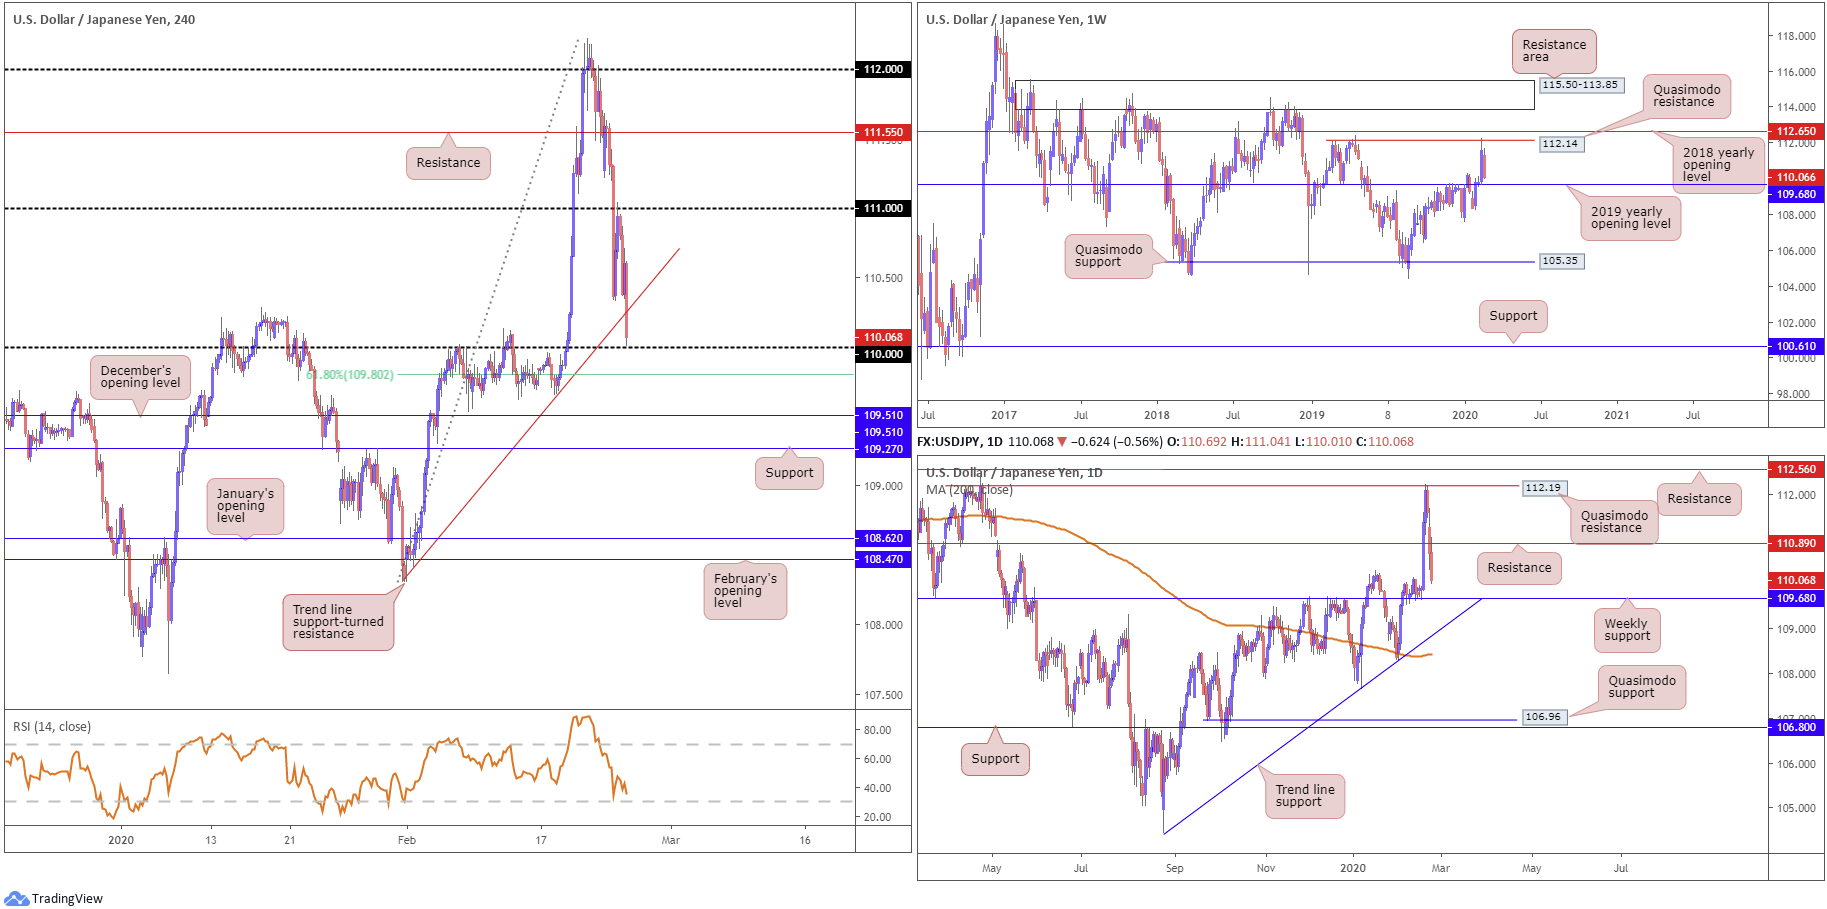
Demand for safe-haven assets remained high Tuesday amid concerns over the potential global economic fallout from the coronavirus outbreak, sending the yield on the 10-year Treasury to a record low of 1.32%. USD/JPY jumped through H4 trend line support, taken from the low 108.31, and, in recent hours, crossed paths with the 110 handle. A 61.8% Fibonacci retracement lurks a few points at the back side of 110 at 109.80, with a violation potentially setting the stage to December’s opening level at 109.51 and support coming in at 109.27. beyond here, limited support is visible until reaching January’s opening level at 108.62, though 109 could cap downside.
The weekly timeframe shows the pair delivered a near-full-bodied bullish candle north of the 2019 yearly opening level at 109.68 last week, but encountered resistance off a Quasimodo formation at 112.14, sited just south of the 2018 yearly opening level at 112.65. Recent selling has brought the current weekly candle to within touching distance of the 2019 yearly opening level at 109.68.
In similar fashion to weekly structure, the daily timeframe had price fade Quasimodo resistance at 112.19 at the tail end of the week, located a few points beneath resistance at 112.56. Follow-through selling from this region has been seen this week, rupturing support at 110.89 (now a serving resistance) and seen closing in on the weekly support level mentioned above at 109.68.
Areas of consideration:
Well done to any readers who took advantage of bearish themes beneath 112 on Friday; this was a noted move to be aware of. The risk/reward from here is just mouth-watering.
For traders who read Tuesday’s technical piece may recall the following:
The combination of the 111 handle on the H4 timeframe and daily support (now serving as potential resistance) at 110.89 could provide a ceiling today for possible bearish themes.
Well done to any readers who managed to capitalise on yesterday’s selloff. 111, as you can see, hit almost to-the-point before turning lower.
Going forward, 110 is likely to give way, knowing weekly support resides just beneath it at 109.68. A test of this weekly base, followed up with a close back above 110 could prompt a recovery in this market, fuelled on the back of sell-stop liquidity taken from beneath 110.
USD/CAD:
Tuesday had the US dollar index extending losses, absorbing bids and targeting daily support priced in at 98.45, while WTI prices also sunk for a third successive session. In view of yesterday’s lacklustre performance, much of the following report will echo similar thoughts put forward in Tuesday’s piece.
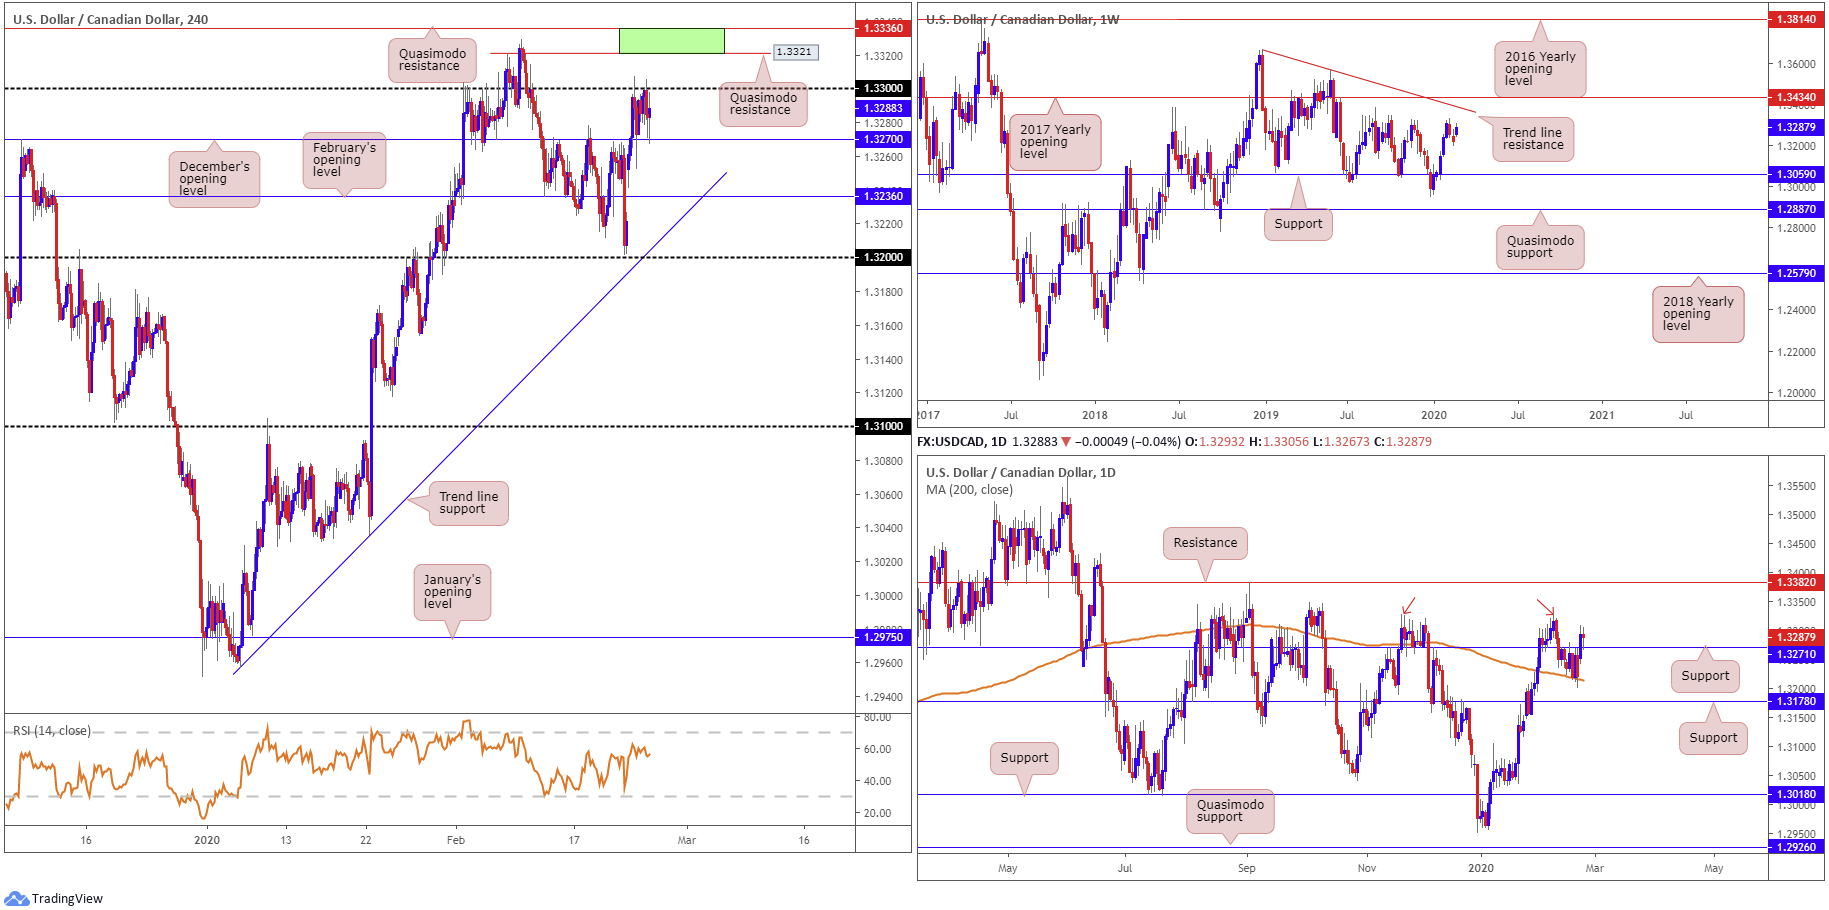
H4 price forms a narrow range between 1.33 and December’s opening level at 1.3270, while emphasising additional resistance above in the form of two Quasimodo resistances at 1.3360/1.3321 (green). South of 1.3270 we also have another layer of support in the offing around 1.3236, February’s opening level.
Having shown some resilience off the 200-day SMA (orange – 1.3214) Friday, the pair dethroned daily resistance at 1.3271 on Monday and retested the base as support on Tuesday. Tops around 1.3329 are now in view (red arrows) with a break drawing eyes to resistance pencilled in at 1.3382.
Meanwhile, on the weekly timeframe, resistance remains around tops at 1.3340. Additional resistance resides at a trend line formation (1.3661) and the 2017 yearly opening level at 1.3434. Support can be found around the 1.3059 neighbourhood.
Areas of consideration:
The green zone marked on the H4 timeframe between two Quasimodo resistances at 1.3360/1.3321 offer a potential reversal zone today, in the event 1.33 gives way. Supporting a bounce from this region are the daily tops mentioned above at 1.3329 and buy-stop liquidity above 1.33. The stops taken above 1.33 will likely be enough to attract sellers out of 1.3336/1.3321 for at least an intraday move back to 1.33. Entry can be found off 1.3321, while traders have the option of either placing stops above 1.3336 or the apex of the upper Quasimodo formation at 1.3347. The latter is clearly the more conservative route, but offers limited risk/reward back to 1.33, which could hamper further downside.
USD/CHF:
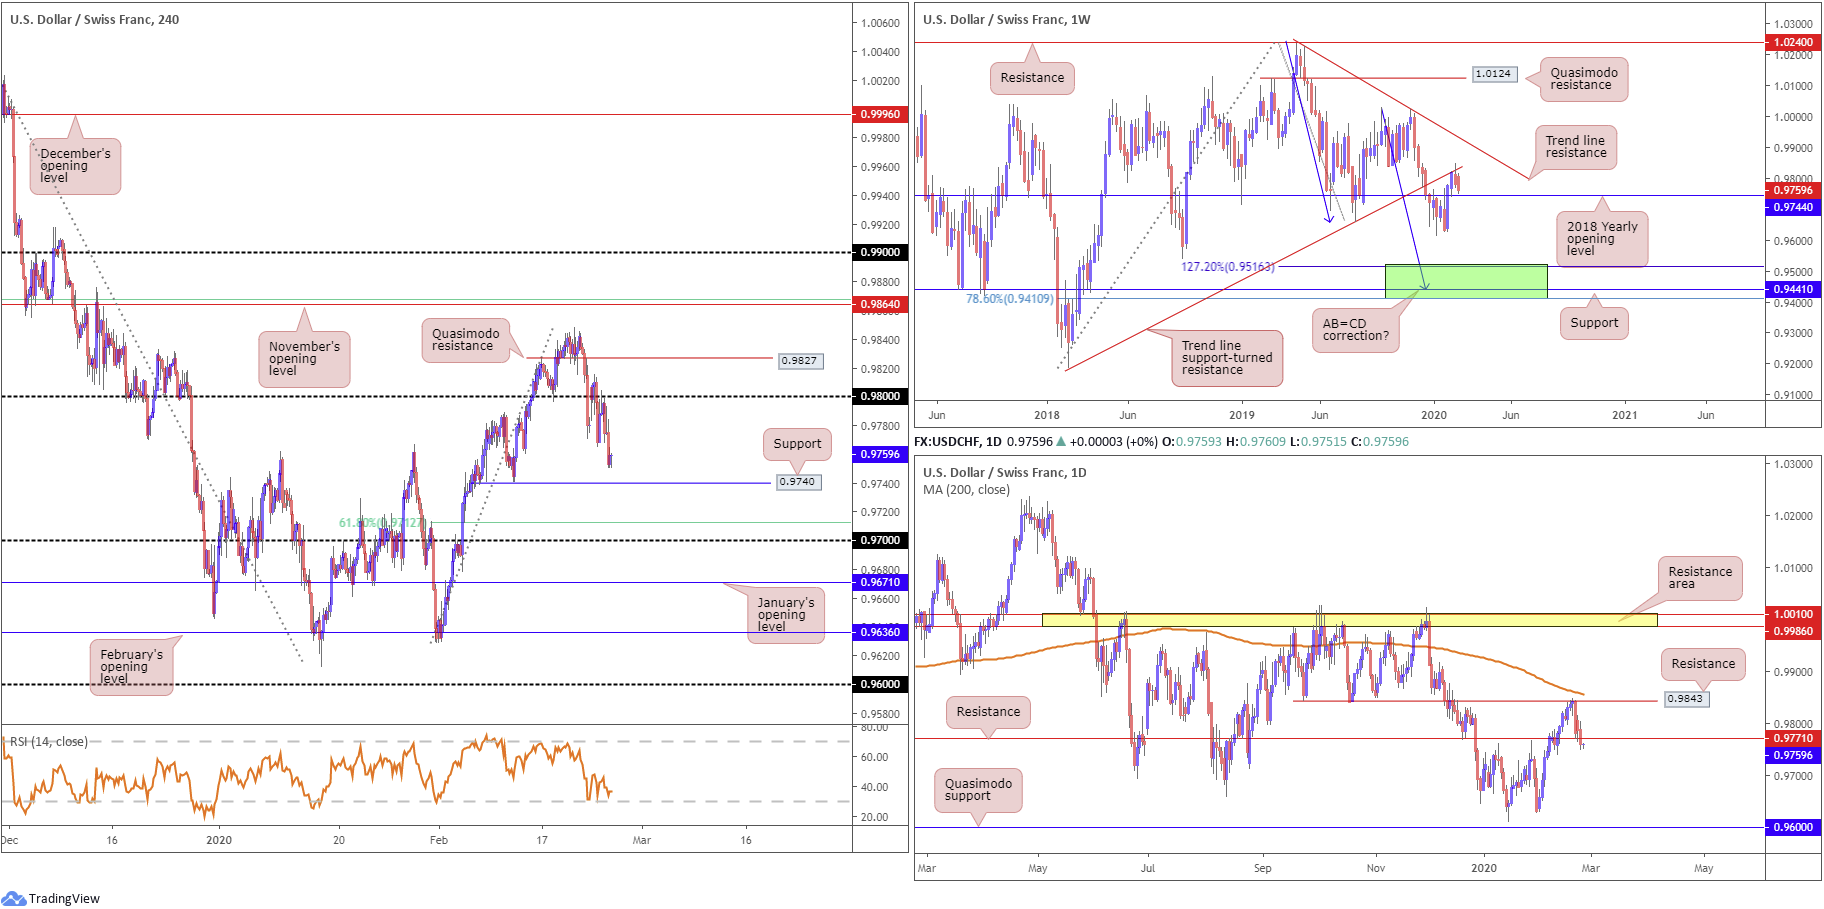
Broad-based USD selling and increased demand for the safe-haven Swiss franc guided USD/CHF southbound Tuesday for a third successive session. Erasing more than 25 points, or 0.29%, the pair revisited the underside of 0.98 in the early hours and journeyed to levels seen a touch north of H4 support at 0.9740 into the close. The 61.8% H4 Fibonacci retracement ratio also covers an area just north of 0.97 at 0.9712.
Weekly flow shows the candles remain capped by trend line support-turned resistance, drawn from the low 0.9187, with the unit eyeing a test of the 2018 yearly opening level at 0.9744. Beyond here, the 0.9613 January 13th low is seen, followed by 0.9410/0.9516 (green) – comprised of a 78.6% Fibonacci retracement at 0.9410, support at 0.9441 and a 127.2% AB=CD bullish correction (blue arrows]) at 0.9516.
Following last week’s rejection off daily resistance at 0.9843, support at 0.9771 was taken yesterday (now serving as potential resistance), perhaps sweeping the river south until we reach Quasimodo support at 0.9600, sited a handful of points ahead of the 0.9613 January 16th low.
Areas of consideration:
The combination of H4 support at 0.9740 and weekly support offered at 0.9744 could be enough to rebound price action today. While the majority of traders may target 0.98, daily resistance at 0.9771 could delay upside. With 30 points to play with from 0.9740, traders are urged to ensure risk/reward is in check, providing at least a 1:1 ratio to daily resistance.
Dow Jones Industrial Average:
Major US benchmarks extended losses Tuesday as bond yields slumped to a record low, raising further concerns over the potential global economic fallout from the coronavirus outbreak. Tuesday’s 900-point drop in the Dow Jones Industrial Average added to Monday’s 1000-point plunge.
The Dow Jones Industrial Average lost 879.44 points, or 3.15%; the S&P 500 declined 97.68 points, or 3.03% and the tech-heavy Nasdaq 100 ended lower by 244.77 points, or 2.70%.
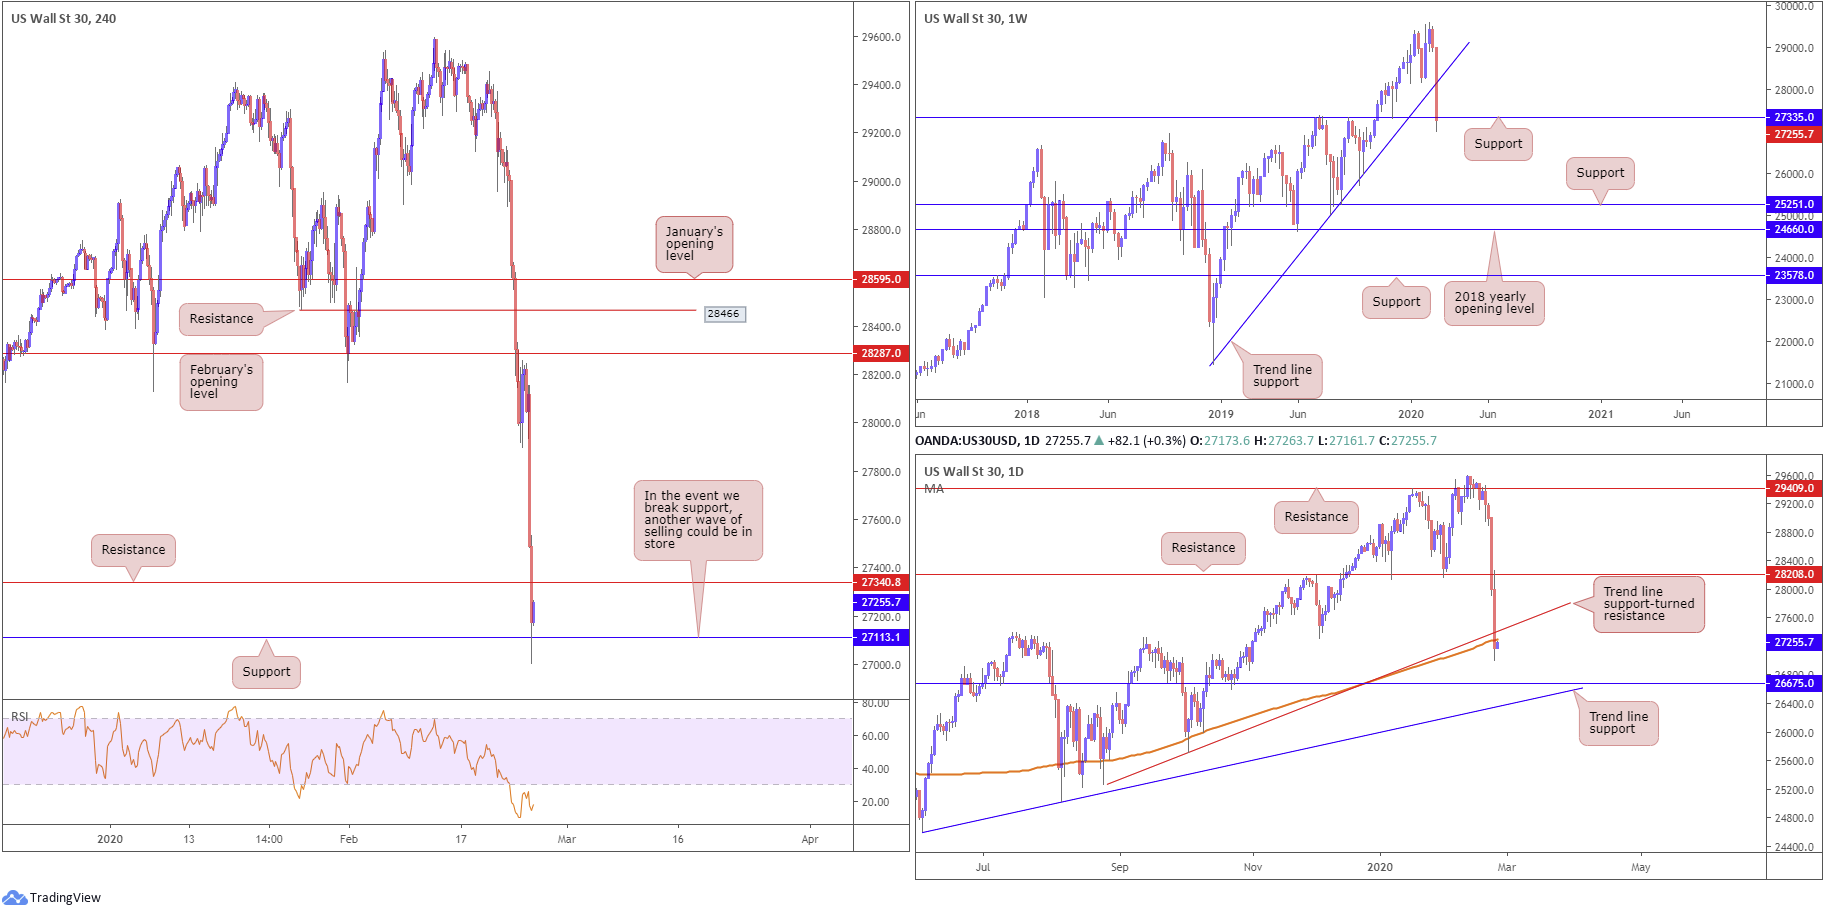
Technically, weekly price, thanks to recent selling, is seen gripping support at 27335 following trend line support, extended from the low 21452, giving way. Further downside, assuming a break of current support, could be heading for support priced in at 25251, which also represents a Quasimodo formation (left shoulder taken from 25215 March 11th, 2019).
The story on the daily timeframe shows price dethroned trend line support, taken from the low 25264 and mildly crossed the 200-day SMA (orange – 27292). As of current price, the index lurks just south of the said SMA, poised to retest the value as resistance.
Support on the H4 timeframe at 27113 entered the mix Tuesday, while resistance is seen close by at 27340. Support at 26689 is possible, in the event of further selling today. Traders may find use in noting the current H4 resistance merges closely with the 200-day SMA, while weekly support at 27335 may boost buying off the current H4 support level. However, given current geopolitical events, downside is the favoured route.
Areas of consideration:
A H4 close below 27113 today could spark another wave of selling in this market. Bearish themes south of this level, therefore, are an option, targeting H4 support at 26689. Conservative traders may consider waiting and seeing if a retest occurs before committing.
XAU/USD (GOLD):
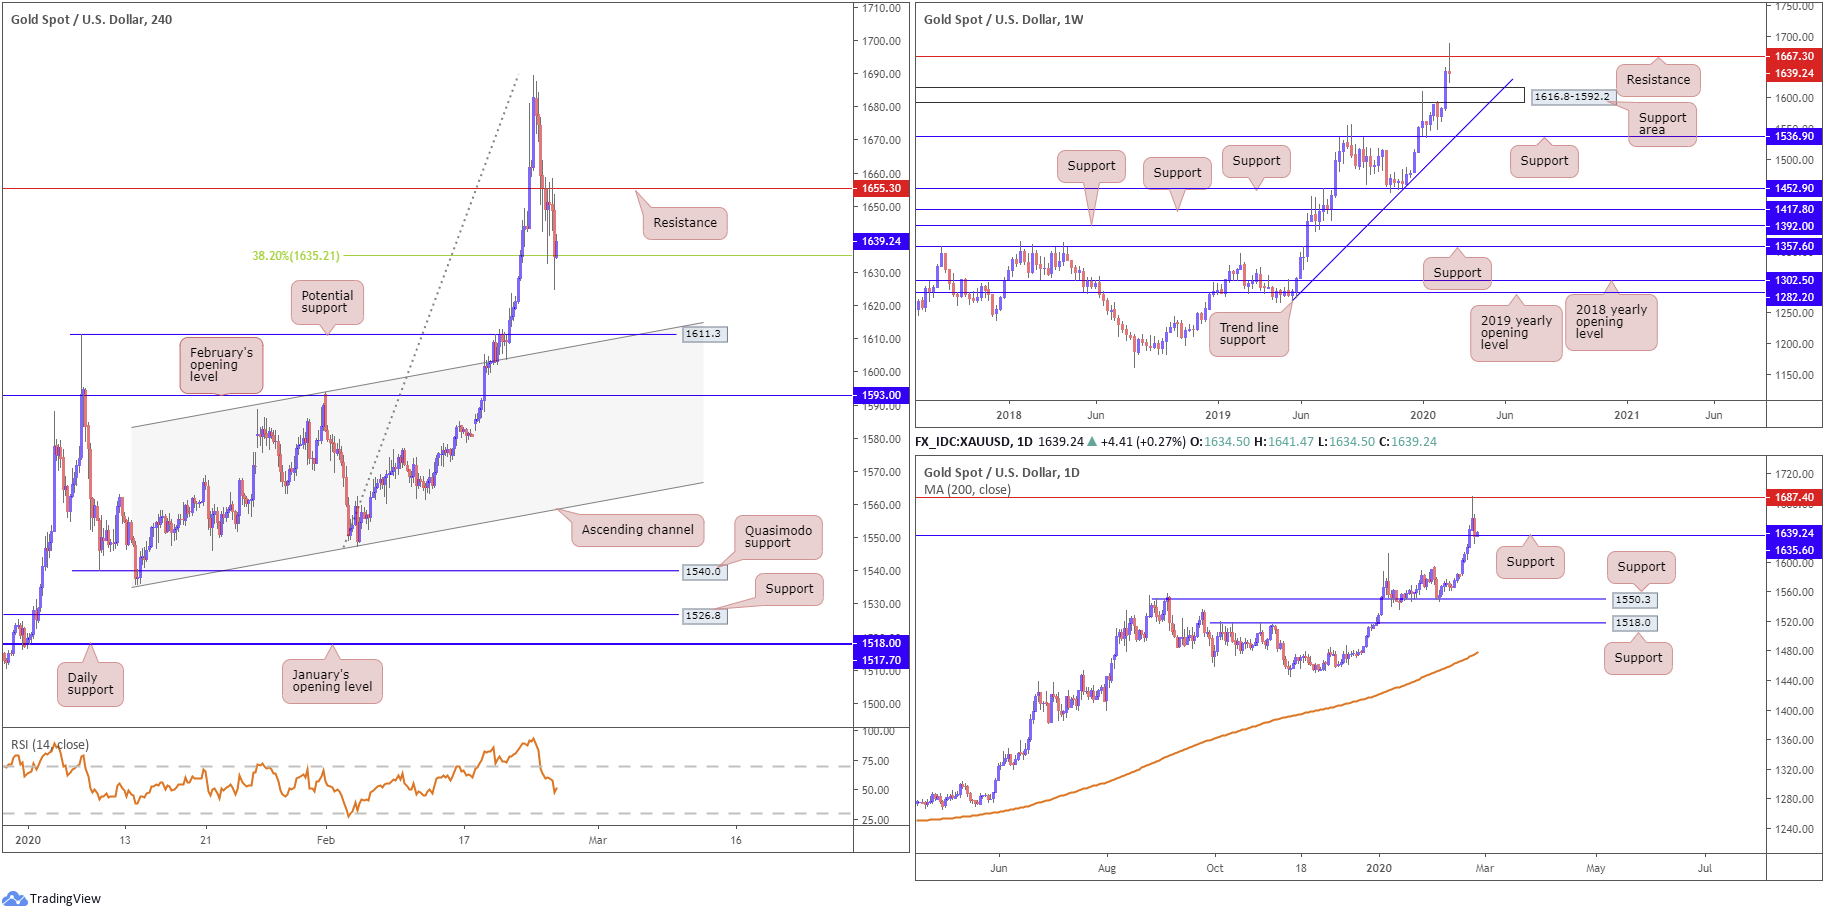
The price of gold, in $ terms, extended its weekly slide from multi-year tops Tuesday, yet has found some respite off the 38.2% Fibonacci retracement level at 1635.2, based on the H4 timeframe. Interestingly, the Fibonacci level aligns with daily support at 1635.6. Resistance continues to cap buying, withstanding several upside attempts so far this week.
H4 Support at 1611.3, which happens to merge with channel resistance-turned support, taken from the high 1593.9, remains a point of interest on this scale. Meanwhile, indicator-based traders may also wish to acknowledge the relative strength index (RSI) is seen attempting to bottom around the 50.0 value, following a downward move out of overbought territory
Higher-timeframe action has weekly price fading resistance at 1667.3, formed in the shape of a shooting star candlestick pattern. Continued selling from here could draw in a support area at 1616.8-1592.2. On the daily timeframe, resistance entered the fold at 1687.4, with support recently making a show at 1635.6.
Areas of consideration:
Daily support at 1635.6 could hold price action higher today. However, the top edge of the weekly support area is also of interest at 1616.8, given it converges closely with H4 support at 1611.3. Both are essentially valid reversal zones
Whether additional confirmation, such as candlestick patterns, is needed before pulling the trigger off either of the aforementioned supports is, of course, trader dependent. Traders are, however, urged to recognise we do have weekly resistance in play at 1667.3.
The accuracy, completeness and timeliness of the information contained on this site cannot be guaranteed. IC Markets does not warranty, guarantee or make any representations, or assume any liability regarding financial results based on the use of the information in the site.
News, views, opinions, recommendations and other information obtained from sources outside of www.icmarkets.com.au, used in this site are believed to be reliable, but we cannot guarantee their accuracy or completeness. All such information is subject to change at any time without notice. IC Markets assumes no responsibility for the content of any linked site.
The fact that such links may exist does not indicate approval or endorsement of any material contained on any linked site. IC Markets is not liable for any harm caused by the transmission, through accessing the services or information on this site, of a computer virus, or other computer code or programming device that might be used to access, delete, damage, disable, disrupt or otherwise impede in any manner, the operation of the site or of any user’s software, hardware, data or property.


