
Key risk events today:
Australia Construction Work Done q/q; RBNZ Governor Orr to Speak; ECB Financial Stability Review; US Prelim GDP q/q; US Unemployment Claims; US Revised UoM Consumer Sentiment; FOMC Meeting Minutes.
(Previous analysis as well as outside sources – italics).
EUR/USD:
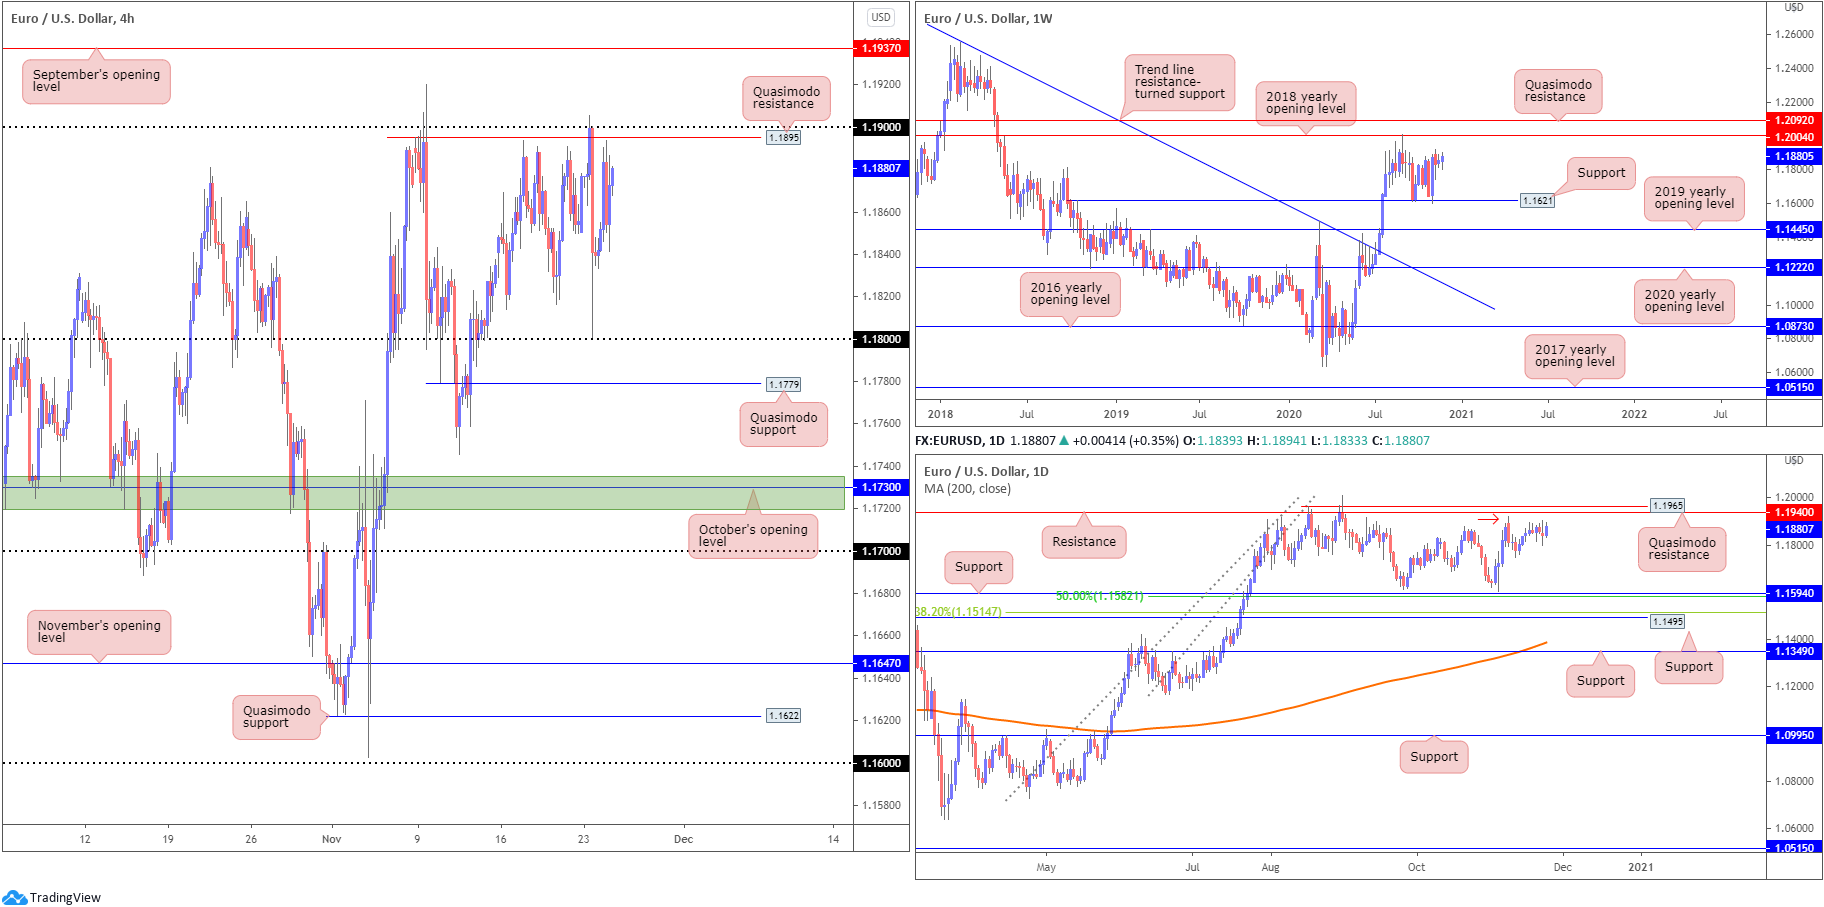
Europe’s single currency posted modest gains against the US dollar Tuesday, with H4 candles now seen touring just south of 1.19 and Quasimodo resistance at 1.1895. The scenery north of 1.19 reveals room to approach September’s opening value at 1.1937, while to the downside the 1.18 handle calls for attention, followed by Quasimodo support priced in at 1.1779.
Meanwhile, the weekly timeframe shows neither buyers nor sellers are willing to take control, despite healthy interest off support at 1.1621 early November. Should buyers regain consciousness, nevertheless, the 2018 yearly opening value at 1.2004, closely shadowed by Quasimodo resistance priced at 1.2092, are on show. Traders may also want to acknowledge July’s trend line resistance break, taken from the high 1.2555, on top of the break of the 1.1495 March 9 swing high, consequently placing long-term buyers in a reasonably healthy position.
The daily timeframe witnessed fresh highs form November 9 (red arrow), following a spike to lows ahead of support at 1.1594 and a 50.0% retracement ratio from 1.1582. For some, this may be understood as bullish confirmation. Resistance, however, is seen at 1.1940, followed by Quasimodo resistance from 1.1965. Traders may also recognise that just beyond the aforementioned resistances, weekly resistance at 1.2004 is seen (2018 yearly opening value).
Areas of consideration:
- 19 and H4 Quasimodo resistance at 1.1895 remains watched resistance.
- 18 is likely watched in this market. Sell-stop liquidity resting south of this round number (protective stop-loss orders and breakout sellers’ orders) may also tempt a fakeout lower to draw in fresh buyers from H4 Quasimodo support at 1.1779.
- Possible breakout buying north of 1.19 on the H4, targeting September’s opening value at 1.1937.
- September’s opening value on the H4 and daily resistance at 1.1940 marks healthy confluence to work with if a breach of 1.19 occurs.
GBP/USD:
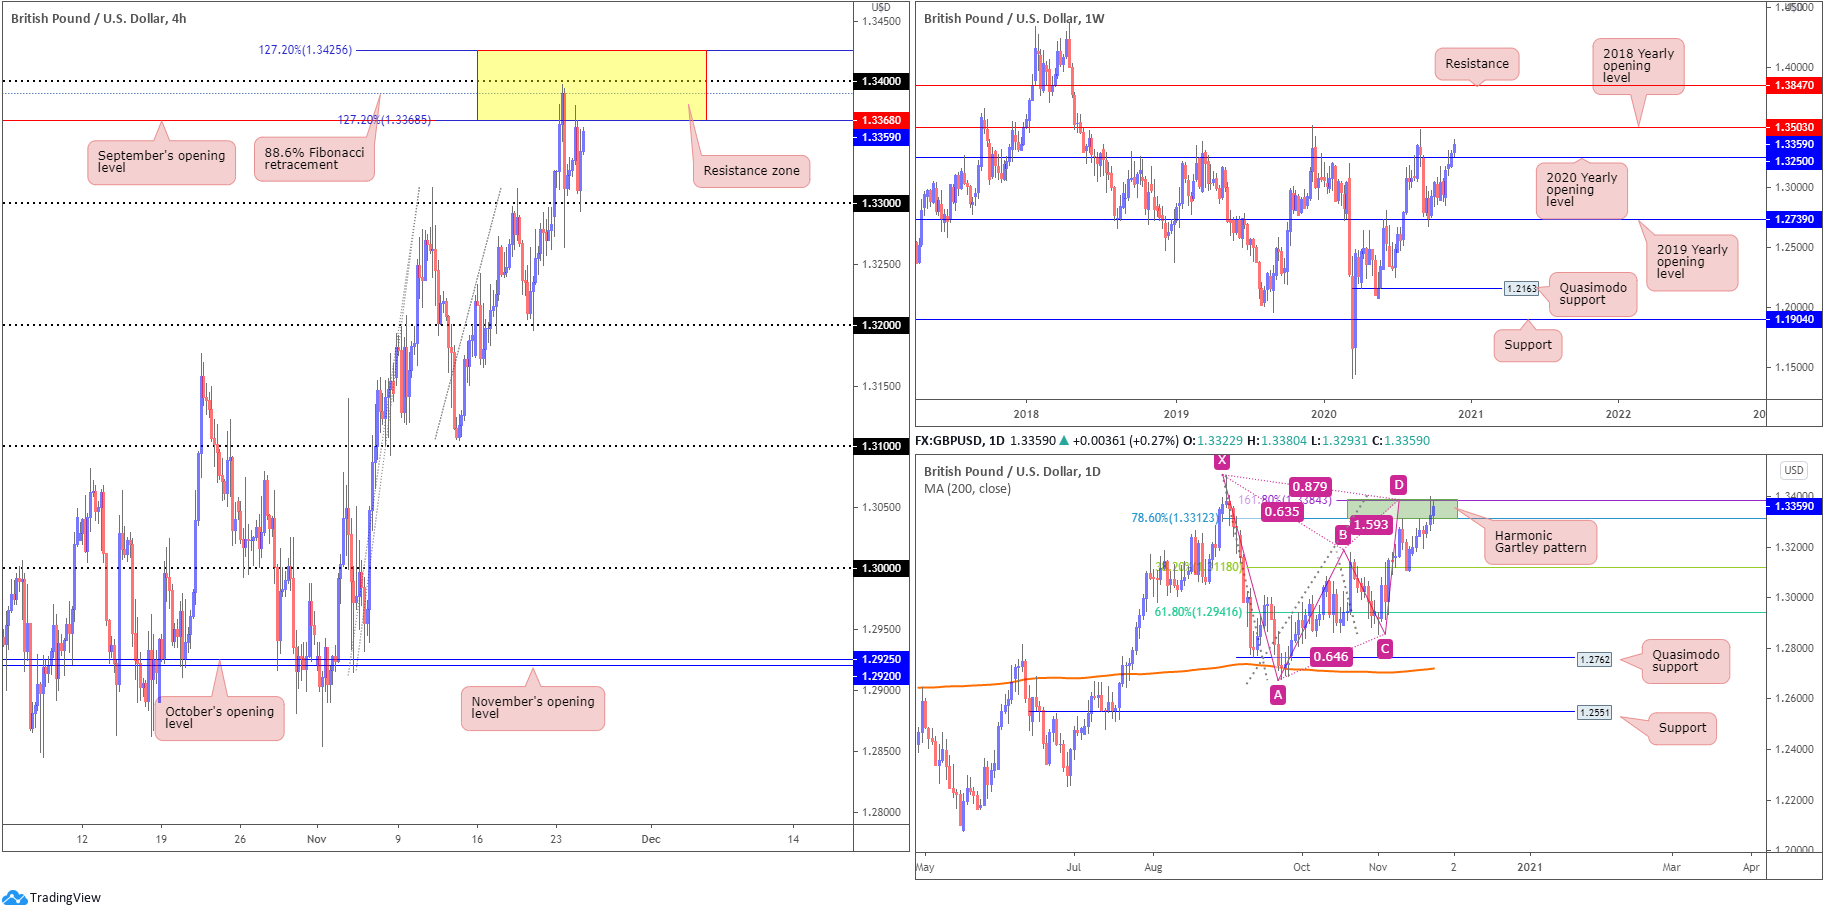
GBP/USD entered another offensive phase Tuesday, bid on the back of risk-on trading. Recording a third consecutive daily advance, deriving technical support from the 1.33 region, H4 is circling within striking distance of familiar resistance between 1.3425/1.3368 (made up of two 127.2% Fibonacci projection points at 1.3425/1.3368, the round number 1.34, an 88.6% Fibonacci retracement ratio at 1.3390 and September’s opening value at 1.3368).
From the weekly timeframe, after rejecting the 2019 yearly opening value from 1.2739 in September, buyers eventually mustered enough strength to take on the 2020 yearly opening value at 1.3250 last week and record a third consecutive weekly gain. Additional strength could have the unit knock on the door of the 2018 yearly opening value from 1.3503. Technically, however, the immediate trend has remained lower since topping in 2014.
Elsewhere, the daily picture, thanks to recent upside, is seen squeezing sellers within the bearish harmonic Gartley pattern’s PRZ at 1.3384/1.3312. Overthrowing the aforementioned PRZ could be viewed as an early cue we’re headed for the 2018 yearly opening value at 1.3503 on the weekly scale.
Areas of consideration:
- Weekly buyers targeting 1.3503 and daily sellers under pressure within the bearish harmonic Gartley pattern’s PRZ at 1.3384/1.3312, positions H4 sellers out of the resistance zone from 1.3425/1.3368 in a vulnerable position.
- Bullish scenarios, in light of the above analysis, may be found north of the 1.34 handle (H4) today.
AUD/USD:
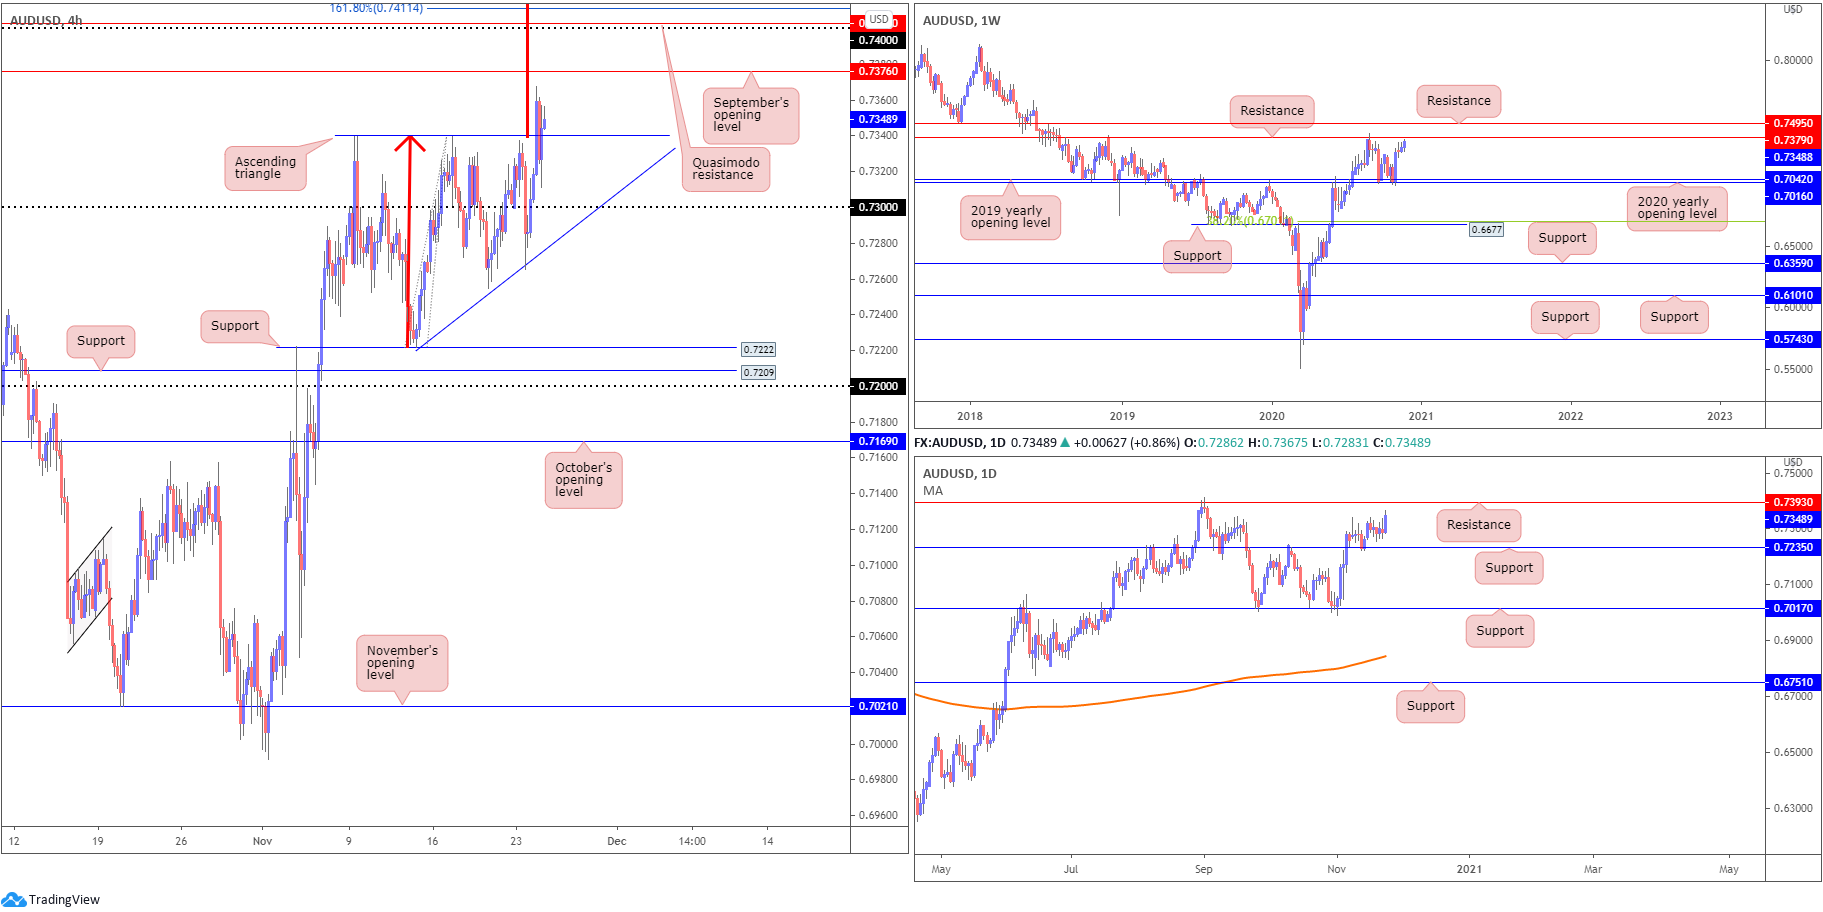
Risk currencies outperformed Tuesday, with AUD/USD rallying nearly 1% and breaching the top side of a H4 ascending triangle pattern (0.7340). This projects a possible target of around 0.7544 (red arrows), implying a break above September’s opening value at 0.7376, the 0.74 handle and Quasimodo resistance at 0.7403.
Buyers, based on the weekly timeframe, are seen extending the 3% showing off the 2020 (0.7016) and 2019 (0.7042) yearly opening values (supports) formed early November, positioning the unit within striking distance of resistance at 0.7379. In view of this market trending higher since early 2020, buyers may also be eyeballing resistance parked at 0.7495.
Following the November 13 retest of support at 0.7235, despite a somewhat lacklustre performance last week, buyers have eventually found some grip and shined the spotlight on resistance at 0.7393 (positioned above weekly resistance).
Areas of consideration:
- A 0.73 retest could interest buyers on the H4, having noted the ascending triangle breakout, initially targeting September’s opening value at 0.7376 and the 0.74 handle.
- September’s opening value at 0.7376, weekly resistance at 0.7379 and daily resistance at 0.7393 form an area of resistance to be mindful of.
USD/JPY:
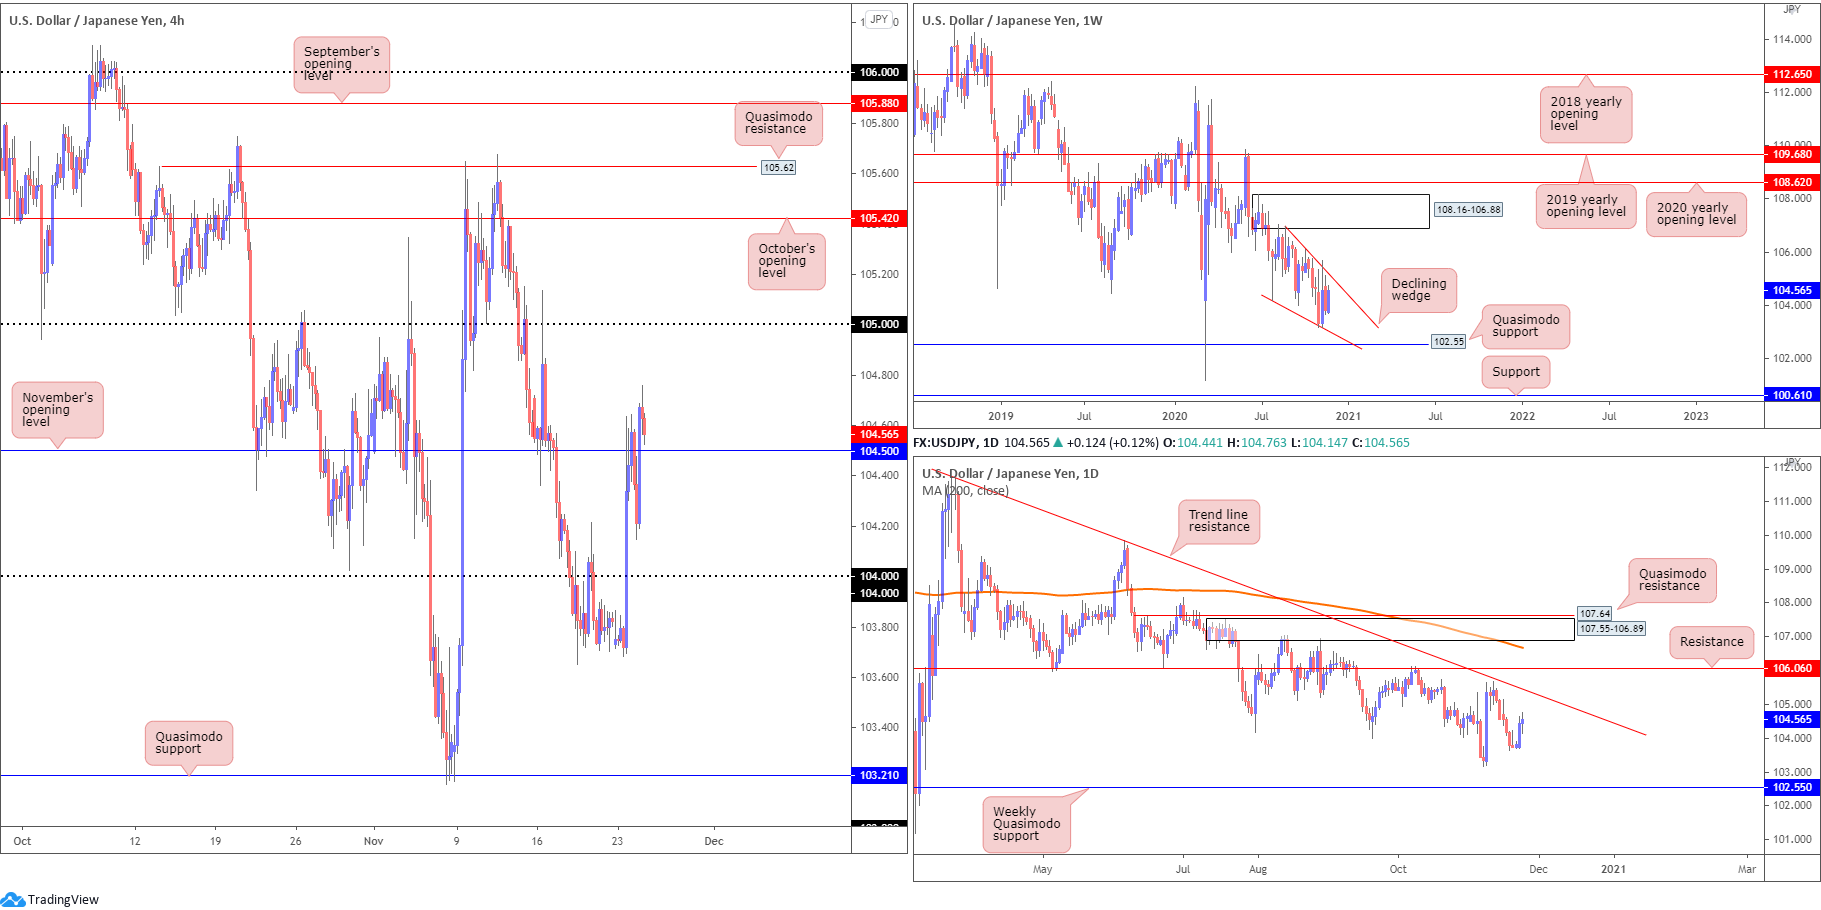
Appreciating for a third consecutive session, upbeat risk sentiment bolstered USD/JPY movement going into London’s morning session on Tuesday. Dumping the yen in favour of the buck led H4 above November’s opening value at 104.50 to peaks at 104.76.
With H4 poised to retest 104.50, and room for buyers to hone in on the 105 handle, a rigid defence may be seen off 104.50 today.
Against the backdrop of the H4 timeframe, weekly price, since connecting with the underside of supply at 108.16-106.88 in August, has gradually shifted lower and developed a declining wedge (106.94/104.18). Quasimodo support at 102.55 is in the picture, with a break exposing support plotted at 100.61. A strong bounce from 102.55 may provide enough impetus for buyers to attempt a breakout above the current declining wedge.
The technical landscape from the daily timeframe, however, reveals scope to close in on trend line resistance, extended from the high 111.71, with a break to perhaps take a run at resistance from 106.06. Nevertheless, sellers taking over could lead price to the 103.17 November 6 low, followed by weekly Quasimodo support at 102.55.
Areas of consideration:
- Higher timeframes demonstrate room to advance.
- Retesting 104.50 on the H4 scale today may be a platform buyers show interest in, targeting at least 105.
USD/CAD:
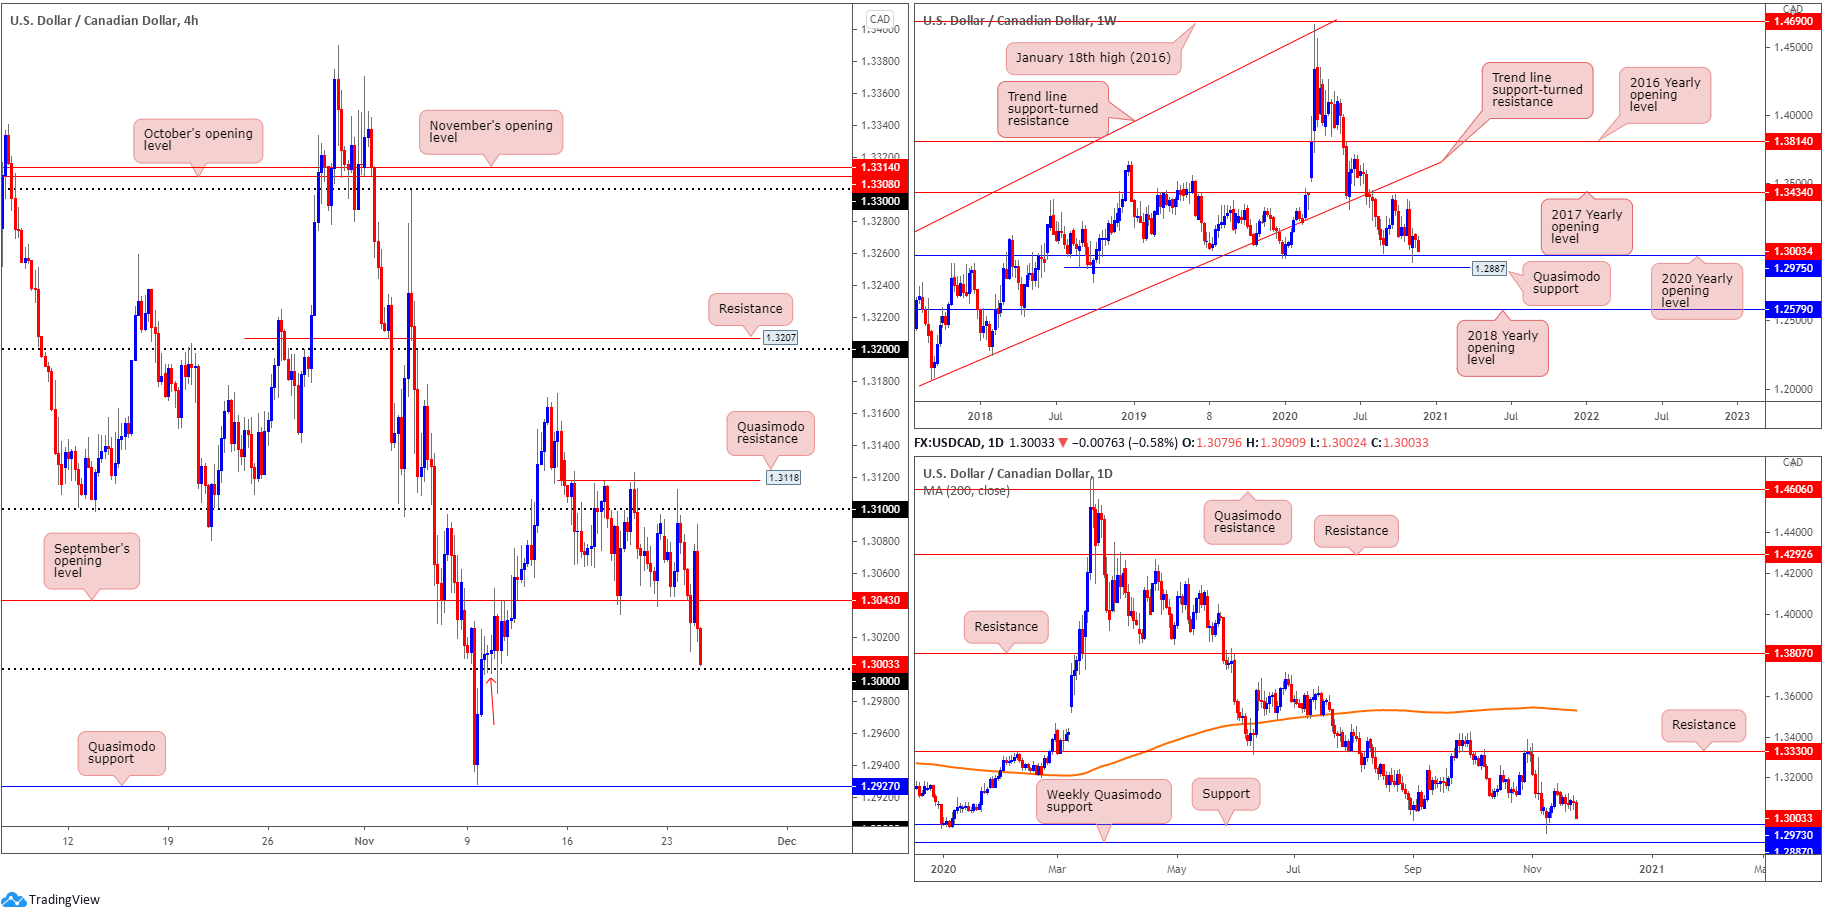
The US dollar slipped to 2-week lows against the Canadian dollar Tuesday, weighed by WTI climbing above $44.50 a barrel and the US dollar index tunnelling through 92.50.
Demolishing September’s opening value at 1.3043 on the H4 scale has led candles to within touching distance of the key figure 1.30 (a widely watched level in this market that’s joined by a Quasimodo support [red arrow] around 1.2997). Removing the round number today may clear the river south towards H4 Quasimodo support at 1.2927.
However, before reaching for the aforementioned H4 Quasimodo, traders might want to take into account weekly support resides close by in the form of a 2020 yearly opening value at 1.2975, as well as daily support coming in at 1.2973 (essentially marking the same region).
Areas of consideration:
- Immediate support could arise from the 1.30 level on the H4 timeframe this morning, with buyers also perhaps recognising the barrier comes with a Quasimodo support at 1.2997.
- A H4 close south of 1.30 underlines intraday bearish scenarios, though sellers must take into account weekly and daily support are stationed nearby around 1.2975.
- A fakeout through 1.30 to welcome buyers off weekly/daily supports at 1.2975ish could arise. A reaction off higher timeframe supports, fuelled on sell-stop liquidity, may see buyers close back above 1.30, a move that may attract additional buyers back to September’s opening value at 1.3043.
USD/CHF:
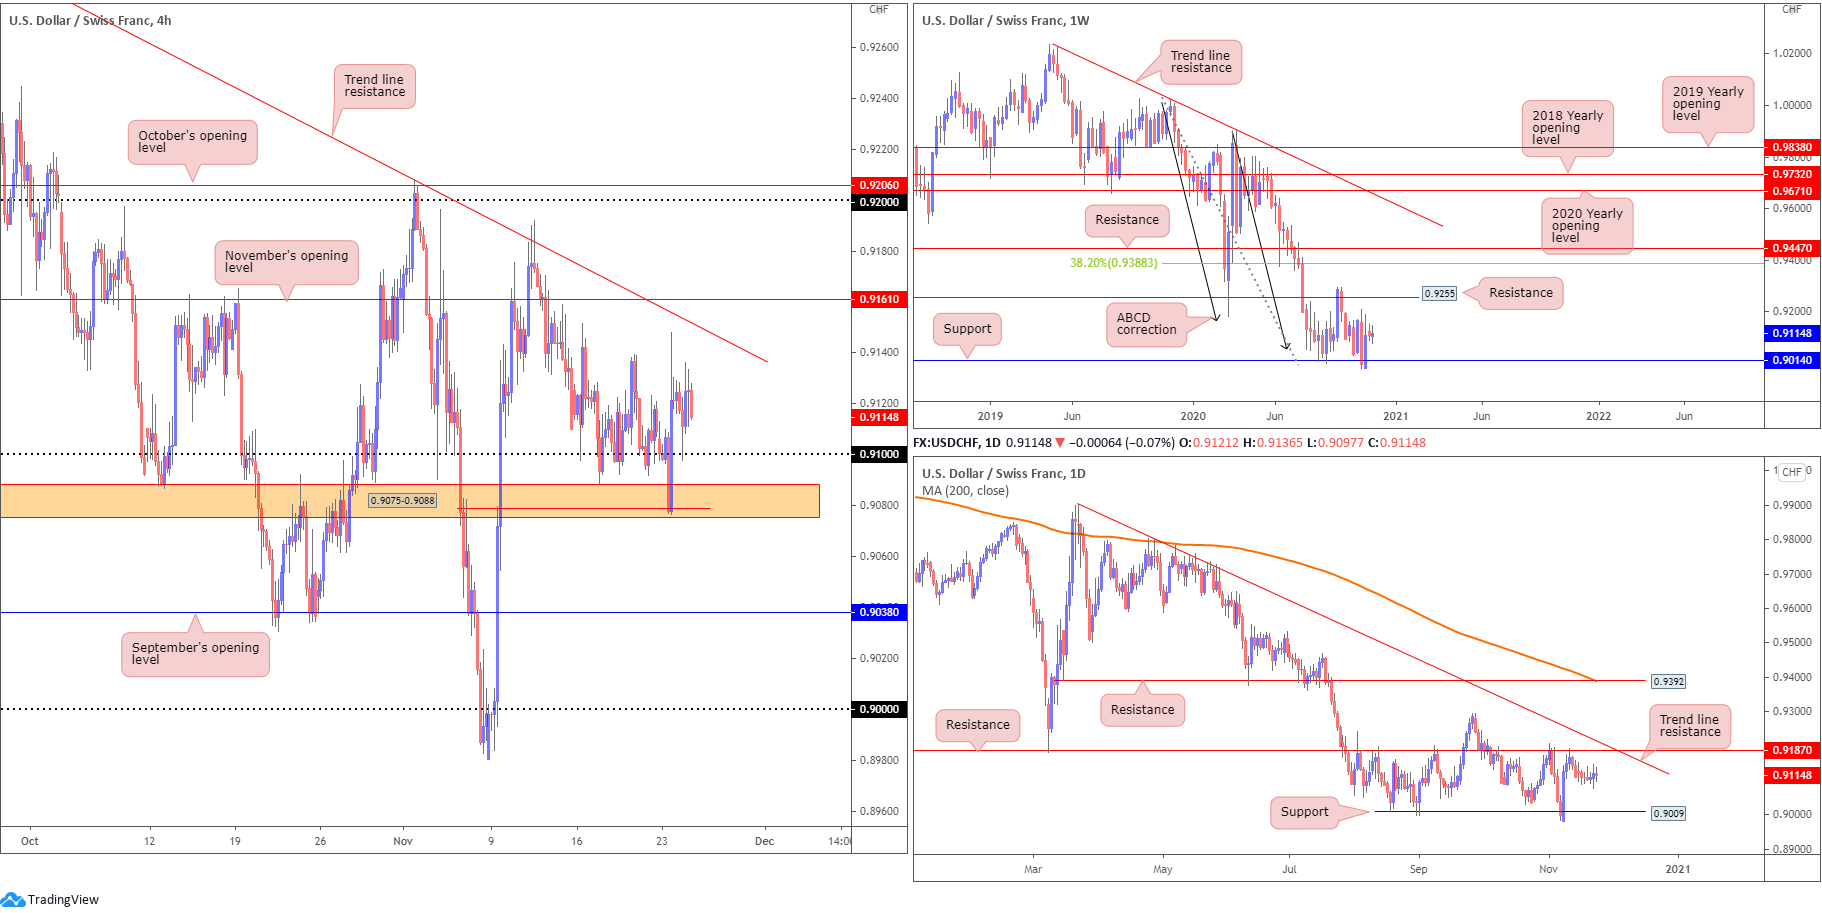
For those who have been following our USD/CHF analysis over the past few days, technical traders will acknowledge the recent recovery from H4 support at 0.9075-0.9088 and, of course, the whipsaw through 0.91. The retest of the noted round number yesterday, a move highlighted as a possibility in Tuesday’s technical briefing, could lead buyers to test H4 trend line resistance, extended from the high 0.9295, followed by November’s opening value at 0.9161.
Action on the higher timeframes, however, remains pretty much unmoved, with daily price chalking up back-to-back indecision doji candles.
Weekly timeframe:
The prior week witnessed buyers strongly rebound from support at 0.9014, a level dovetailing closely with ABCD support at 0.9051 (black arrows). Bid/offers, however, were even last week, finishing unmoved.
0.9255 resistance (a prior Quasimodo support) is next in the firing range should buyers support this market, with a 38.2% Fibonacci retracement ratio forged at 0.9388 to target should further buying emerge (an initial take-profit zone associated with the ABCD support mentioned above).
It should also be noted this market has been trending lower since April 2019.
Daily timeframe:
From the daily timeframe, price remains languishing south of resistance at 0.9187. While Quasimodo support at 0.9009 represents a possible downside objective on this chart, it’s worth acknowledging trend line resistance also resides close by, taken from the high 0.9901.
Areas of consideration:
- Room to discover higher levels on the bigger picture suggests H4 buyers out of 0.9075-0.9088 and off 0.91 could see H4 trend line resistance and November’s opening value at 0.9161 enter play today.
- Beyond 0.9075-0.9088, assuming a lack of commitment from buyers, bearish themes could develop towards September’s opening value at 0.9038, followed by the 0.90 level.
Dow Jones Industrial Average:
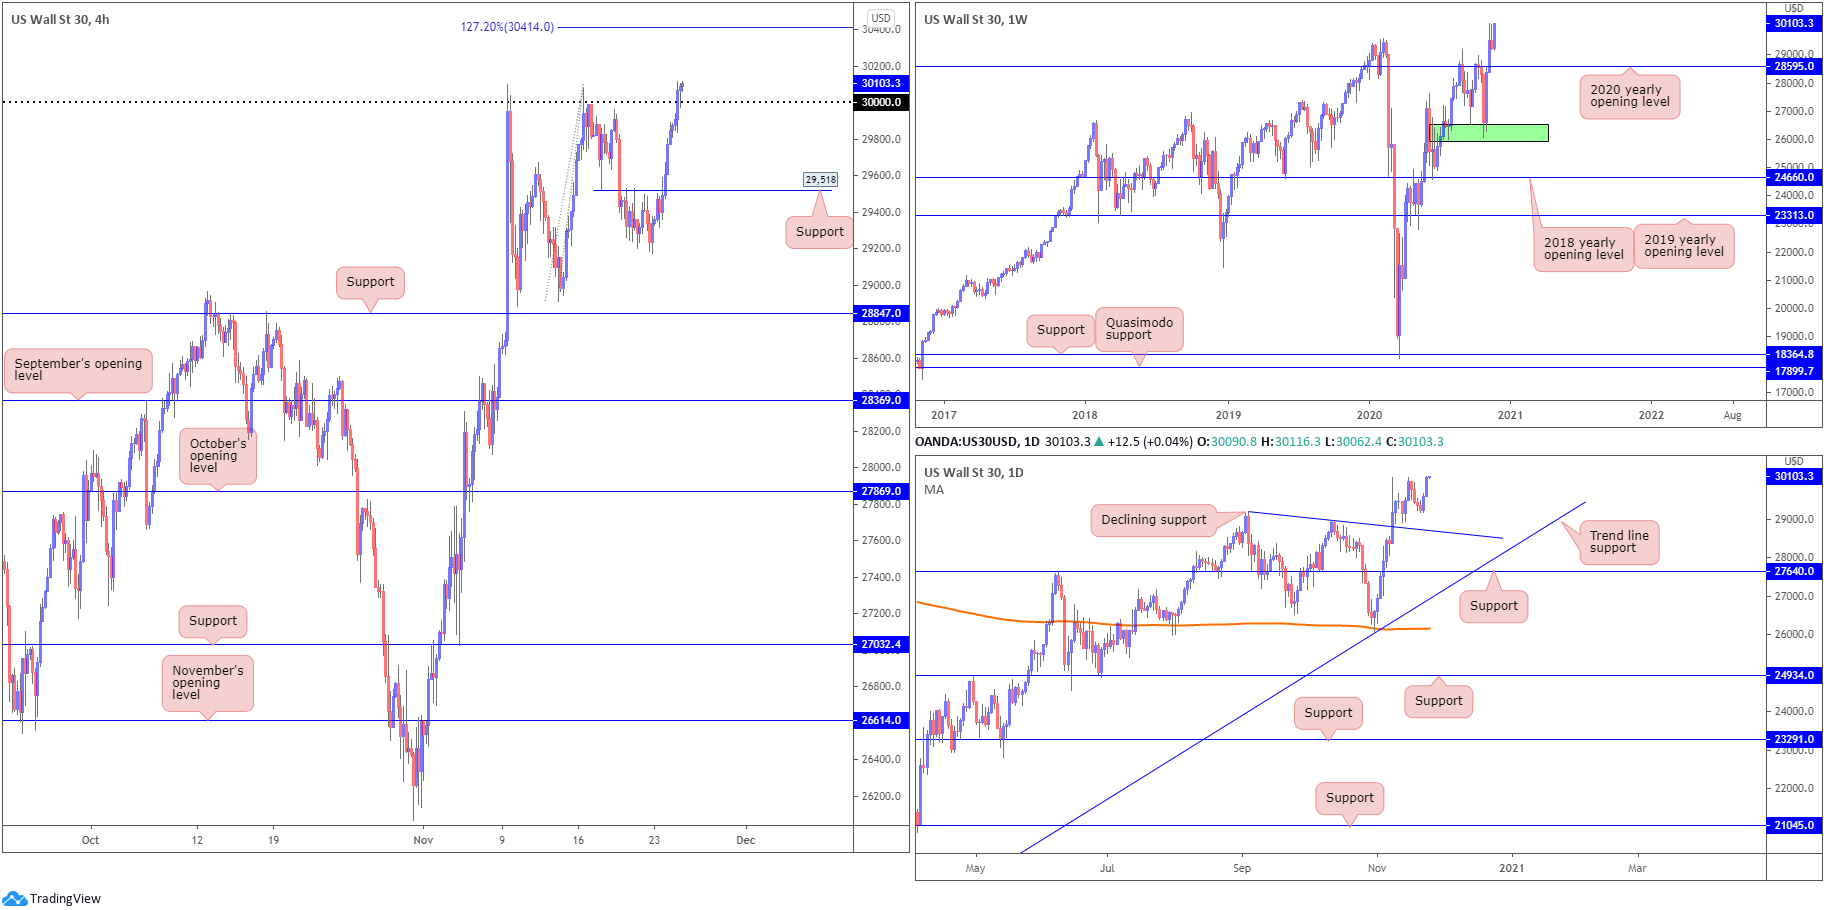
US stocks finished higher Tuesday, with the Dow topping 30,000 for the first time in history. The Dow Jones Industrial Average added 454.97 points, or 1.54%; the S&P 500 traded higher by 57.82 points, or 1.62%, and the Nasdaq ended higher by 156.15 points, or 1.31%.
With the unit closing north of 30,000 and retesting the latter on the H4 scale in the shape of a hammer candlestick pattern, buyers could defend 30,000 given limited resistance until reaching a 127.2% H4 Fibonacci projection point at 30,414. Should 30,000 give way, H4 support at 29,518 is in sight.
Areas of consideration:
- Buyers observing H4 price holding 30,000 could be enough to stir additional buying, targeting the 2% H4 Fibonacci projection at 30,414.
XAU/USD (GOLD):
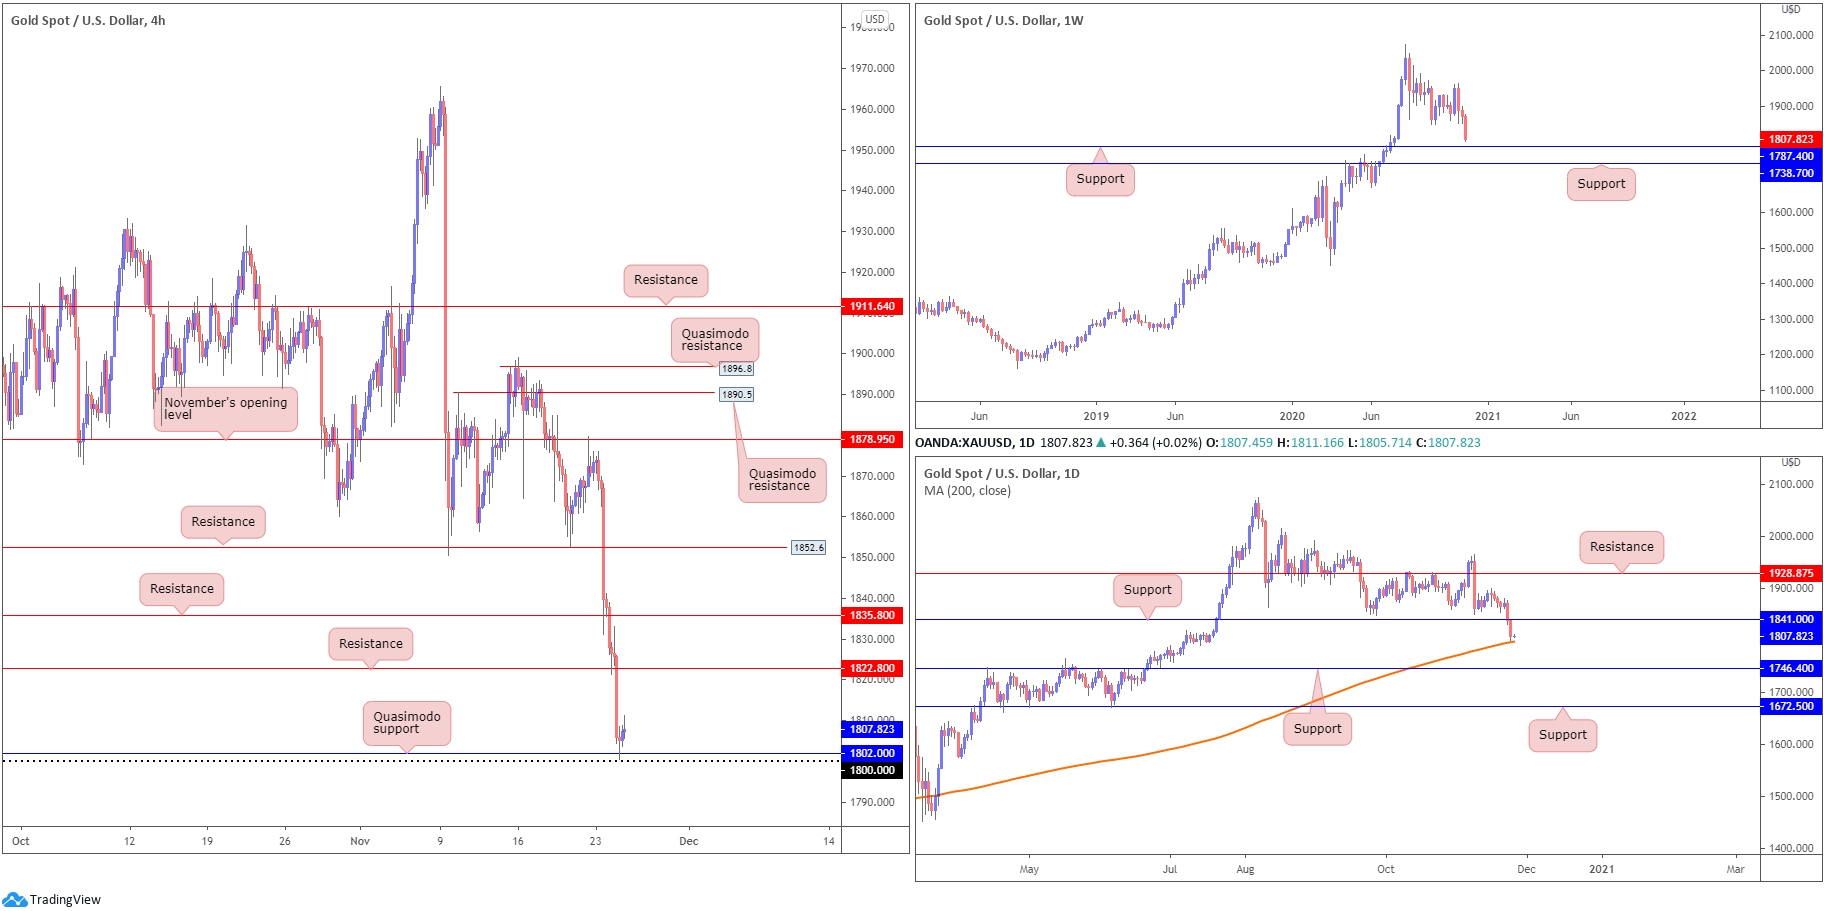
Spot gold registered a second day of losses Tuesday, down 1.7% against the US dollar.
Despite the precious metal discovering lower levels amid COVID-19 vaccine developments (moves that drove equities sharply higher), H4 action recently revealed mild respite off the $1,800 level and a Quasimodo support level at $1,802.
H4 buyers, however, may struggle to find a foothold off $1,800 as daily action reveals a possible fakeout through $1,800 into the 200-day SMA (orange – $1,797).
Areas of consideration:
- H4 whipsawing through $1,800 to test the 200-day SMA on the daily timeframe at $1,797 is a scenario worth keeping an eye out for. Buyers defending the SMA and printing a H4 close back above $1,800 may invite additional buyers into the fight.
- Holding south of $1,800, on the other hand, could fuel continuation selling towards weekly support at $1.787.
The accuracy, completeness and timeliness of the information contained on this site cannot be guaranteed. IC Markets does not warranty, guarantee or make any representations, or assume any liability regarding financial results based on the use of the information in the site.
News, views, opinions, recommendations and other information obtained from sources outside of www.icmarkets.com.au, used in this site are believed to be reliable, but we cannot guarantee their accuracy or completeness. All such information is subject to change at any time without notice. IC Markets assumes no responsibility for the content of any linked site.
The fact that such links may exist does not indicate approval or endorsement of any material contained on any linked site. IC Markets is not liable for any harm caused by the transmission, through accessing the services or information on this site, of a computer virus, or other computer code or programming device that might be used to access, delete, damage, disable, disrupt or otherwise impede in any manner, the operation of the site or of any user’s software, hardware, data or property


