
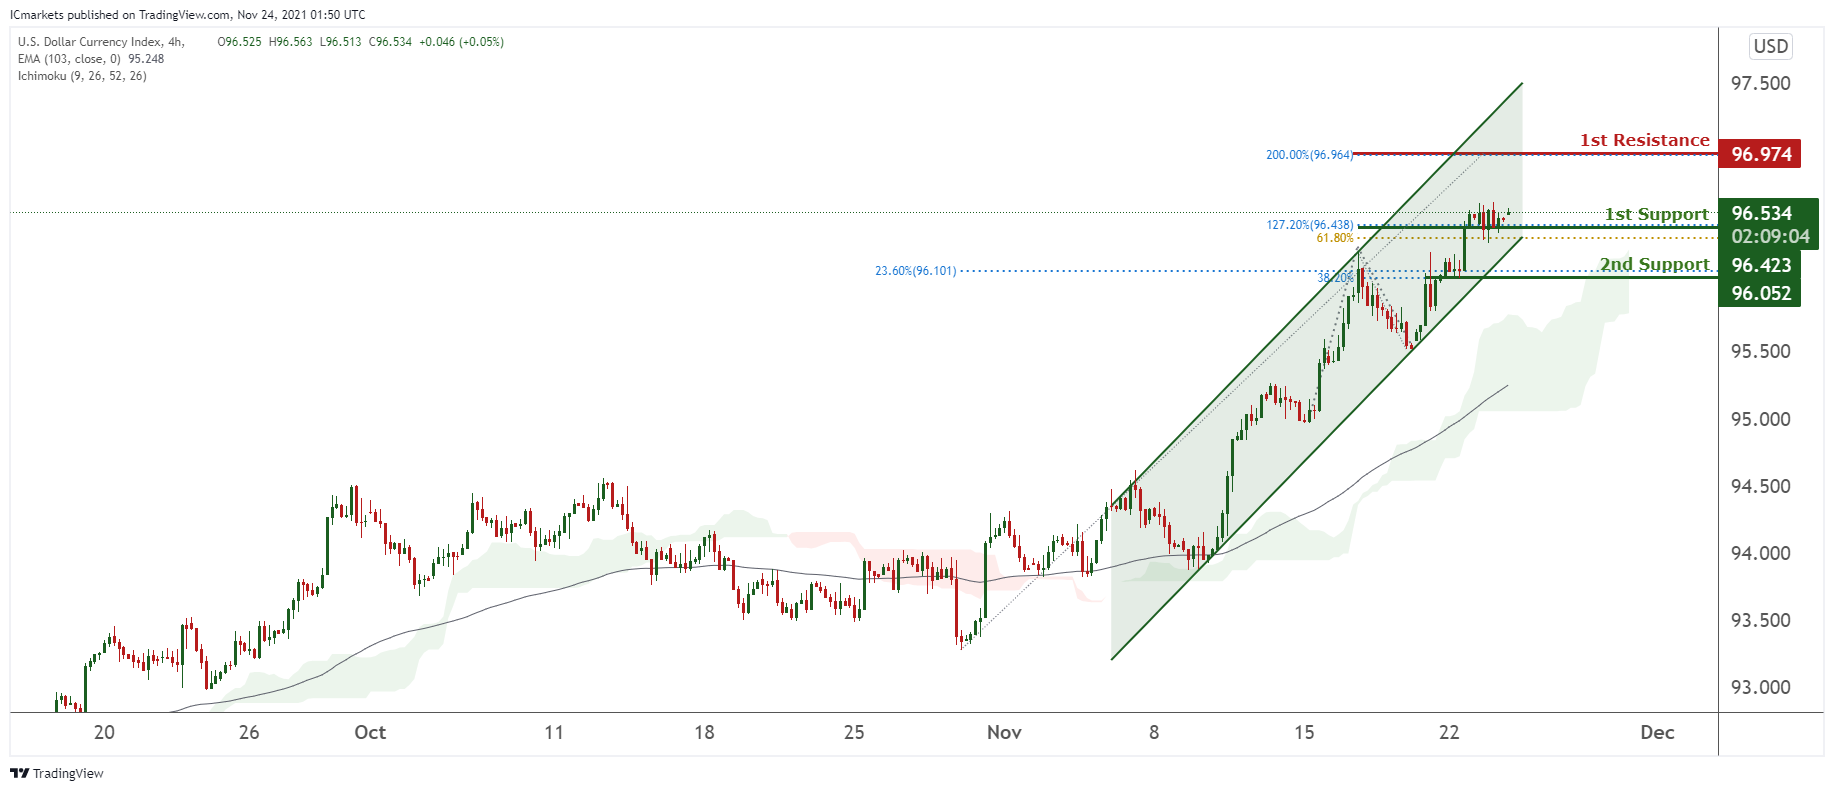
DXY:
On the H4 timeframe, prices are on a bullish momentum and consolidating in a parallel channel. We see potential for prices to climb from our 1st support at 96.423 in line with 127.2% and 61.8% Fibonacci extension towards our 1st resistance at 96.974 in line with 200% Fibonacci projection. Technical indicators are showing bullish momentum. Alternatively, breaking our 1st support might find prices dip towards our 2nd support at 96.052 in line with 38.2% and 23.6% Fibonacci retracement.
Areas of consideration:
- H4 time frame, 1st resistance at 96.974
- H4 time frame, 1st support at 96.534
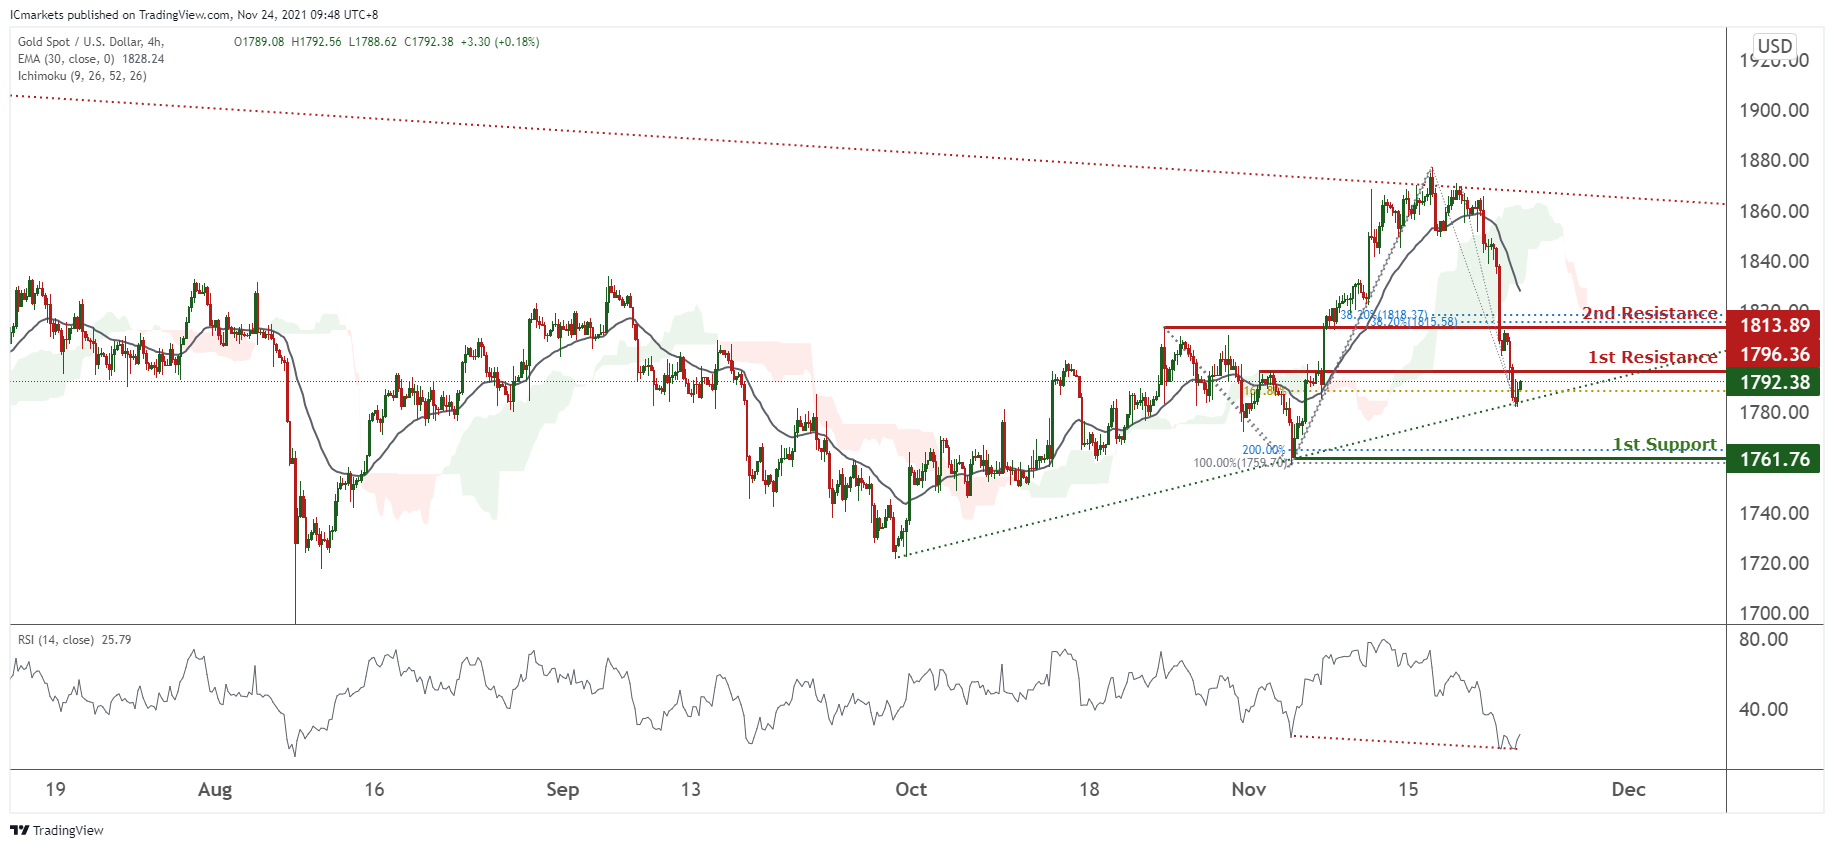
XAU/USD (GOLD):
On the H4 chart, prices are consolidating in a daily triangle. Bearish divergence is spotted in RSI, leading us to see potential for dip from our 1st resistance at 1796.36 in line with 161.8% Fibonacci projection towards our 1st support at 1761.76 in line with 200% Fibonacci extension and 100% Fibonacci retracement. However, technical indicators are showing bearish momentum. Alternatively, prices may bounce towards our 2nd resistance at 1813.89 in line with 38.2% and 38.2% Fibonacci retracement.
Areas of consideration:
- 4h 1st support at 1761.76
- 4h 1st resistance at 1796.36
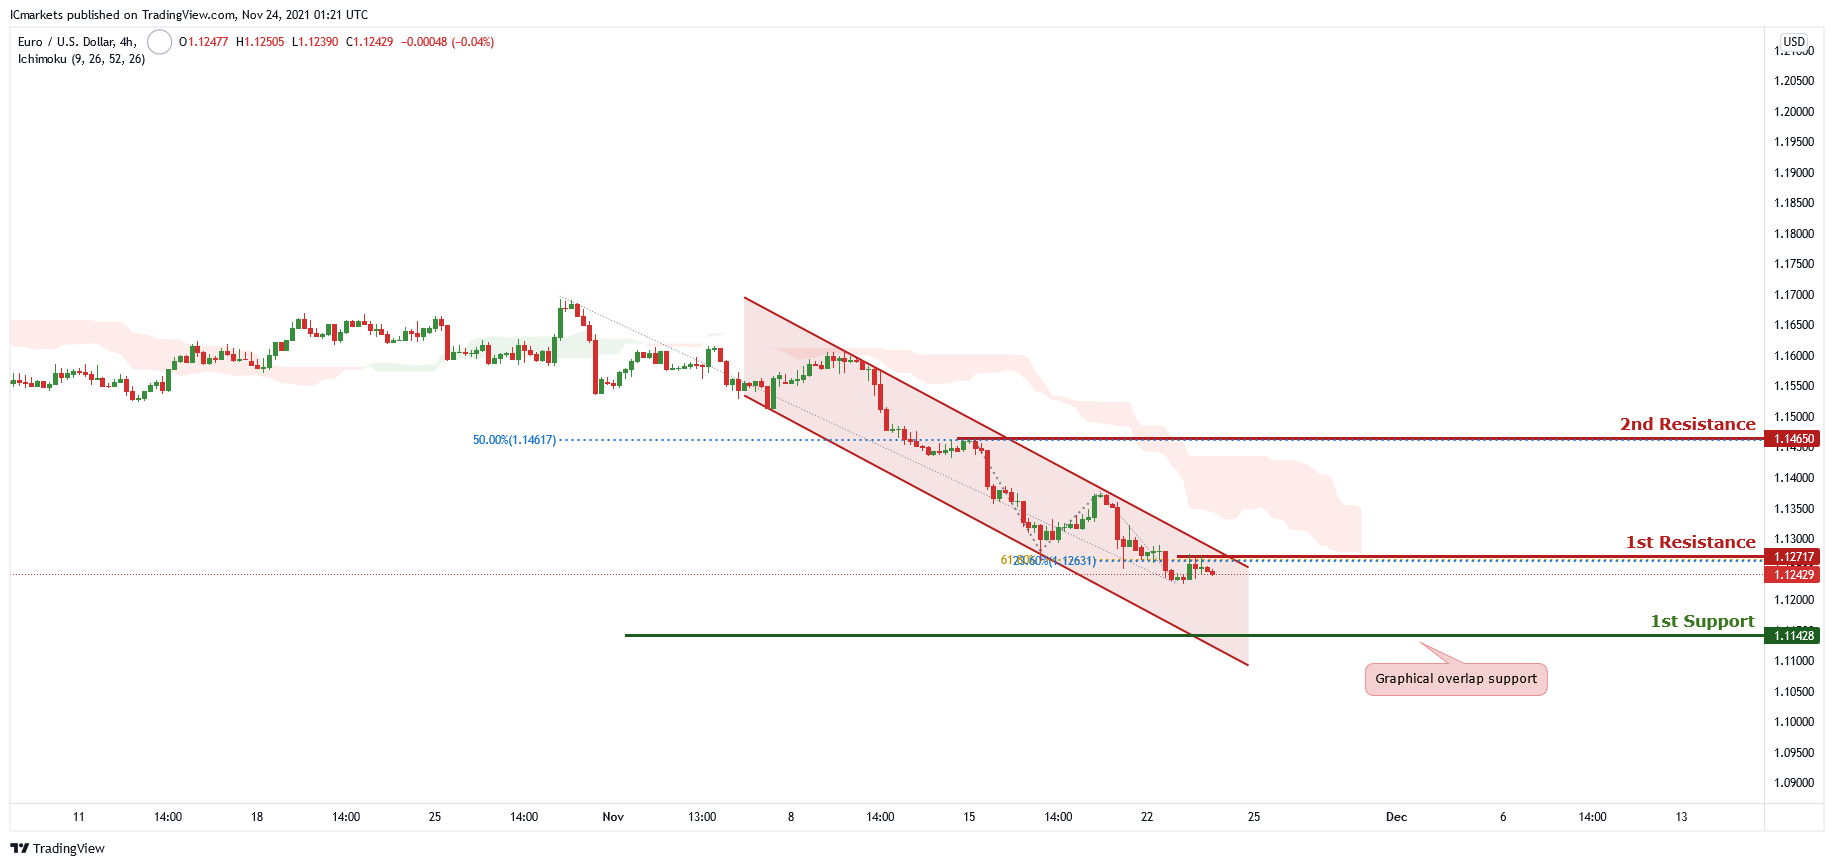
EUR/USD:
Price is trading in a descending channel and is near the first resistance level of 1.2717 which is also 23.6% Fibonacci retracement and 61.8% Fibonacci projection. Price can potentially dip to the first support level of 1.11428 which is also the graphical support level. Our bearish bias is supported by the ichimoku cloud indicator as price is trading below it.
Areas of consideration :
1st resistance – 1.2717
1st support – 1.11428
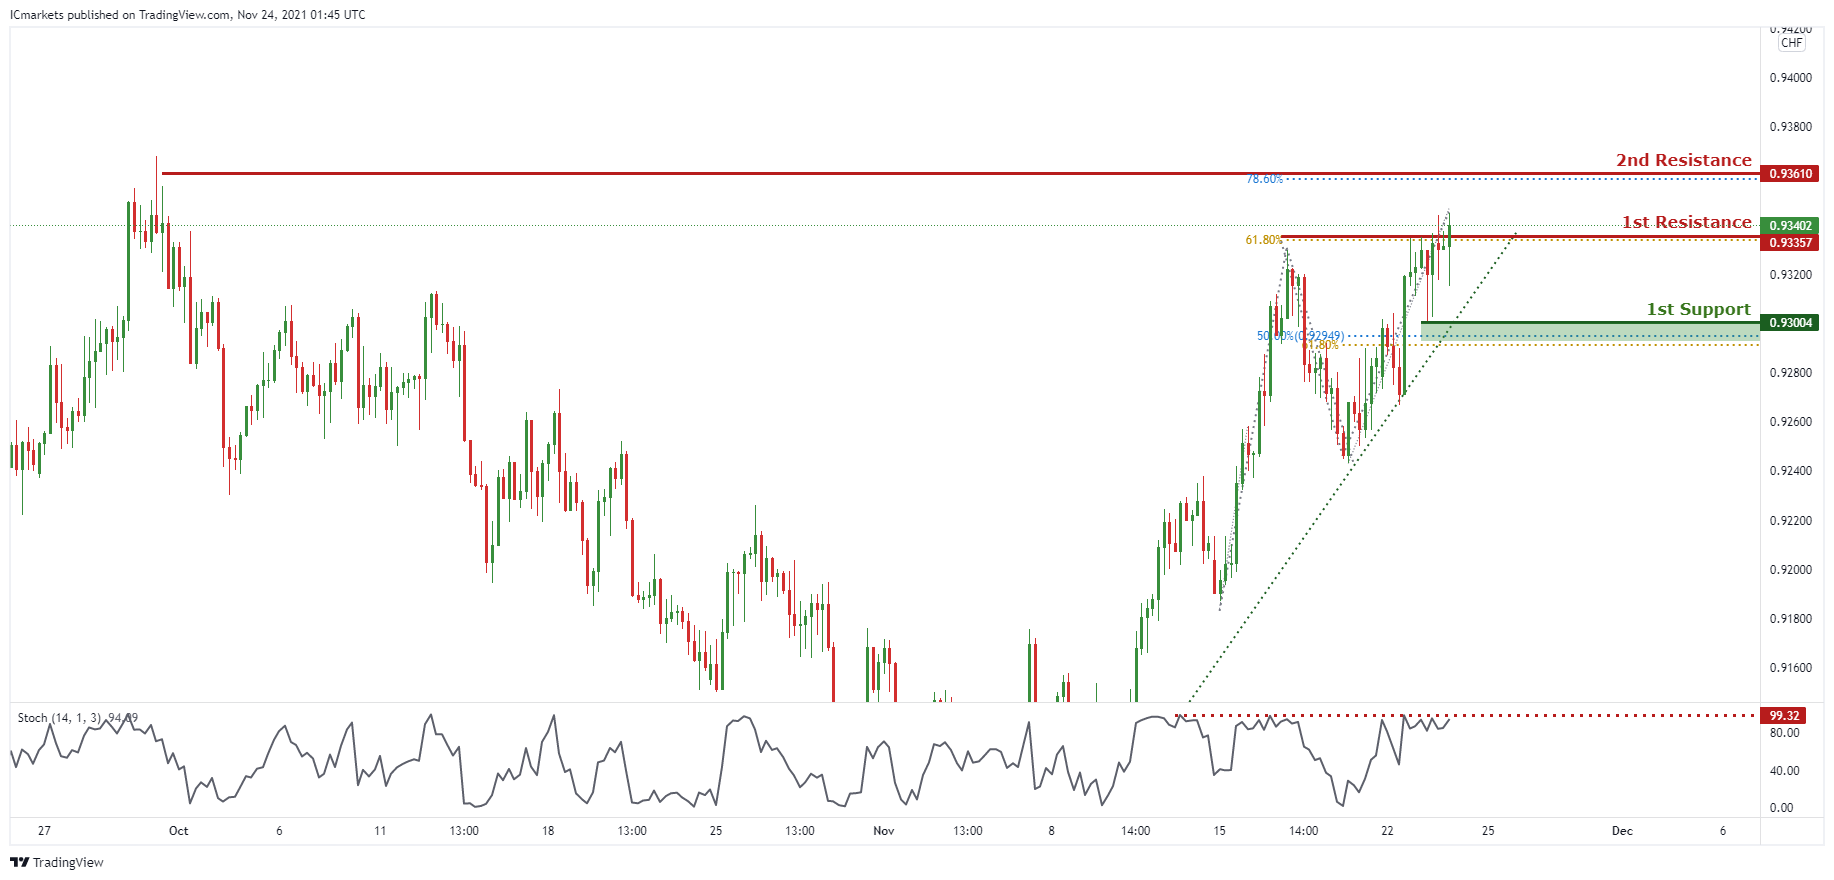
USD/CHF:
On the H4 timeframe, price is abiding to the ascending trendline support, signifying an overall bullish momentum. However, price has approached the 1st resistance in line with 61.8% Fibonacci projection and previous swing high hence, we can expect a potential short-term retracement. We can expect price to drop from 1st Resistance towards 1st Support in line with 61.8% Fibonacci projection and 50% Fibonacci retracement. Our short-term bearish bias is further supported by the stochastic indicator where the %K line is at the resistance level.
Areas of consideration:
- Watch 1st Support at 0.93004
- Watch 1st Resistance at 0.93225
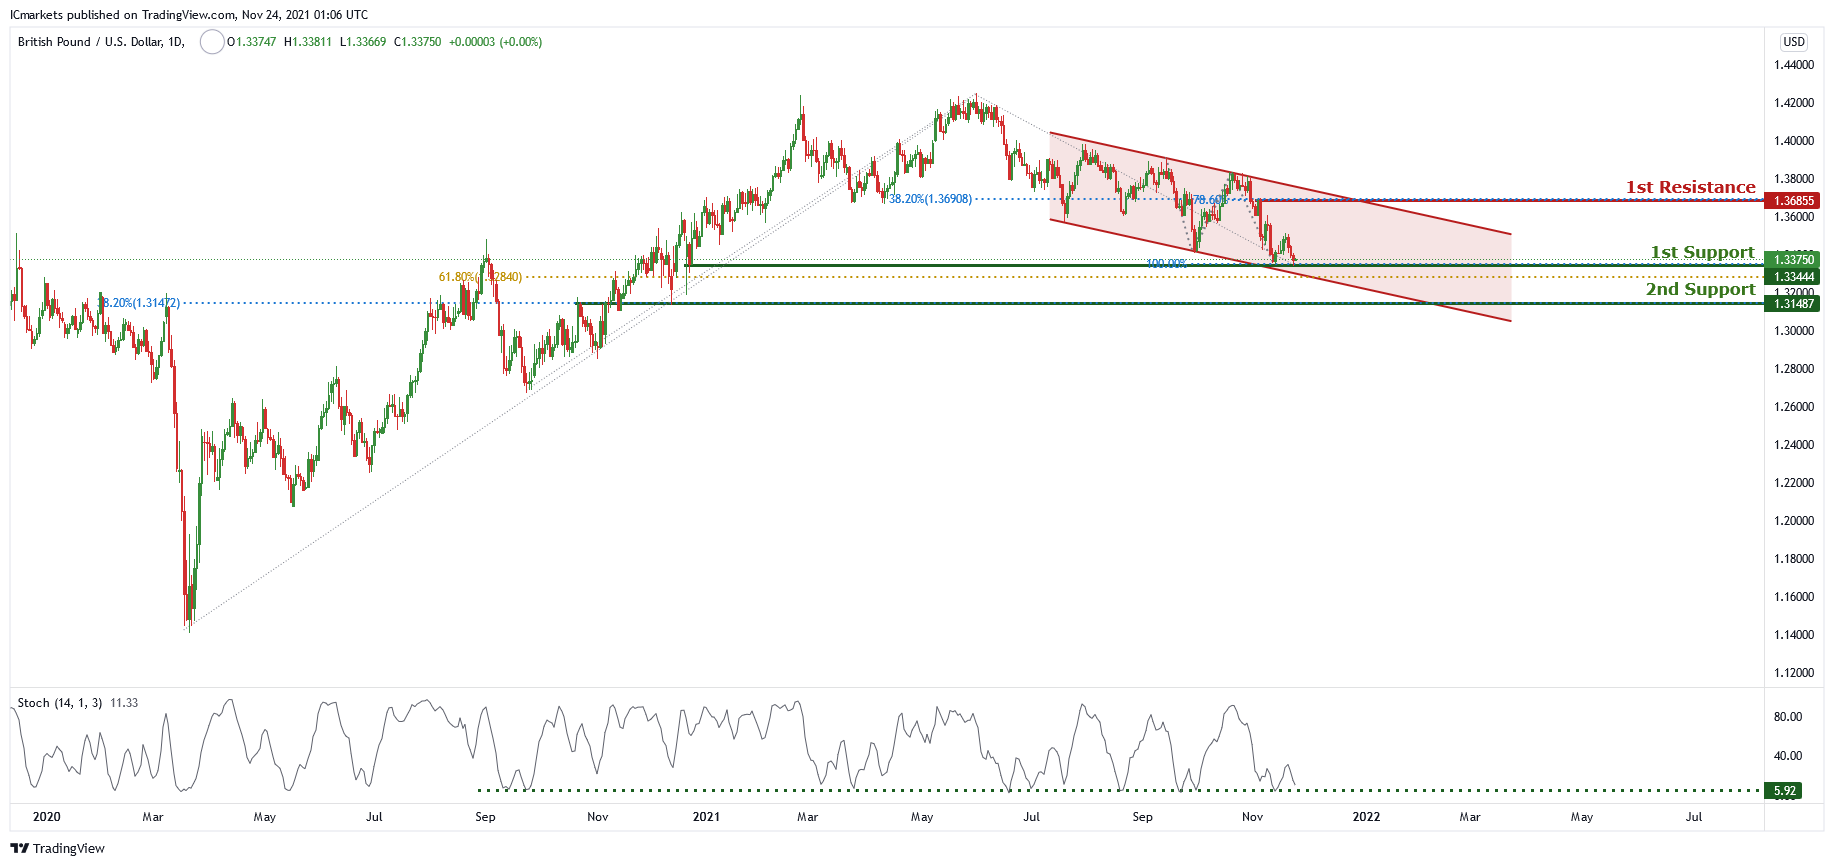
GBP/USD:
Price is trading in a descending channel and near the first support level of 1.33444 which is also 100% Fibonacci projection and 61.8% Fibonacci retracement. Price can potentially go to the first resistance level of 1.36885 which is also 38.2% Fibonacci retracement and 78.6% Fibonacci projection. Our bearish bias is supported by the stochastic indicator as it is at support level.
Areas of consideration:
1st resistance – 1.36855
1st support – 1.33444
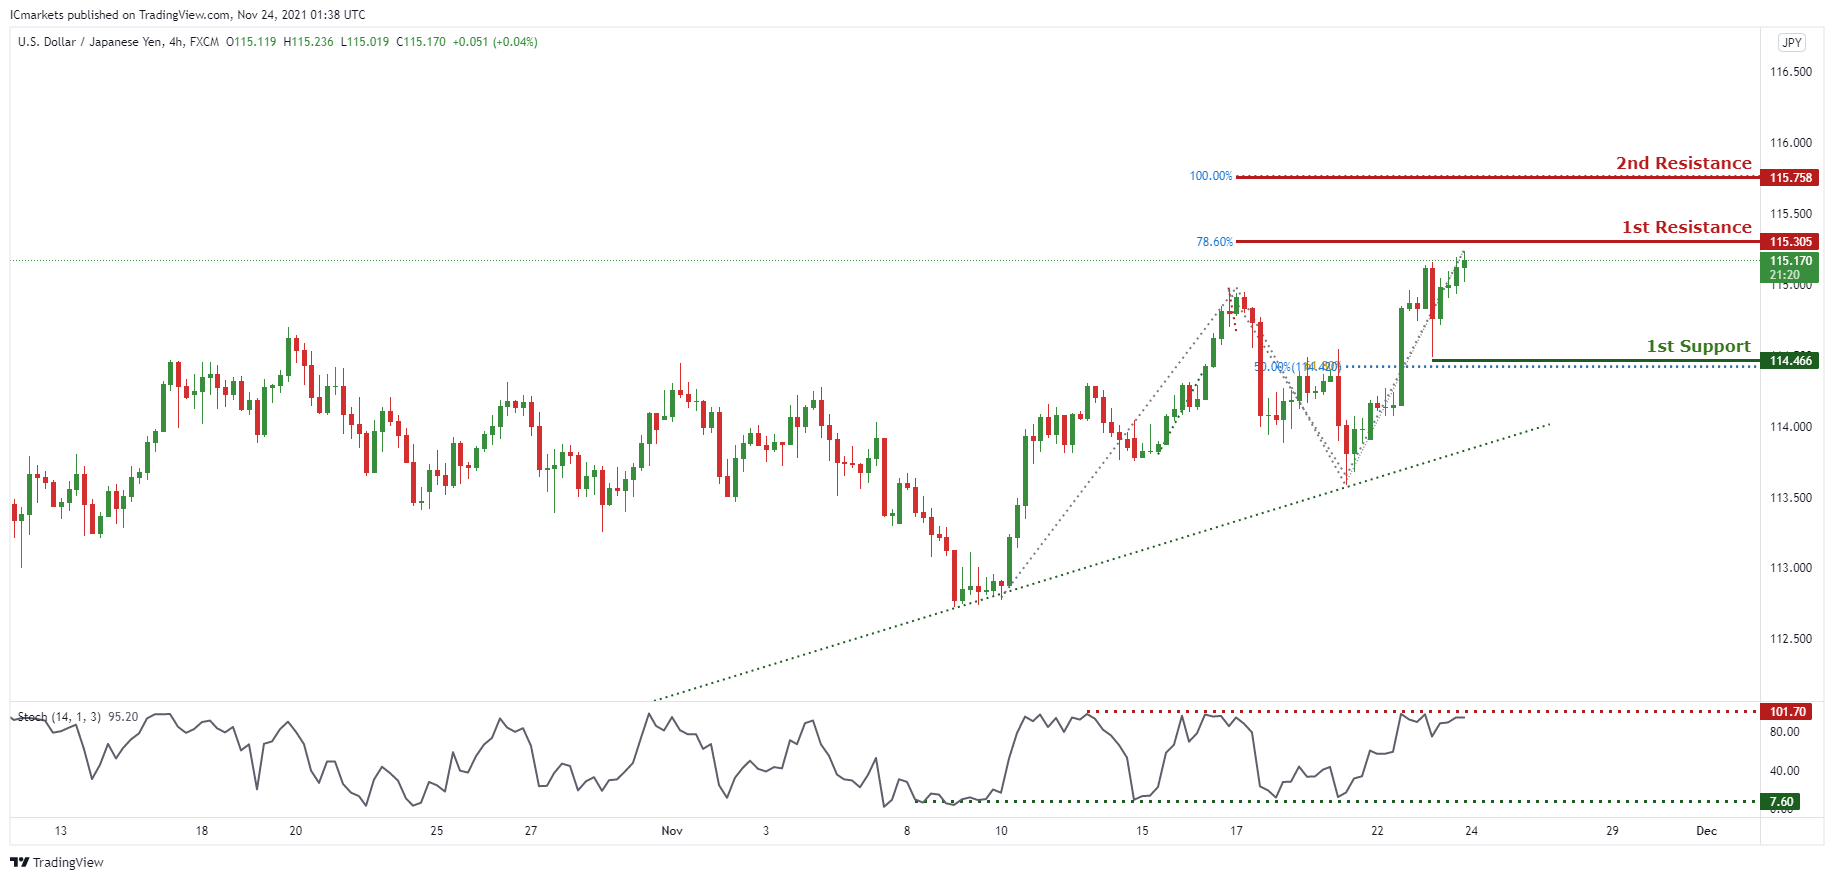
USD/JPY
On the H4 timeframe, we can now expect price to drop from 1st Resistance in line with 78.6% Fibonacci projection and horizontal swing high towards 1st Support in line with 61.8% Fibonacci projection and 50% Fibonacci retracement. Our short-term bearish bias is further supported by stochastic where %K line is at the resistance level.
Areas of consideration:
- H4 1st resistance level 115.305
- H4 1st support level 114.466
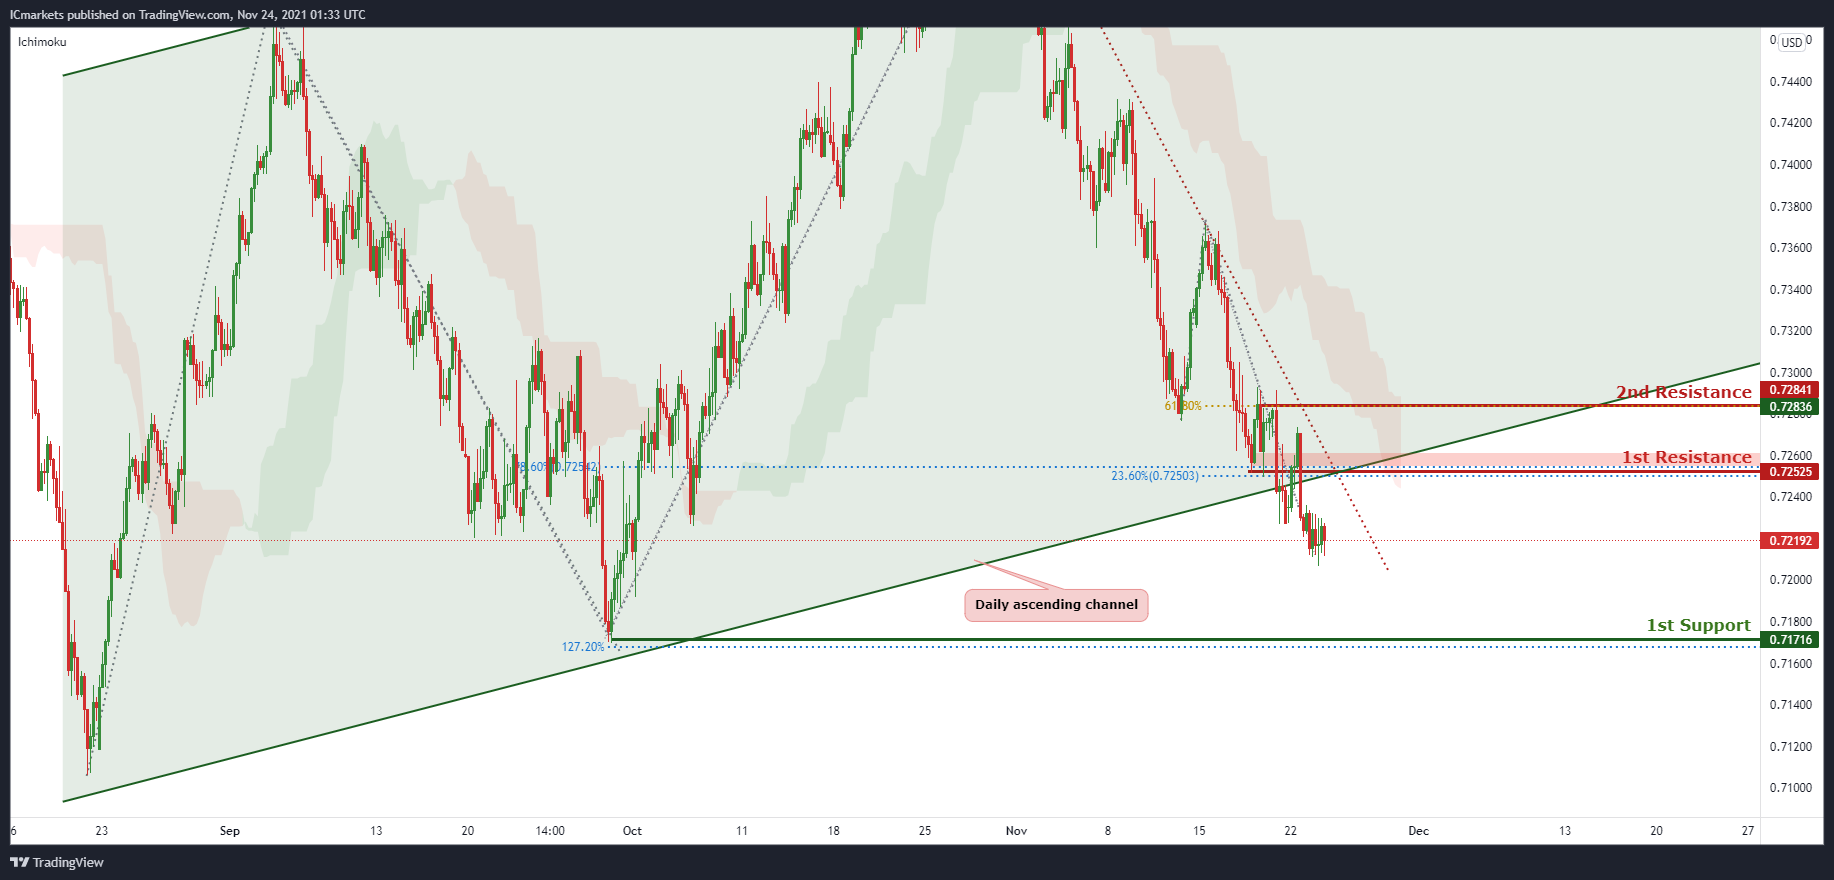
AUD/USD:
On the H4, we can see that price broke out of the ascending channel on the daily and abiding to the descending trendline on the H4. We can expect the price to drop from 1st Resistance in line with 78.6% Fibonacci Retracement and 23.6% Fibonacci retracement towards the 1st Support in line with 127.2% Fibonacci projection. Our bearish bias is further supported by the Ichimoku cloud indicator where price is holding below it and it is forming a strong resistance level.
Areas of consideration:
- H4 1st resistance level 0.72525
- H4 1st support level 0.71716
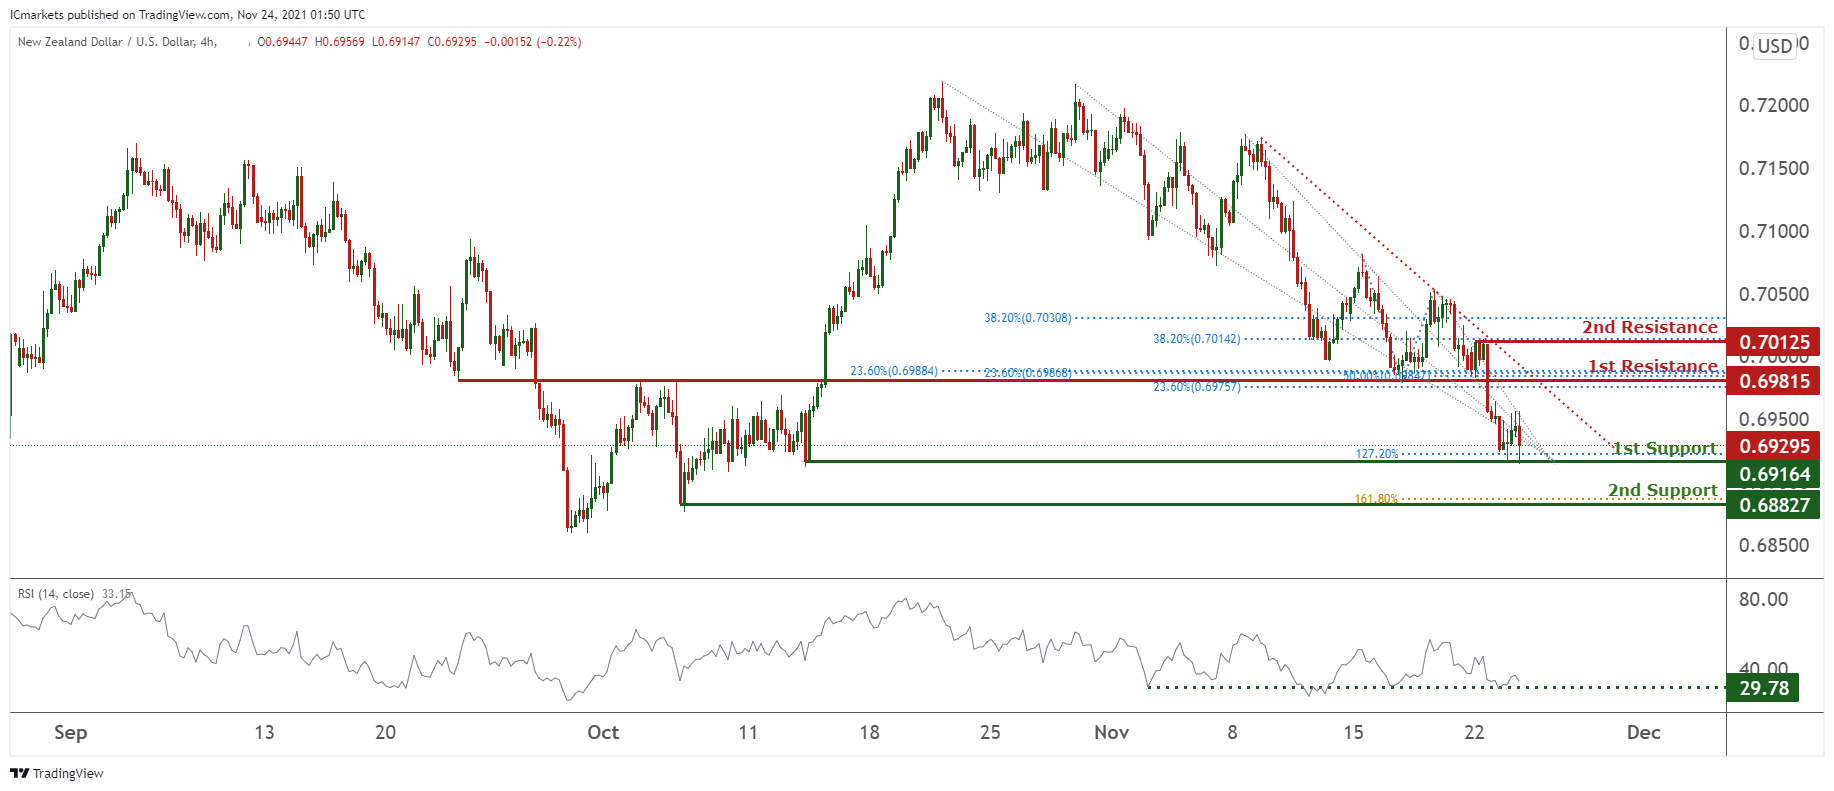
NZD/USD:
On the H4 timeframe, prices are on a bearish momentum and abiding to our descending trendline. We see potential for a bounce at 0.69164 in line with 127.2% Fibonacci extension to retest 1st resistance at 0.69815 which is an area of Fibonacci confluences. Technical indicators are showing bearish momentum. Alternatively, breaking 1st support at 0.69164 will find prices dipping towards our 2nd support at 0.68827 in line with Fibonacci projection.
Areas of consideration:
- H4 time frame, 1st resistance at 0.69815
- H4 time frame, 1st support at 0.69164
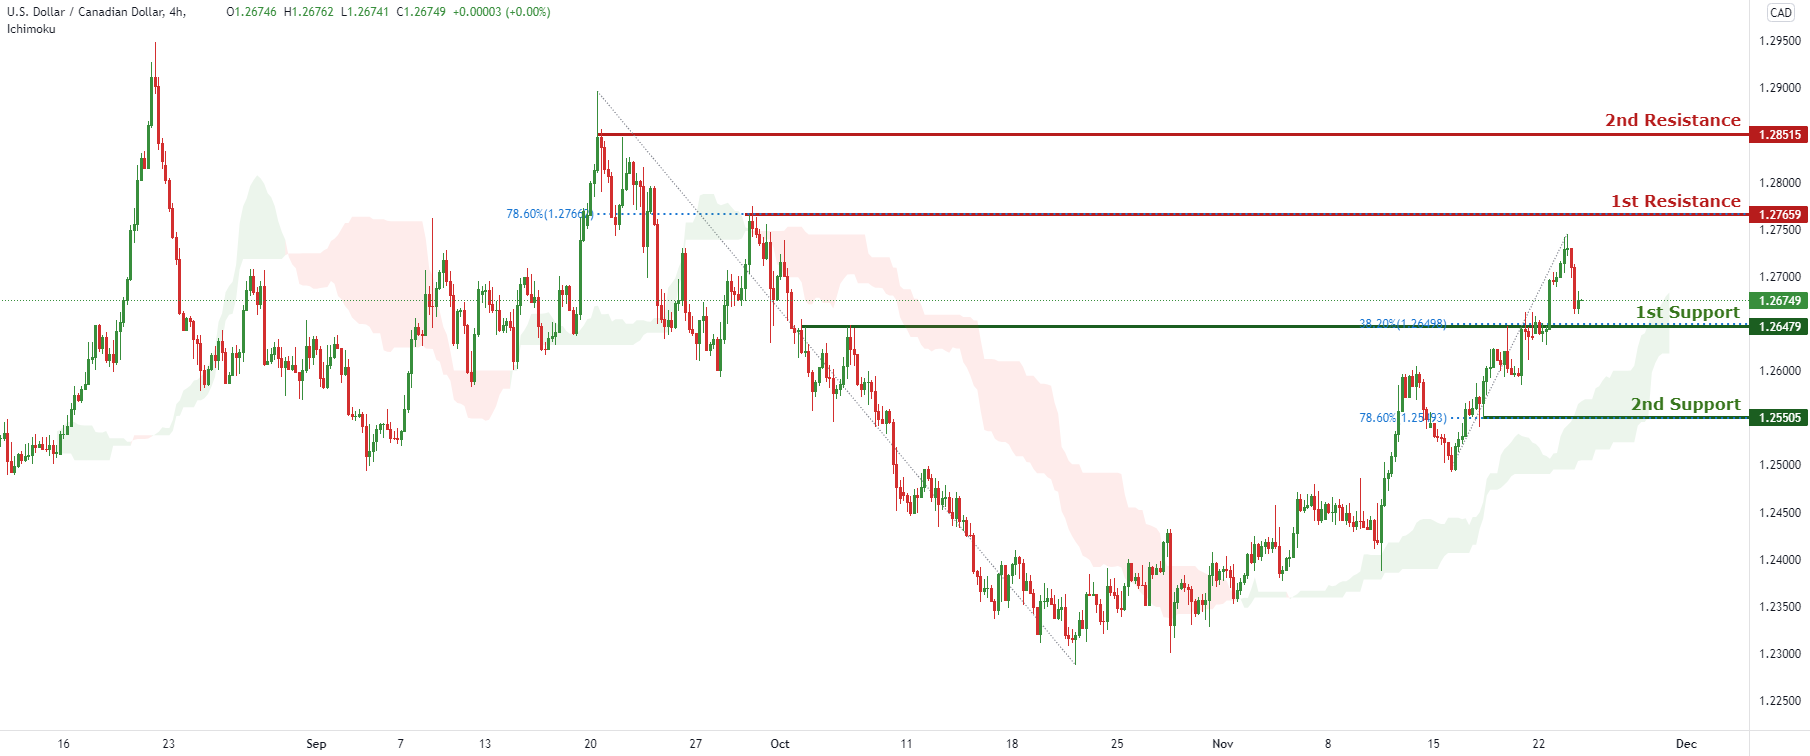
USD/CAD:
On the H4, with price expected to reverse off the support on the stochastics indicator and the a graphical horizontal level, we have a bullish bias that price will rise from 1st support at 1.26744 in line with the graphical overlap support and 38.2% Fibonacci retracement and possibly to 2nd support at 1.25505 in line with the graphical swing low support and 78.6% Fibonacci retracement to 1st resistance at 1.27659 in line with the horizontal swing high resistance and 78.6% Fibonacci retracement level. Alternatively, we may see price break 1st resistance structure and head for 2nd resistance at 1.28515 in line with the horizontal swing high resistance.
Areas of consideration:
- H4 time frame, support at 26744
- H4 time frame, resistance at 27659
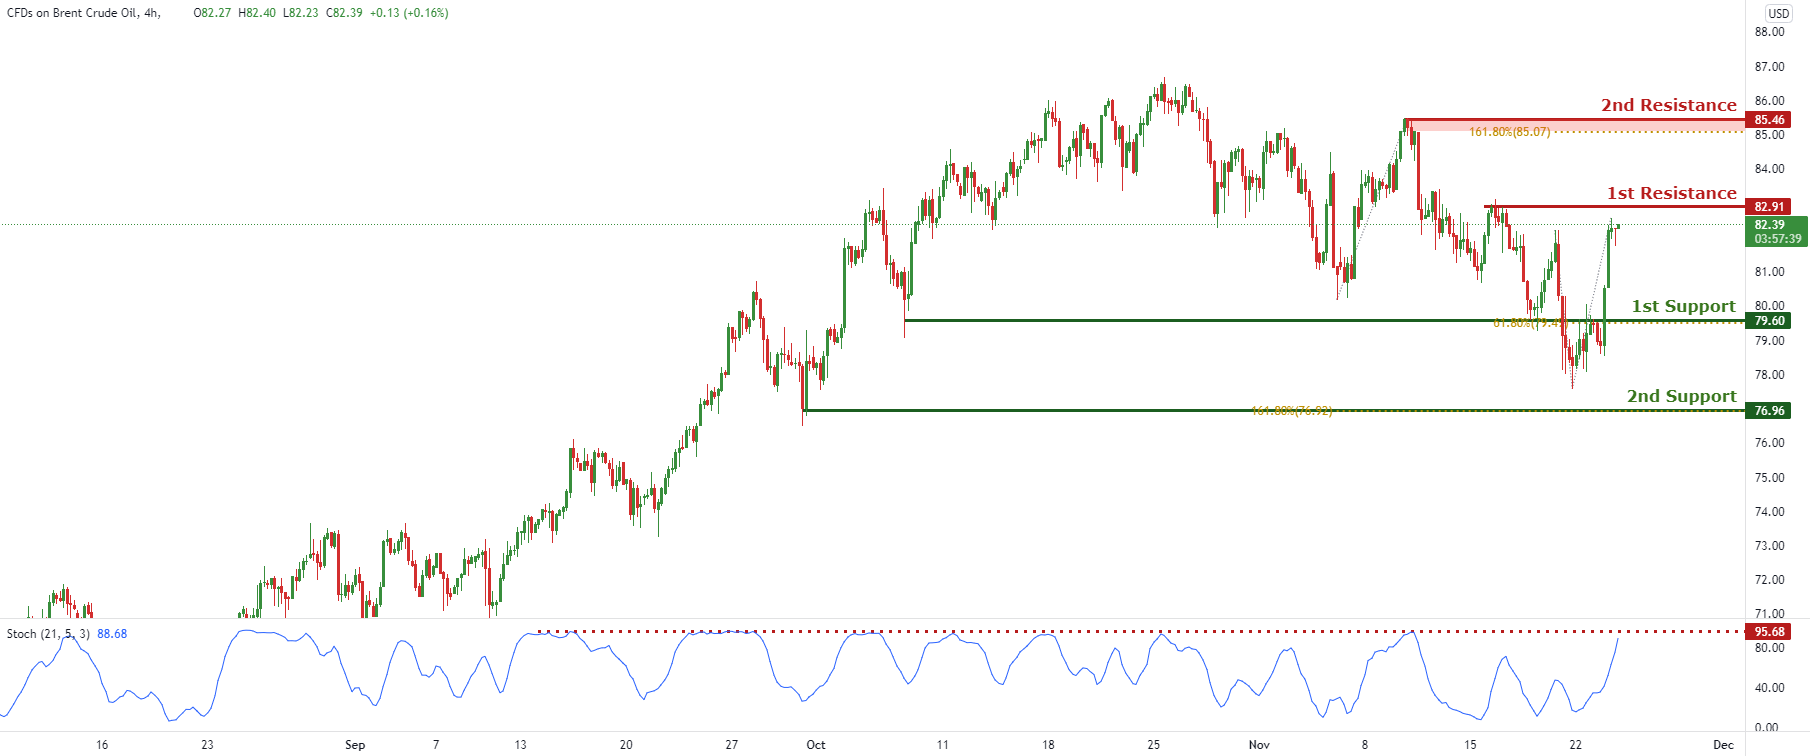
OIL:
On the H4 timeframe, with price approaching the resistance on the stochastics indicator and the horizontal graphical level, we have a bias that price will drop to 1st support at 79.6 in line with the 61.8% Fibonacci retracement and horizontal overlap support and possible to 2nd support at 76.96 in line with the 161.8% Fibonacci extension and horizontal swing low support from 1st resistance at 82.91 in line with the horizontal swing high resistance. Alternatively, price may break 1st resistance structure and head for 2nd resistance at 85.46 in line with the 161.8% Fibonacci extension and horizontal swing high resistance.
Areas of consideration:
- H4 time frame, 1st resistance of 91
- H4 time frame, 1st support of 6
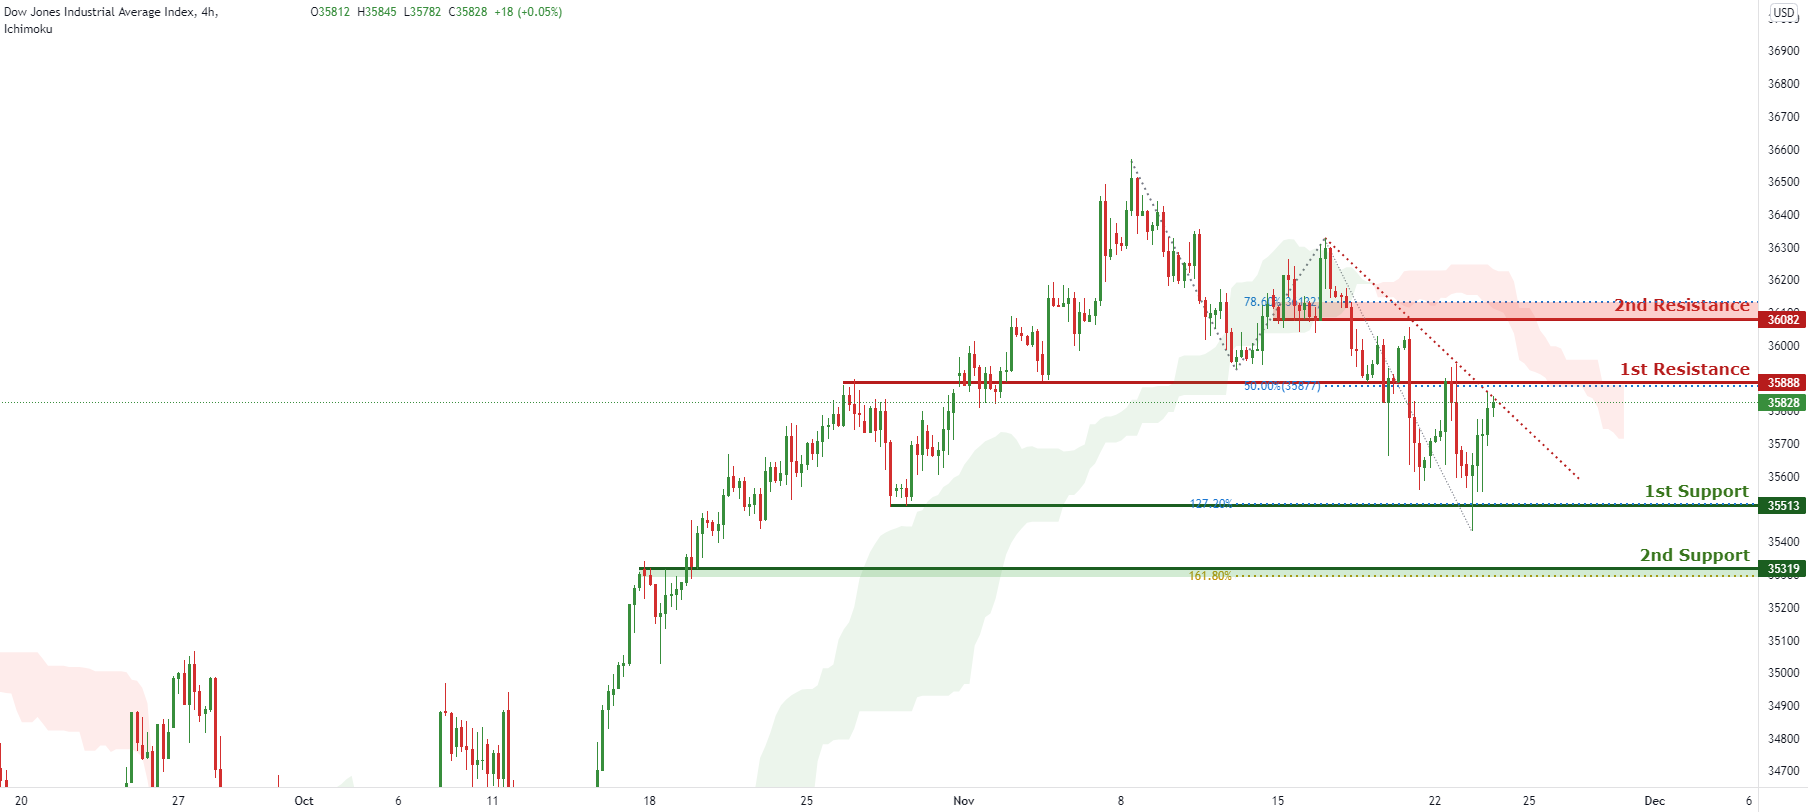
Dow Jones Industrial Average:
On the H4, with price moving below the ichimoku cloud, w are bias that price will drop from 1st resistance at 35888 in line with the 50% Fibonacci retracement and horizontal overlap resistance to 1st support at 35513 in line with the horizontal swing low support and 127.2% Fibonacci projection and possibly to 2nd support at 35319 in line with the 161.8% Fibonacci projection and horizontal overlap support. Alternatively, price may break 1st resistance structure and head for 2nd resistance at 36082 in line with the 78.6% Fibonacci retracement.
- 4H resistance at 35888
- 4H support at 35513
The accuracy, completeness and timeliness of the information contained on this site cannot be guaranteed. IC Markets does not warranty, guarantee or make any representations, or assume any liability regarding financial results based on the use of the information in the site.
News, views, opinions, recommendations and other information obtained from sources outside of www.icmarkets.com.au, used in this site are believed to be reliable, but we cannot guarantee their accuracy or completeness. All such information is subject to change at any time without notice. IC Markets assumes no responsibility for the content of any linked site.
The fact that such links may exist does not indicate approval or endorsement of any material contained on any linked site. IC Markets is not liable for any harm caused by the transmission, through accessing the services or information on this site, of a computer virus, or other computer code or programming device that might be used to access, delete, damage, disable, disrupt or otherwise impede in any manner, the operation of the site or of any user’s software, hardware, data or property.


