
Key risk events today:
Australia Retail Sales m/m; Canada Inflation; Crude Oil Inventories.
(Previous analysis as well as outside sources – italics).
EUR/USD:
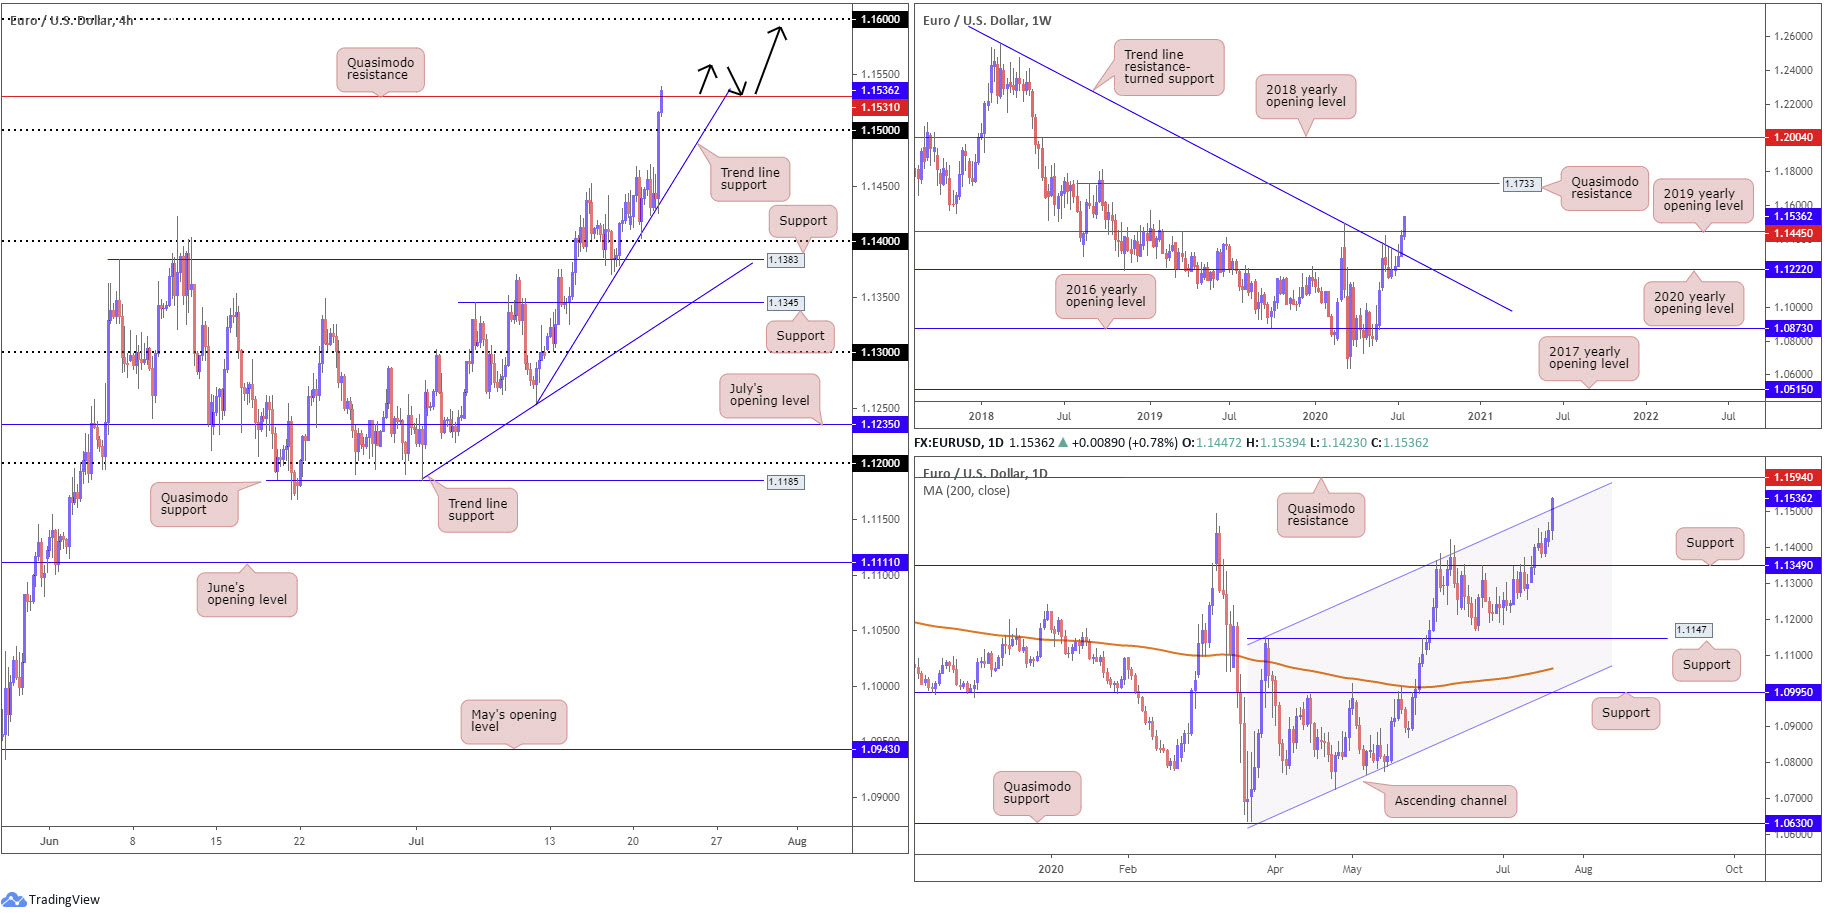
Europe’s single currency, as you can see, strongly rose against a sinking dollar Tuesday. The EU striking a deal for a huge stimulus plan and upbeat risk sentiment led EUR/USD to highs above 1.15.
From a technical perspective, we are clearing weekly resistance at 1.1445, the 2019 yearly opening level. In the event price remains northbound, weekly Quasimodo resistance at 1.1733 lines up as the next potential upside target.
A closer examination of price movement on the daily timeframe reveals recent upside had the unit travel through channel resistance, taken from the high 1.1147. This has possibly set the stage for a continuation move towards Quasimodo resistance at 1.1594.
Across the page on the H4 timeframe, technical action reacted from local trend line support, extended from the low 1.1254, and rushed orders at 1.15 to reach Quasimodo resistance at 1.1531. Any sustained move north of here places 1.16 in the firing range.
Areas of consideration:
Ultimately, clearance of 1.1531 on the H4 could lead to buyers making an appearance today. Although conservative buyers may opt to wait and see if a retest at 1.1531 (as support) occurs before pulling the trigger, upside targets remain at 1.1594, the daily Quasimodo resistance, followed by 1.16 based on the H4.
GBP/USD:
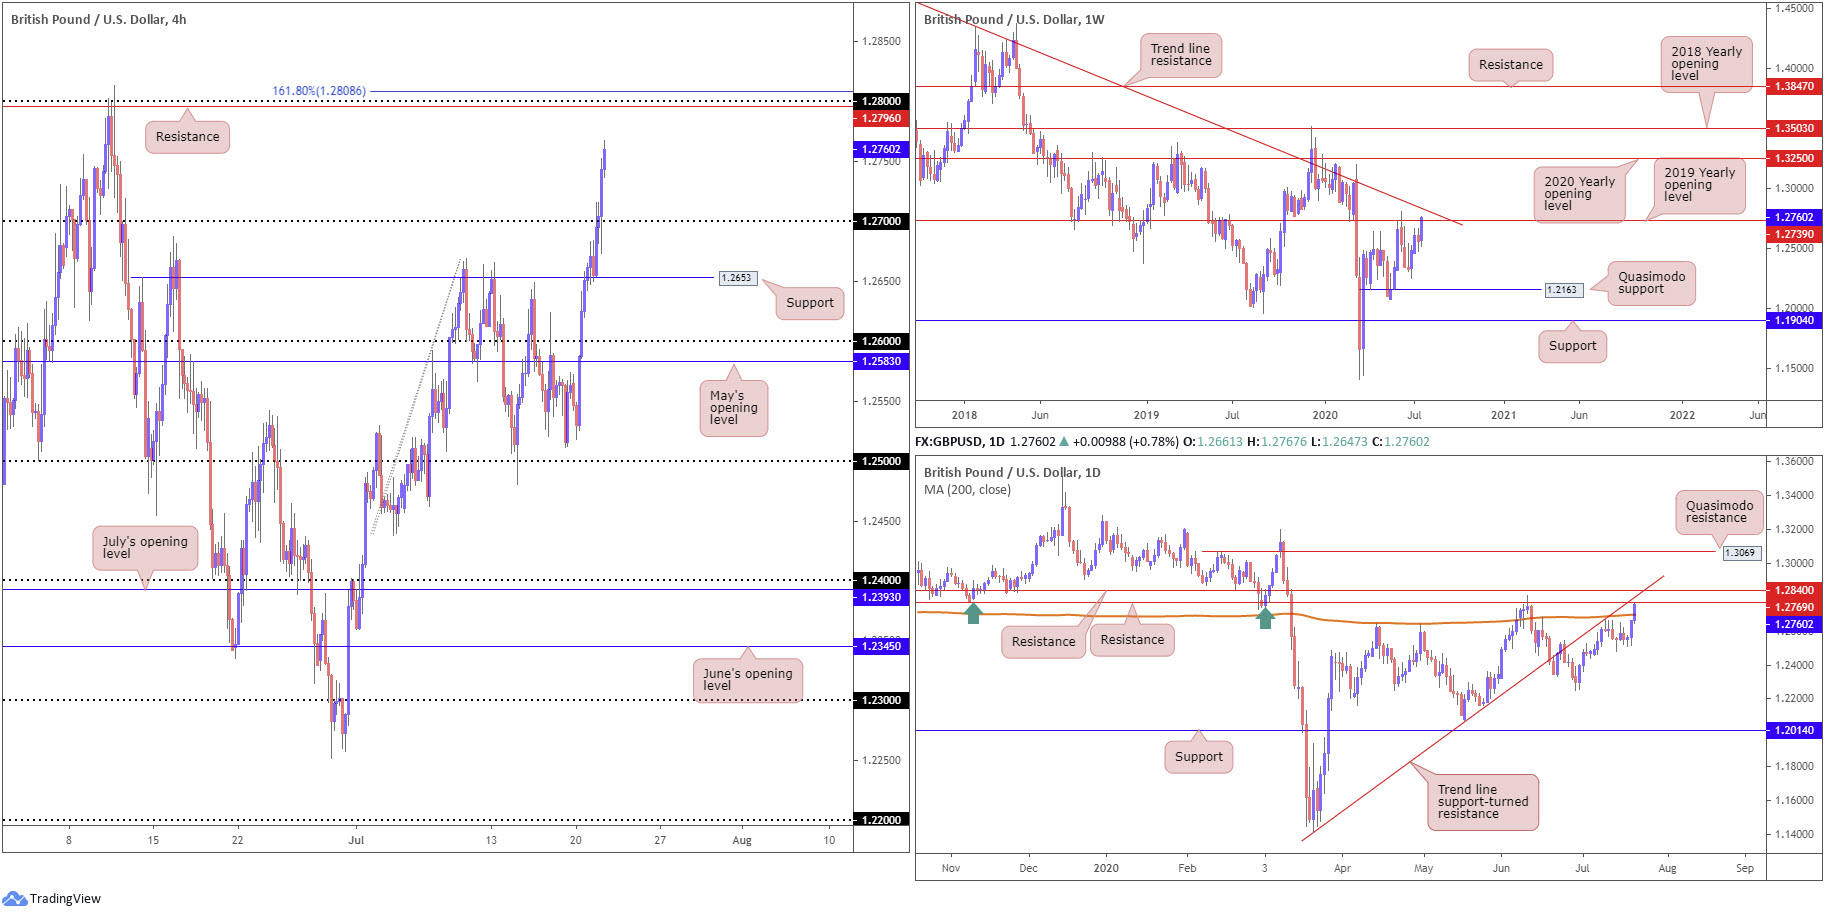
The British pound retained a strong underlying bid vs. the US dollar Tuesday, as the latter convincingly approaches the 95.00 handle. Following a notable retest at 1.2653 support on the H4 timeframe, price movement penetrated 1.27 to the upside. Despite a brief flicker of bearish activity, GBP/USD marched higher into US hours and is, at the time of writing, on course to shake hands with resistance at 1.2796, closely shadowed by the 1.28 handle and 161.8% Fibonacci extension point at 1.2808.
Meanwhile, the story on the weekly timeframe has price action attempting to regain a foothold above the 2019 yearly opening level at 1.2739, consequently shining the spotlight on long-term trend line resistance, taken from the high 1.5930.
Lower on the curve, technical direction shows yesterday’s daily candle made quick work of the 200-day SMA (orange – 1.2697) and is now within touching distance of resistance coming in at 1.2769. Readers may also want to acknowledge additional resistance resides at 1.2840, coupled with trend line support-turned resistance, taken from the low 1.1409.
Areas of consideration:
Upside momentum may calm should we touch gloves with daily resistance at 1.2769, as some traders will likely look to square off daily gains here. Whether this will be enough to draw a retracement back to 1.27 as support on the H4, though, a level cushioned by the 200-day SMA, is questionable. Though if 1.27 does make an appearance, this could be a location we see dip-buying enter the fold.
H4 traders will also likely pencil in the 1.28 handle as potential resistance. However, there is a possibility, despite local confluence, we could move through this area to pursue daily resistance at 1.2840, which aligns with current daily trend line resistance, as well as weekly trend line resistance.
AUD/USD:
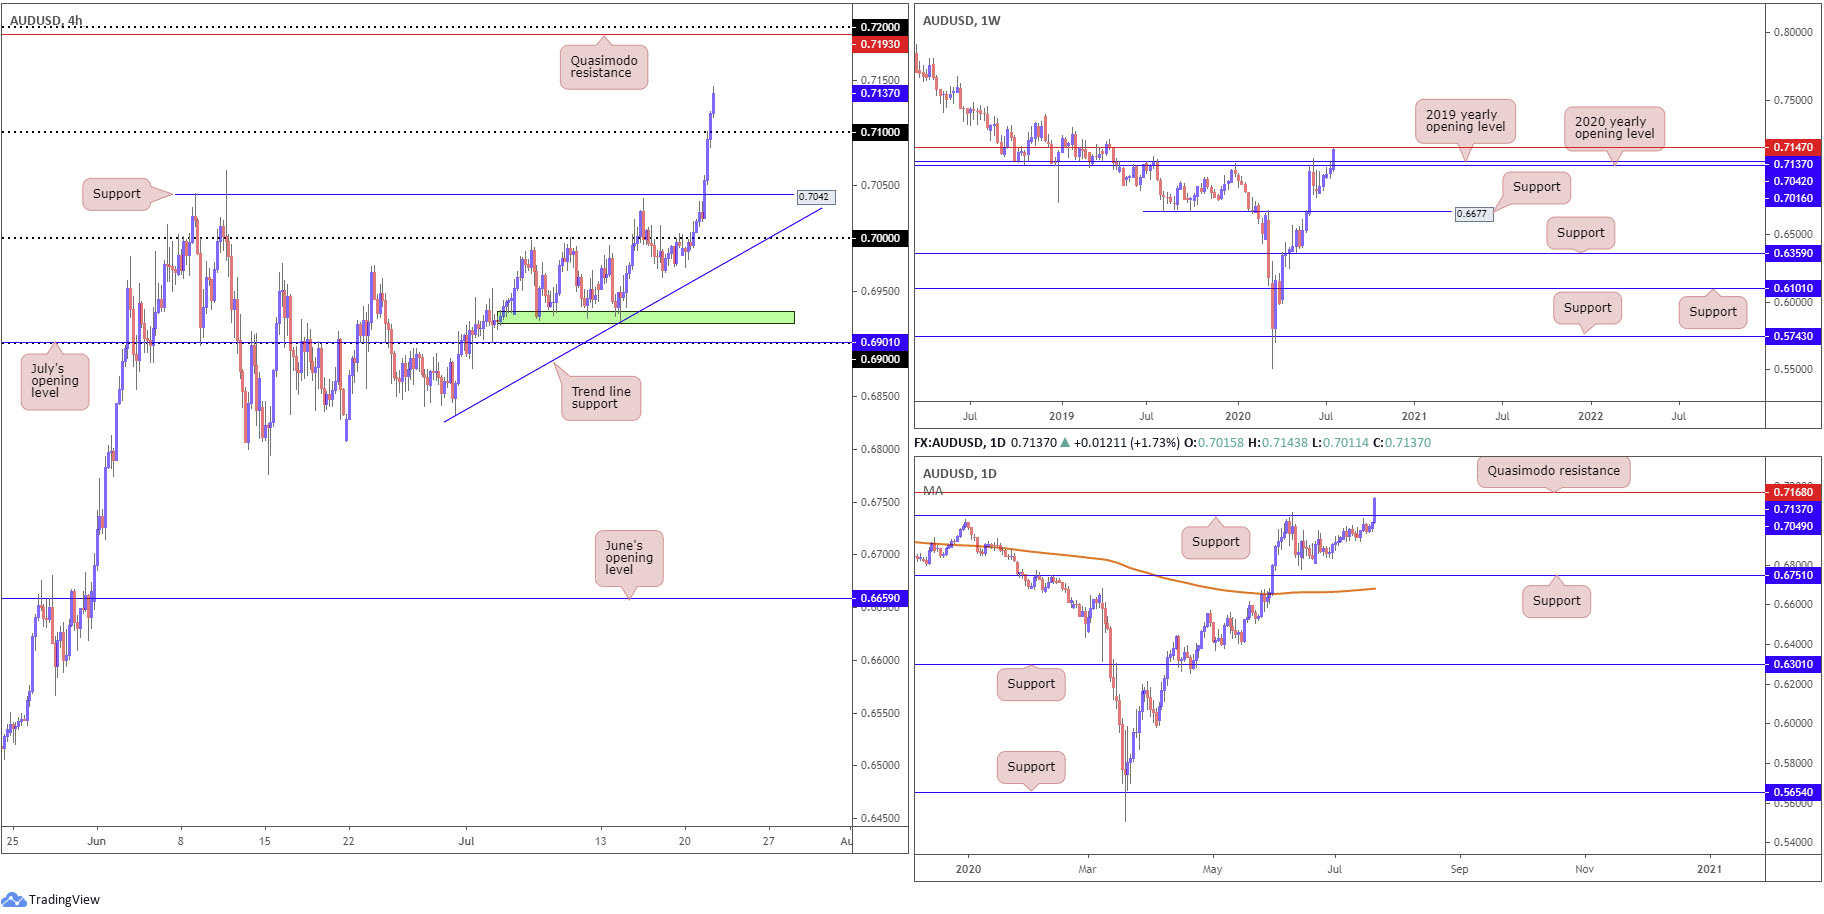
AUD/USD bulls entered a strong offensive phase Tuesday, amidst broad USD weakness and supportive RBA vibes via the minutes and Governor Lowe. Recent trading, as you can see, also extended to fresh yearly peaks.
After clearing 0.71 to the upside on the H4 timeframe, traders will be watching Quasimodo resistance at 0.7193, closely positioned nearby the 0.72 handle. Before reaching 0.72, however, daily Quasimodo resistance at 0.7168 may make an entrance. Interestingly, we also see weekly resistance plotted at 0.7147.
Areas of consideration:
While H4 traders are potentially long the break of 0.71, resistance on the weekly and daily timeframes at 0.7147 and 0.7168, respectively, could hamper further buying today. This may generate a pullback to 0.71, which is likely to draw dip-buying into the fight.
A close back under 0.71, nonetheless, would possibly have sellers target daily support at 0.7049, followed by H4 support coming in at 0.7042.
USD/JPY:
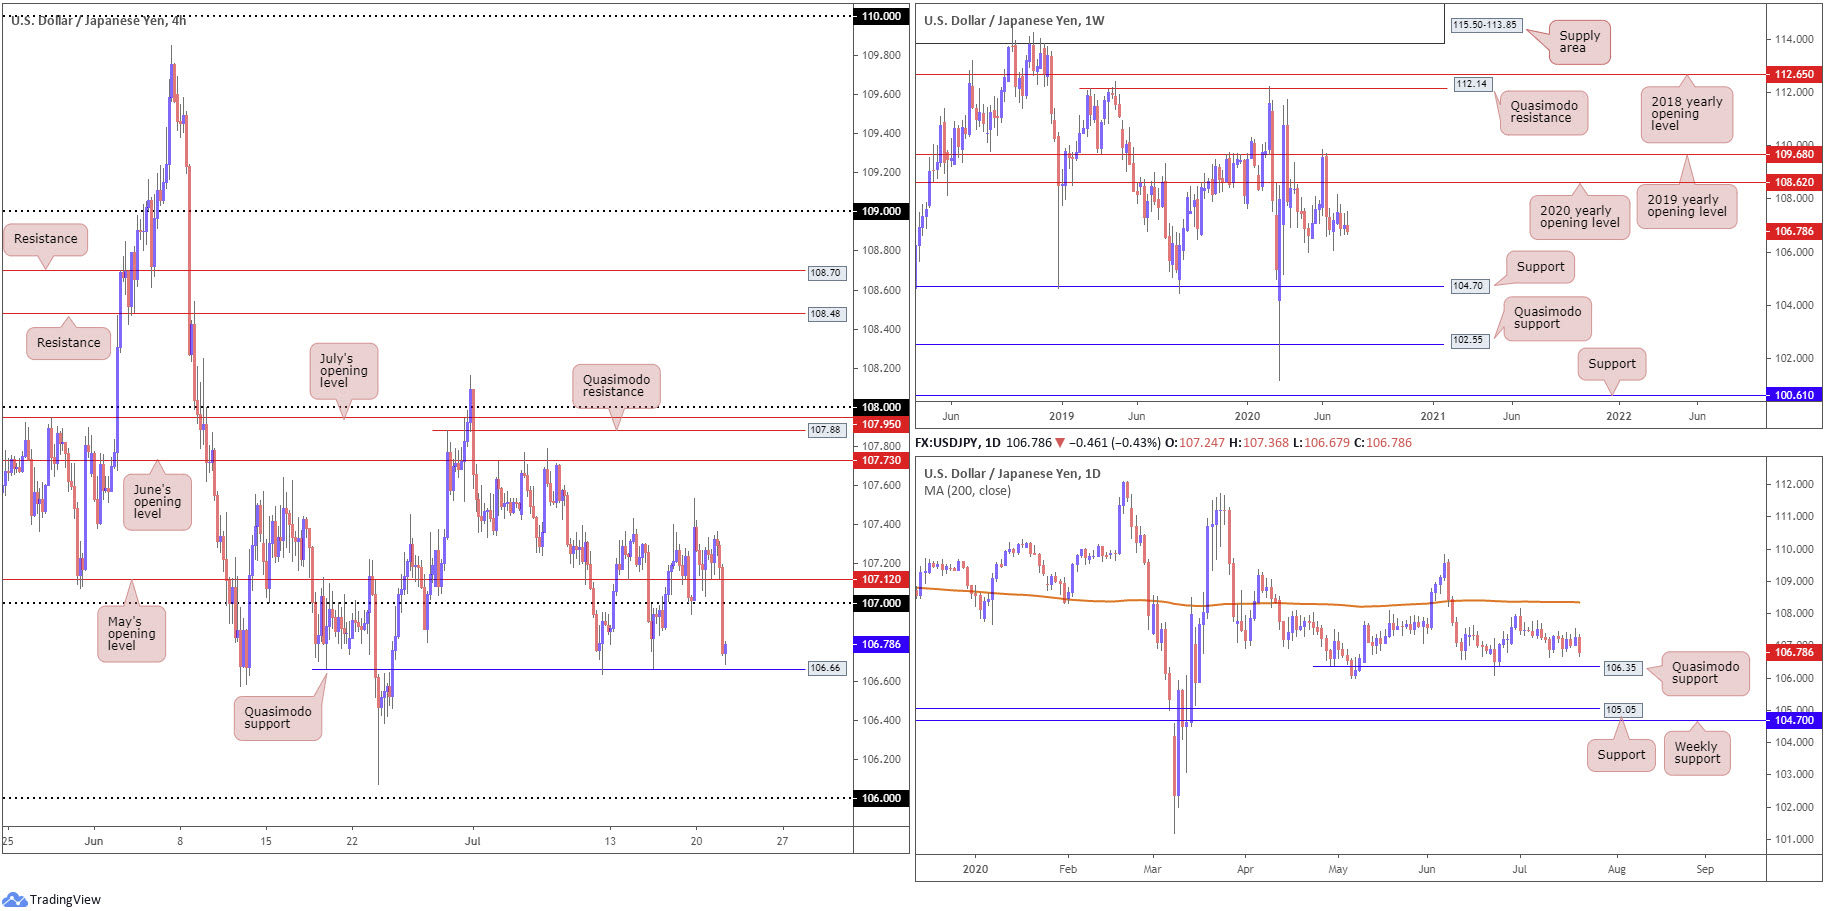
USD/JPY buying slackened above 107 as the US dollar index extended it slide towards 95.00 on Tuesday. Also leaving behind May’s opening level at 107.12, we can now see H4 action modestly bottoming ahead of familiar Quasimodo support from 106.66, with a break of this level exposing the 106 handle.
Further out on the weekly timeframe, price is seen consolidating beneath the 2020 yearly opening level at 108.62. Support, on the other hand, can be derived from the 105.98 6th May low, with a breach uncovering long-term support plotted at 104.70.
Technical structure on the daily timeframe remains focused on Quasimodo support from 106.35 and the 200-day SMA (orange – 108.35) as resistance, assuming we get past the 108.16 July 1st high.
Areas of consideration:
Rebounding from H4 Quasimodo support at 106.66, given its history as a floor, might come into view. A violation of the level, on the other hand, could sweep sellers into the market, though potential opposition resides close by in the shape of daily Quasimodo support at 106.35.
A retest at 107, albeit coming with the possibility of a fakeout to May’s opening level from 107.12, is another potential scenario that may come to pass today. Conservative traders will likely welcome additional H4 bearish candlestick confirmation before engaging and targeting 106.66.
USD/CAD:
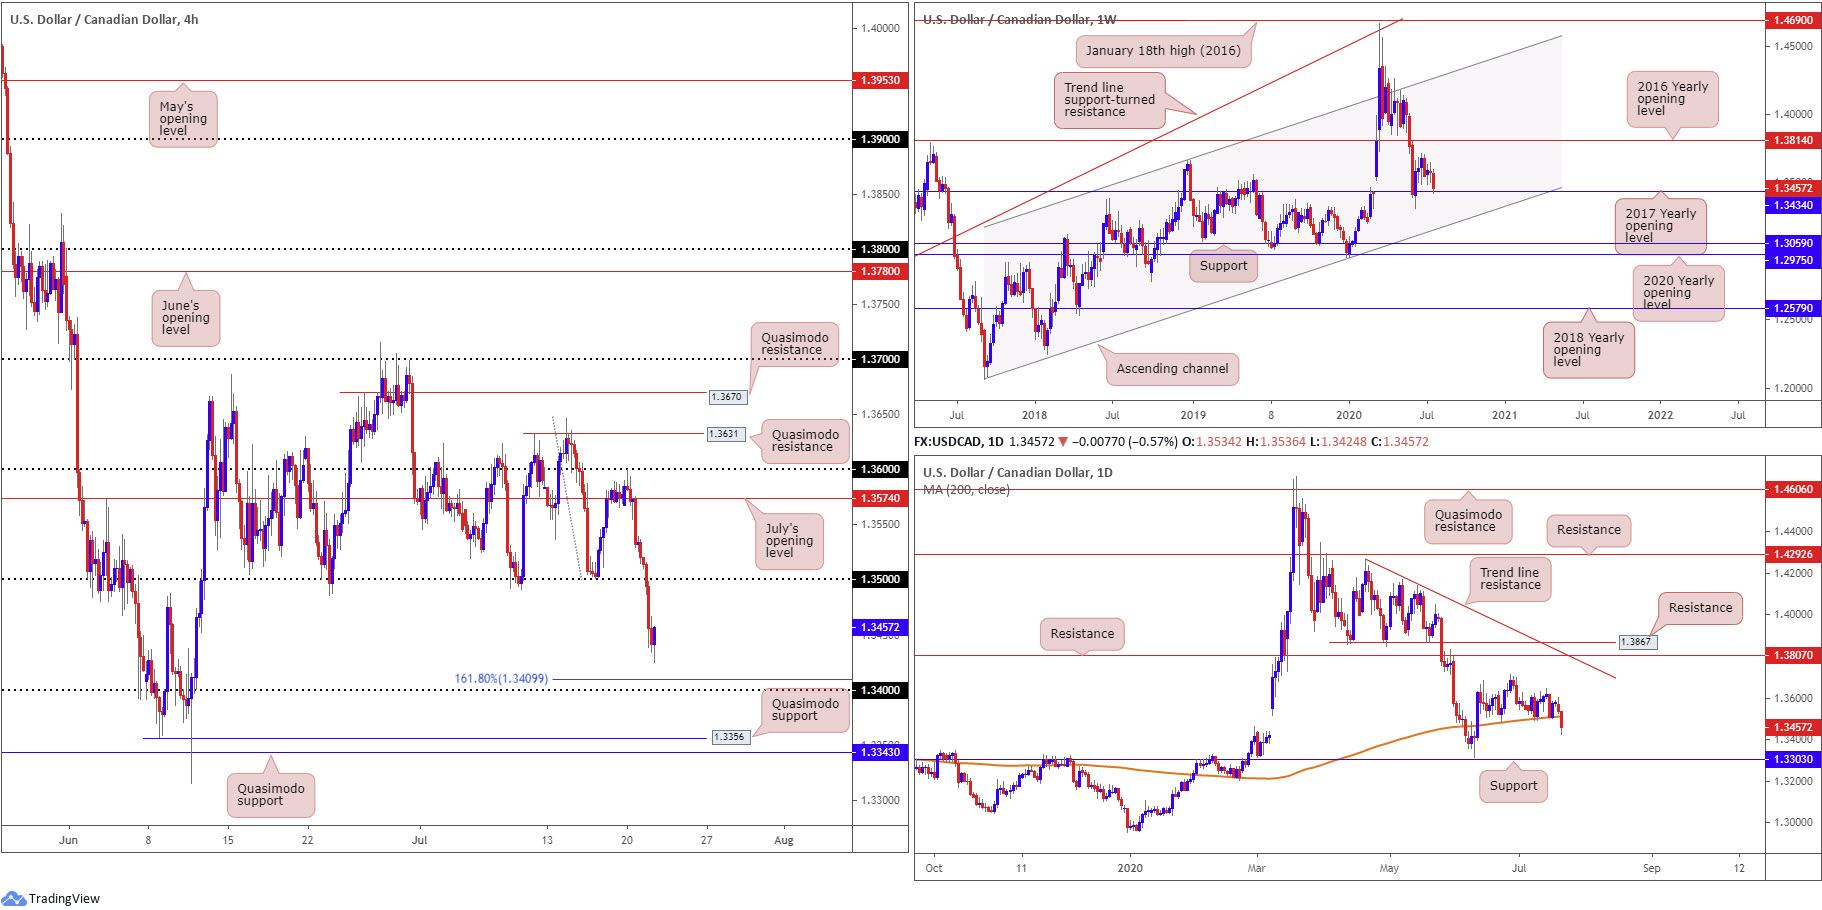
WTI put forward a day of positive gains, alongside the US dollar index tumbling towards 95.00, consequently resulting in USD/CAD throwing itself under the 1.35 handle in dominant fashion. This landed H4 candles within touching distance of 1.34 and a 161.8% Fibonacci extension point at 1.3409. Beyond here, traders’ crosshairs will likely be fixed on Quasimodo support at 1.3356.
Technically, the weekly timeframe recently softened into support, by way of the 2017 yearly opening level from 1.3434. Below 1.3434, channel support, taken from the low 1.2061, can be viewed as the next potential floor. A USD/CAD bid, nevertheless, throws the 2016 yearly opening level at 1.3814 in the pot as feasible resistance, with follow-through buying to try and tackle a dense block of supply between 1.4190/1.3912.
Movement on the daily timeframe reveals Tuesday ruptured the 200-day SMA (orange – 1.3512), exposing a possible run to support priced in at 1.3303. Closing below the 200-day SMA is generally interpreted as a bearish signal among technicians.
Areas of consideration:
Although USD/CAD tunnelled through the 200-day SMA (1.3512), suggesting a continuation to the downside, weekly price trades at support from 1.3434. This may lead to buyers making a show and attempting to retest at the aforementioned SMA and 1.35 handle today.
As a result, we could witness buyers make an entrance, leaving 1.34 behind. In addition, should an advance come to fruition, sellers will likely show some interest off 1.35, having noted SMA confluence.
USD/CHF:
For traders who read Tuesday’s technical briefing you may recall the following (italics):
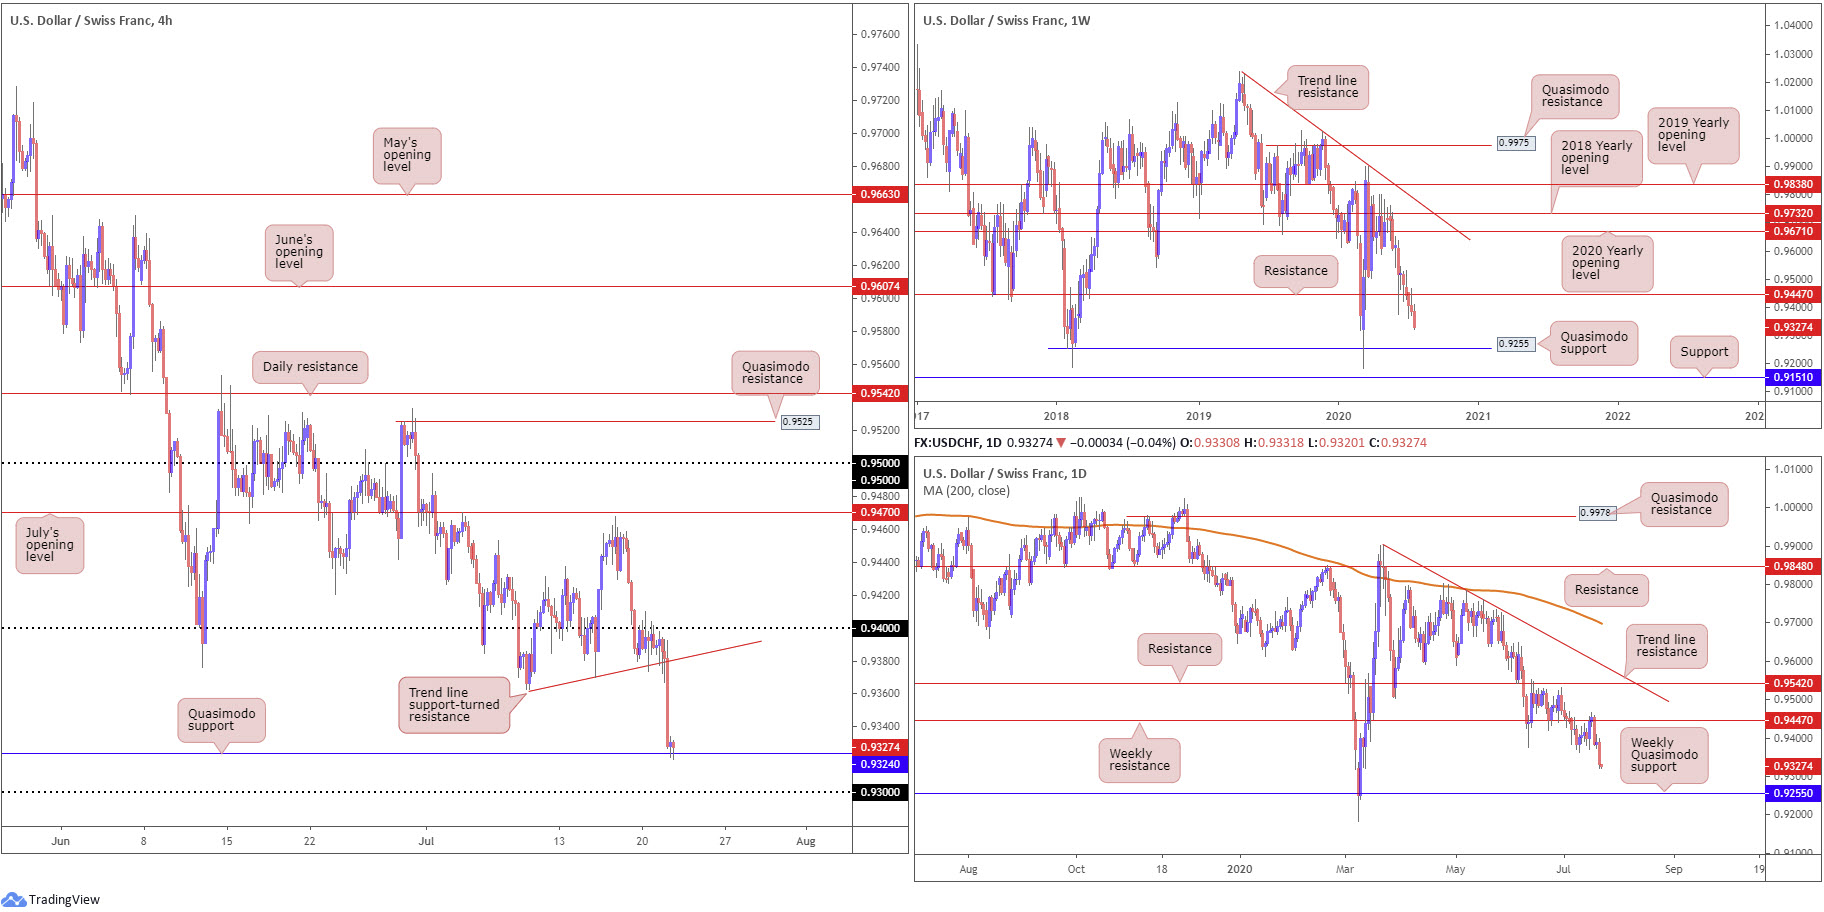
With weekly price sheltering under resistance at 0.9447, the odds of H4 price holding under 0.94 and pushing through local trend line support today is high. A H4 close under the aforementioned trend line support is also likely to be interpreted as a sell signal, targeting H4 Quasimodo support at 0.9324, followed by the 0.93 handle and then weekly Quasimodo support mentioned above at 0.9255.
As evident from the H4 chart this morning, price did indeed take out the aforementioned trend line support and cross swords with Quasimodo support at 0.9342. While a recovery attempt may come to fruition today, it’s unlikely to gather much support. A break to the downside to 0.93, according to the higher timeframes, is the more likely route, while breaking 0.93 could liberate downside to weekly Quasimodo support at 0.9255.
Areas of consideration:
Traders short this market have likely reduced risk to breakeven and banked a portion of profits at H4 Quasimodo support from 0.9324. The next take-profit target rests close by at 0.63, with a break of here clearing the path to 0.9255, the weekly Quasimodo support. A H4 close under 0.93, therefore, provides opportunity to seek additional bearish scenarios.
Dow Jones Industrial Average:
US equities finished mostly higher Tuesday.
The Dow Jones Industrial Average advanced 159.53 points, or 0.60%; the S&P 500 advanced 5.46 points, or 0.17%, while the tech-heavy Nasdaq 100 concluded lower by 119.00 points, or 1.09%.
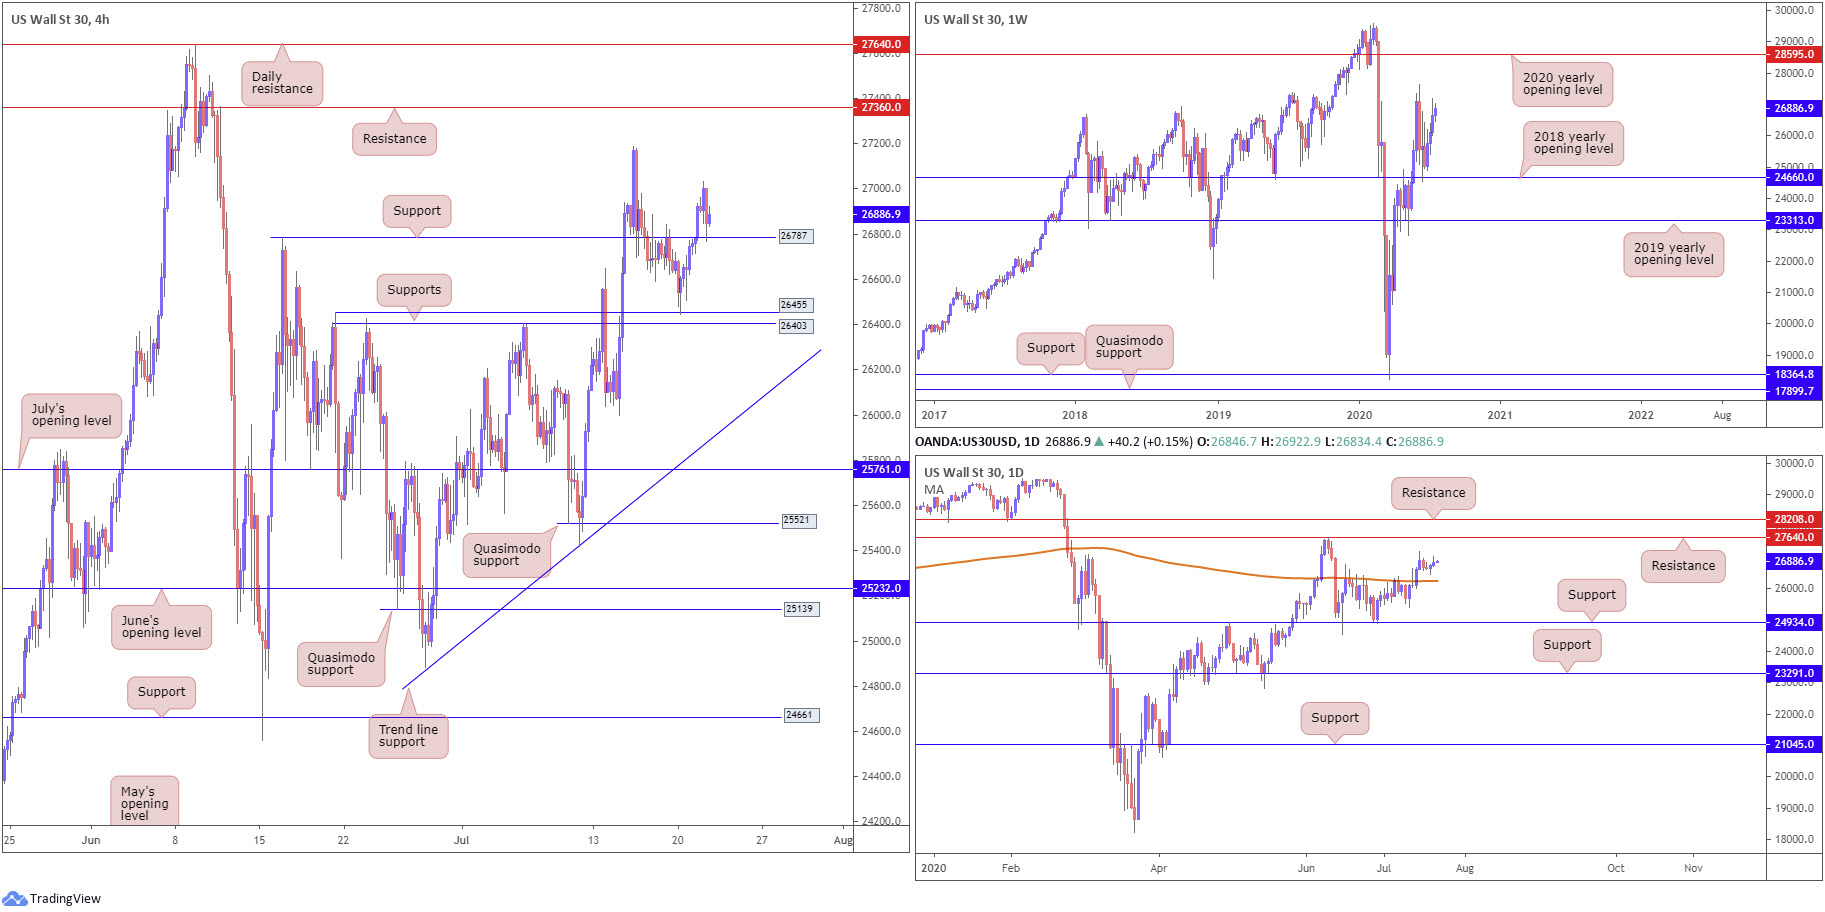
Technically speaking, H4 threw itself above resistance at 26787 on Tuesday and, as you can see, recently welcomed a retest as support. Holding the latter today opens things up to the 27187 July 15 high, closely shadowed by resistance at 27360.
The story on the daily timeframe reveals the 200-day SMA (orange – 26255) recently gave way, a dynamic value capping upside since mid-June. Despite price action since consolidating, the move higher shifts interest towards resistance at 27640. From the weekly timeframe, the 2018 yearly opening level at 24660 remains an important base of support, with traders soon likely to pull in the 27638 high, followed by the 2020 yearly opening level at 28595.
Areas of consideration:
The retest at 26787 H4 support is likely to entice dip-buying, particularly if a H4 bullish candlestick pattern forms off the aforementioned level.
As noted above, the 27187 July 15 high is in position as the first take-profit target.
XAU/USD (GOLD):
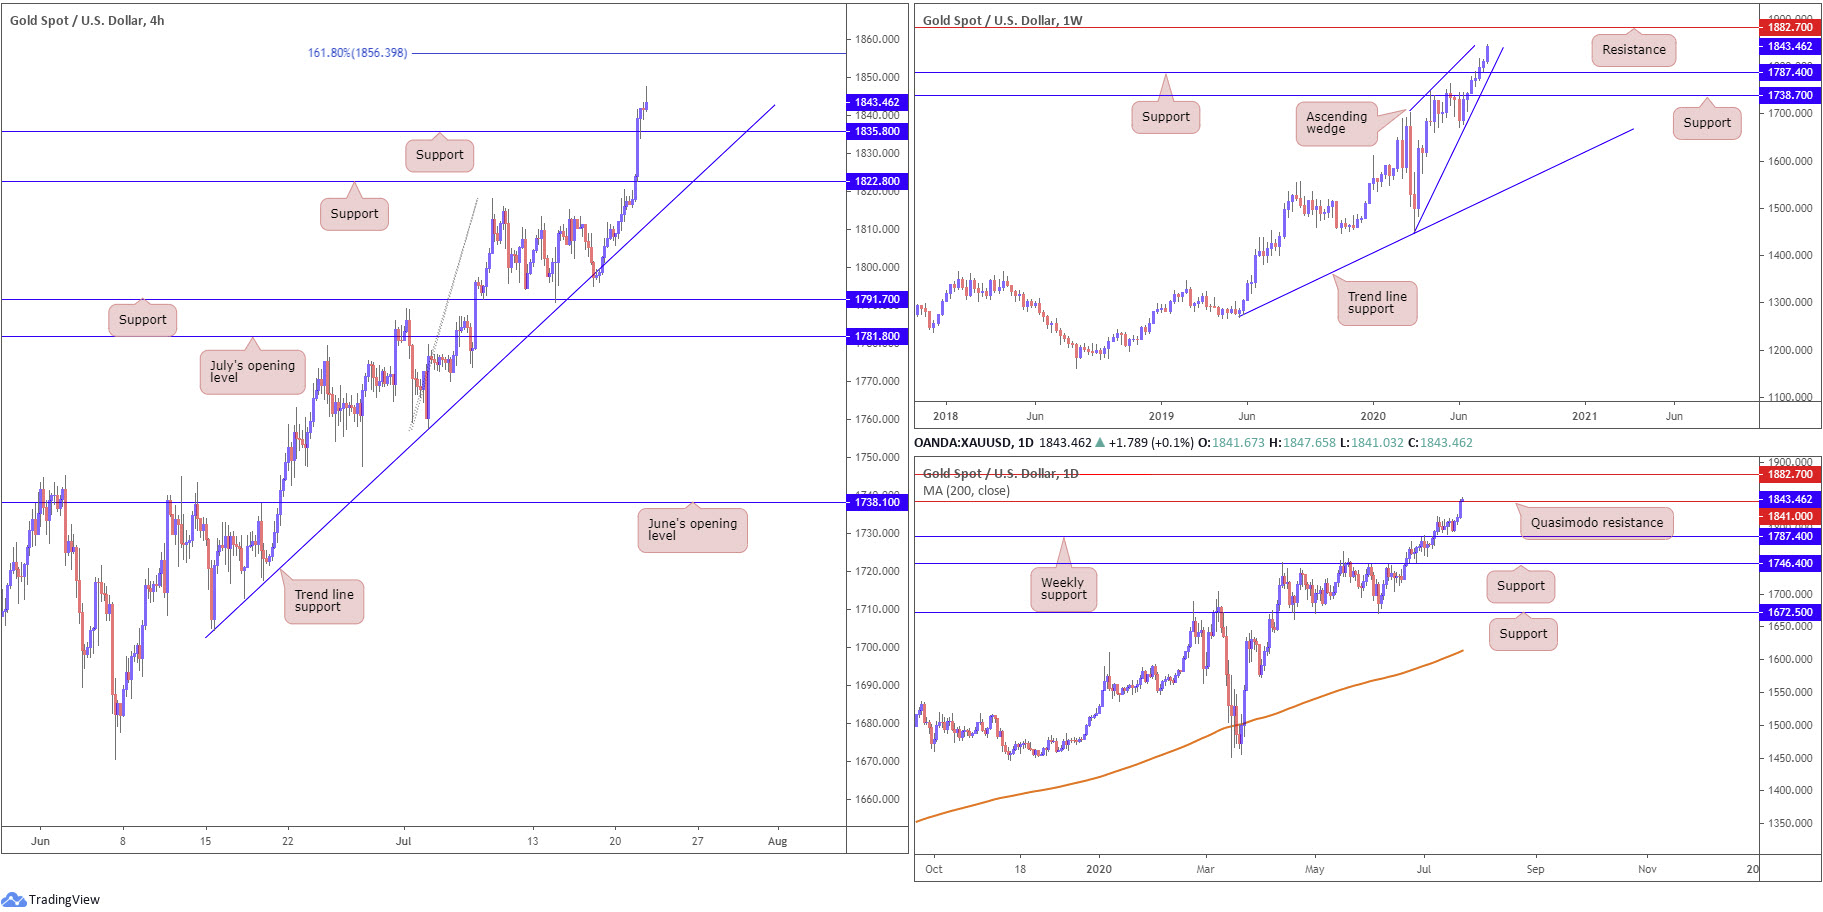
Tuesday observed bullion refresh multi-year peaks at 1847.6 amidst USD softness across the board.
In line with the underlying trend, technical developments on the weekly timeframe has price action extending space north of support at 1787.4, shifting focus towards resistance stationed at 1882.7. Also of interest on the weekly timeframe is a potential ascending wedge pattern, forming between 1451.4/1703.2.
With respect to the daily timeframe, we recently bumped into Quasimodo resistance at 1841.0. Conquering this base would, as you can see, throw light on the weekly resistance level mentioned above at 1882.7.
Against the backdrop of higher timeframe movement, H4, in strong fashion, sailed through two technical resistances at 1822.8 and 1835.8, respectively, both of which are now serving support levels. Current candle action echoes the possibility of a shooting star formation, suggesting a 1835.8 retest.
Areas of consideration:
The weekly timeframe forecasts additional bullish sentiment, while daily activity could potentially stumble at Quasimodo resistance from 1841.0. Despite daily resistance, H4 traders may still show interest in support from 1835.8, particularly if a H4 bullish candlestick emerges from the region.
Engulfing the daily Quasimodo resistance may lead to the yellow metal bringing in the 161.8% H4 Fibonacci extension point at 1856.3, followed by weekly resistance at 1882.7.
The accuracy, completeness and timeliness of the information contained on this site cannot be guaranteed. IC Markets does not warranty, guarantee or make any representations, or assume any liability regarding financial results based on the use of the information in the site.
News, views, opinions, recommendations and other information obtained from sources outside of www.icmarkets.com.au, used in this site are believed to be reliable, but we cannot guarantee their accuracy or completeness. All such information is subject to change at any time without notice. IC Markets assumes no responsibility for the content of any linked site.
The fact that such links may exist does not indicate approval or endorsement of any material contained on any linked site. IC Markets is not liable for any harm caused by the transmission, through accessing the services or information on this site, of a computer virus, or other computer code or programming device that might be used to access, delete, damage, disable, disrupt or otherwise impede in any manner, the operation of the site or of any user’s software, hardware, data or property.


