
Waiting for lower timeframe confirmation is our main tool to confirm strength within higher timeframe zones, and has really been the key to our trading success. It takes a little time to understand the subtle nuances, however, as each trade is never the same, but once you master the rhythm so to speak, you will be saved from countless unnecessary losing trades. The following is a list of what we look for:
- A break/retest of supply or demand dependent on which way you’re trading.
- A trendline break/retest.
- Buying/selling tails/wicks – essentially we look for a cluster of very obvious spikes off of lower timeframe support and resistance levels within the higher timeframe zone.
- Candlestick patterns. We tend to stick with pin bars and engulfing bars as these have proven to be the most effective.
We typically search for lower-timeframe confirmation between the M15 and H1 timeframes, since most of our higher-timeframe areas begin with the H4. Stops are usually placed 1-3 pips beyond confirming structures.
EUR/USD:
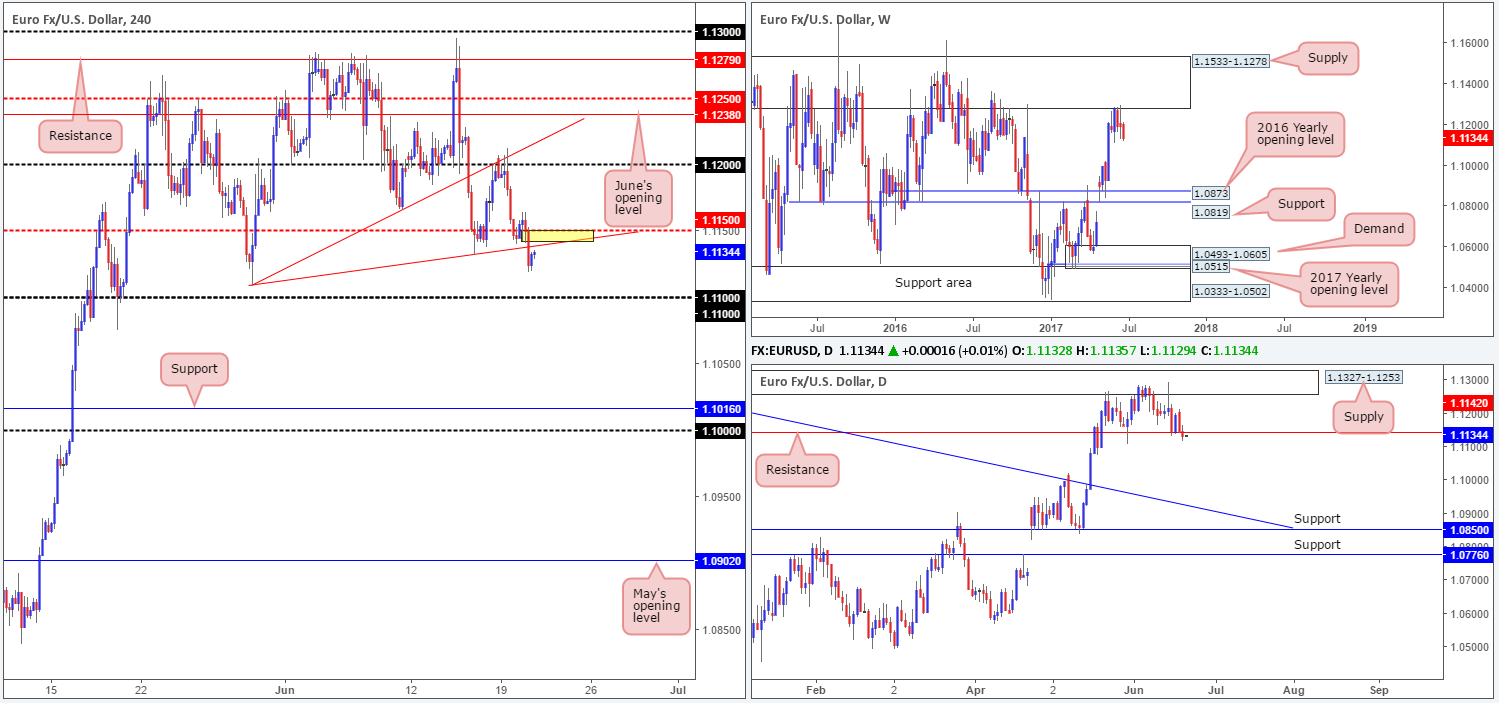
Kicking this morning’s report off from the weekly timeframe, we can see that the sellers continue to reflect a strong bearish stance from the underside of a major supply at 1.1533-1.1278. Looking down to the daily chart, price recently crossed below support at 1.1142. Assuming that this barrier holds as resistance, the next downside target in view is the trendline support etched from the high 1.1616, followed closely by support at 1.0850.
Across on the H4 chart, the mid-level support at 1.1150 was recently taken out along with the trendline support drawn from the low 1.1109. Should the small yellow area (represents the daily resistance and the two said H4 resistances) hold firm, then it’s likely that the single currency will test the 1.11 handle sometime today.
Our suggestions: In Tuesday’s report, we mentioned that before shorts are considered, the 1.11 handle will need to be consumed. While we still believe this to be the more conservative route, our desk would also consider shorts from 1.1150/1.1142 (the yellow zone on the H4 chart) today, as long as there is some form of lower-timeframe confirming action present (see the top of this report).
Ultimately the first take-profit target would be 1.11. A break below here, and we could see the unit stretch down as far as the 1.10 region.
Data points to consider: No high-impacting events on the docket today.
Levels to watch/live orders:
- Buys: Flat (stop loss: N/A).
- Sells: 1.1150/1.1142 ([waiting for a lower-timeframe confirming signal to form is advised] stop loss: dependent on where one confirms the area).
GBP/USD:
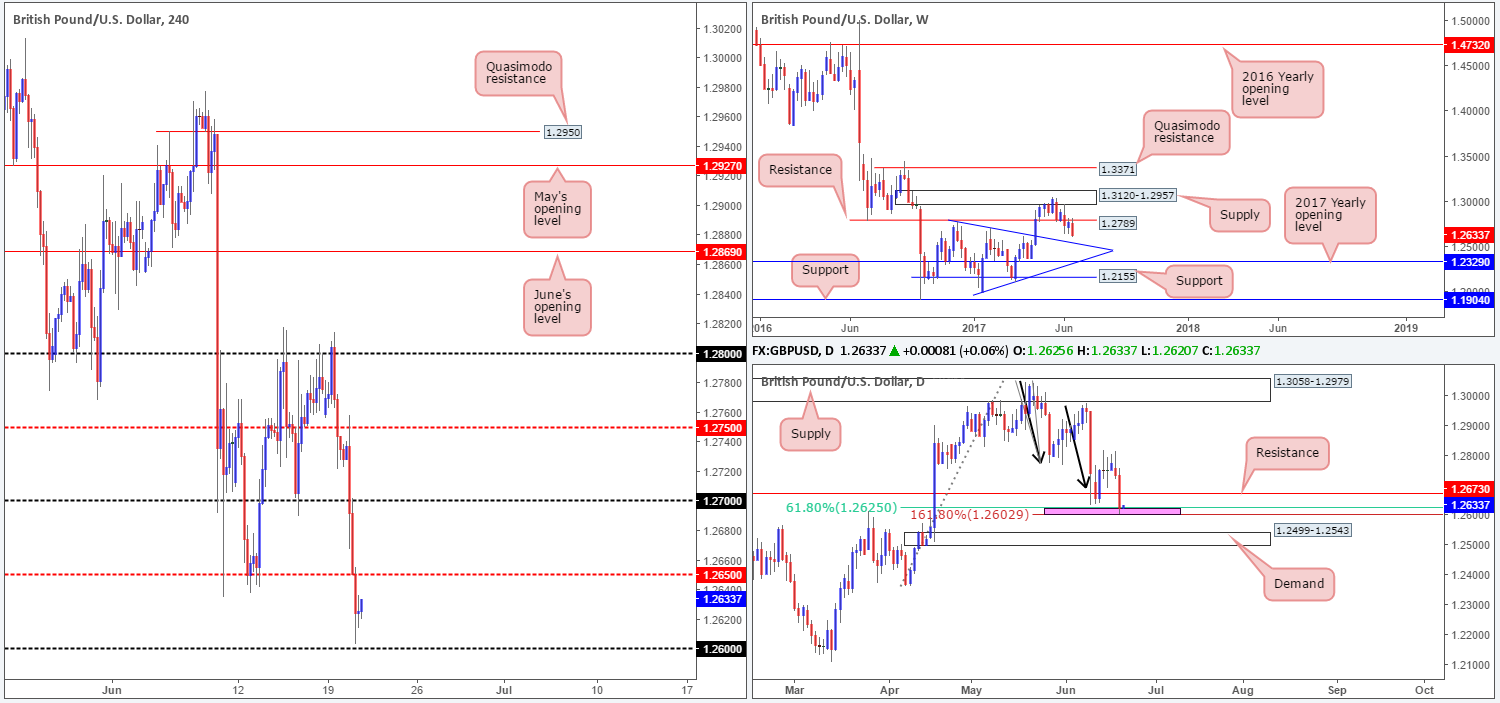
In response to Gov. Carney’s speech yesterday, the GBP aggressively weakened and took out the 1.27 handle along with it. Following this, downside momentum continued to be seen and it was not until the US open did we see any sign of bullish intent.
Leaving the 1.26 handle unchallenged, the bulls managed to clock a high of 1.2636 by the closing bell. This move was also likely helped by the daily AB=CD (black arrows) 161.8% ext. completion point seen at 1.2602 drawn from the high 1.3047, and the 61.8% daily Fib support at 1.2625 taken from the low 1.2365.
Despite the above, weekly price shows room to extend down to a trendline support taken from the high 1.2774, which happens to intersect with daily demand seen below the two above said daily Fib levels at 1.2499-1.2543.
Our suggestions: Neither a long nor short seems attractive at the moment. On the one hand, weekly flow indicates lower prices may be on the cards, and on the other hand, the daily chart is trading from two closely converging Fib levels. Therefore, no matter which direction you take, you’ll be trading against higher-timeframe flow! With that being the case, our team has decided to remain on the sidelines for the time being until we have more of a defined direction in this market.
Data points to consider: MPC member Haldane speaks at 12pm GMT+1.
Levels to watch/live orders:
- Buys: Flat (stop loss: N/A).
- Sells: Flat (stop loss: N/A).
AUD/USD:
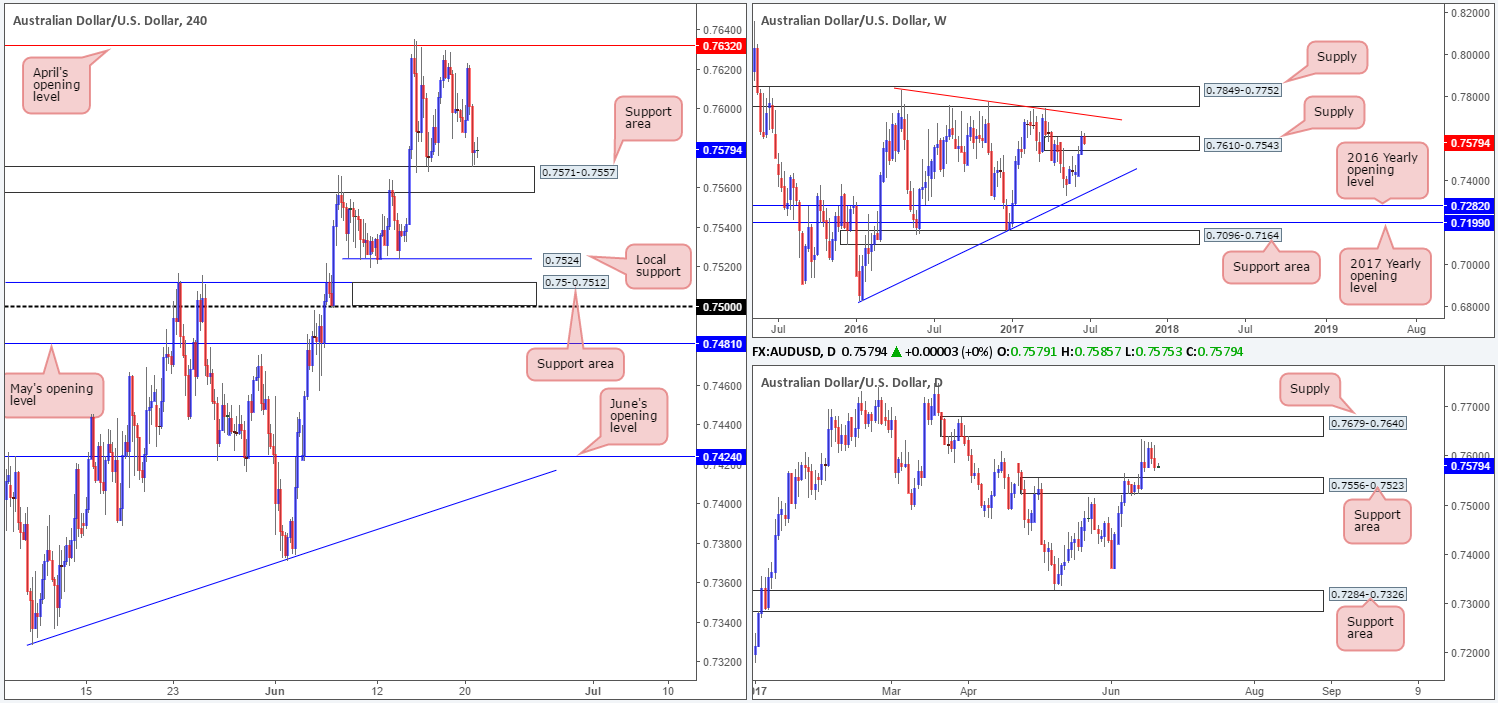
The AUD/USD, as you can see on the H4 chart, remains consolidating between April’s opening level at 0.7632 and the support area coming in at 0.7571-0.7557. Of particular interest is April’s opening level being sited just 8 pips below the lower edge of a daily supply at 0.7679-0.7640. Furthermore, a pip below the current H4 support area is a daily support area positioned at 0.7556-0.7523.
On the weekly timeframe, however, we can see that the unit marginally closed above supply at 0.7610-0.7543. As we mentioned in Monday’s report, it may be worth waiting for this week’s candle to close before presuming that the said weekly supply is consumed, since it could just as well be a fakeout.
Our suggestions: Right now, we’re not only capped by the current H4 consolidation, we’re also confined by the neighboring daily demand and supply mentioned above! To that end, we still stand by Tuesday’s suggestion: an ideal scenario would be for H4 price to chalk up a bearish selling wick that whipsaws through 0.7632, connects with the daily supply and then closes back below 0.7632. This would, in our humble opinion, be enough evidence to validate a sell, with an initial target objective set at the said H4 support area.
Data points to consider: No high-impacting events on the docket today.
Levels to watch/live orders:
- Buys: Flat (stop loss: N/A).
- Sells: Look for H4 price to chalk up a bearish selling wick that whipsaws through 0.7632 and connects with daily supply (stop loss: ideally beyond the candle’s wick).
USD/JPY:
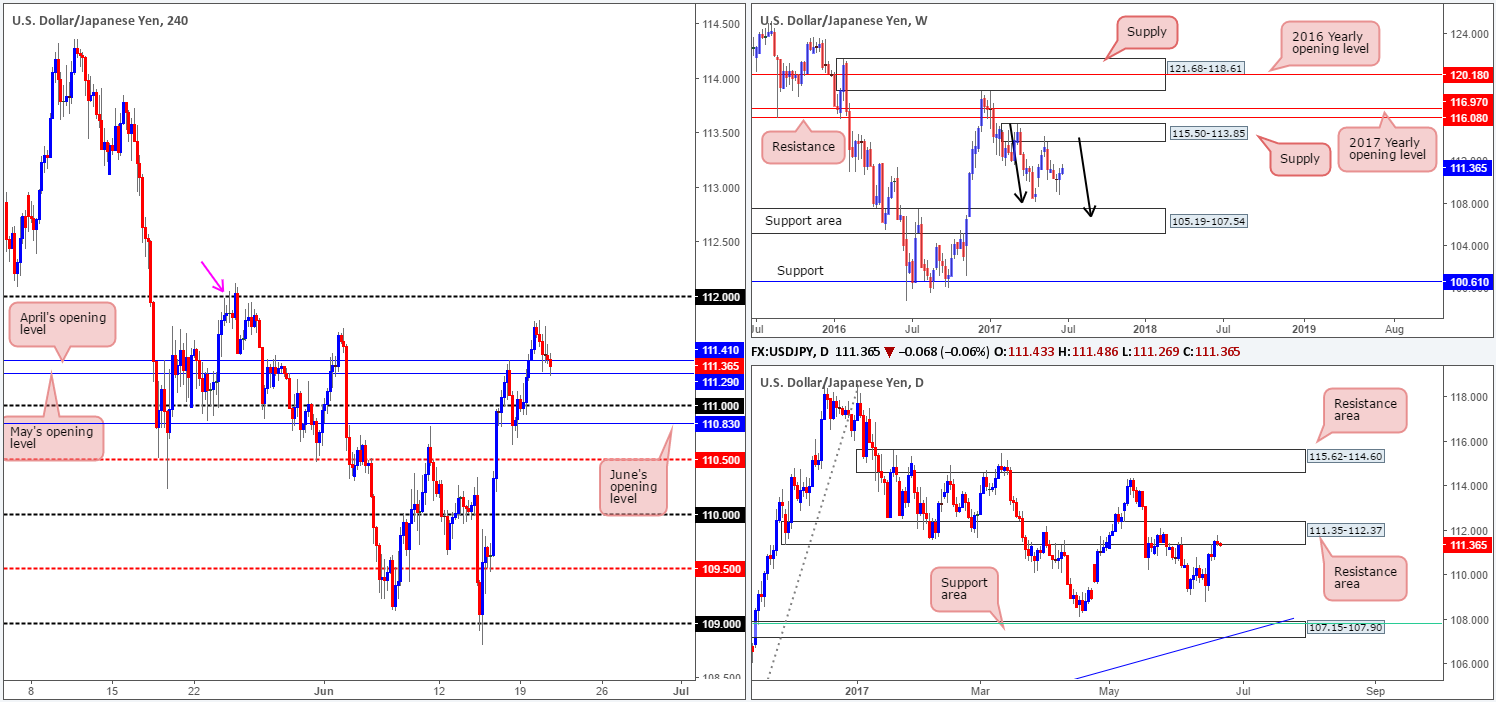
During the course of yesterday’s sessions, the USD/JPY pair topped at 111.78 and pulled back to May/April’s opening levels at 111.29/111.41.Although these two levels appear to be holding steady, there may be trouble lurking ahead. Over on the daily timeframe, see how price chalked up a selling wick around the underside of supply at 111.35-112.37. In addition to this, we still feel that weekly bears remain in a relatively strong position after pushing aggressively lower from supply registered at 115.50-113.85. We know there’s a lot of ground to cover here, but this move could possibly result in further downside taking shape in the form of a weekly AB=CD correction (see black arrows) that terminates within a weekly support area marked at 105.19-107.54 (stretches all the way back to early 2014).
Our suggestions: Buying from 111.29/111.41 is a risky move, as far as we’re concerned, since you’d be going up against potential weekly and daily sellers. Shorting this market below 111.29/111.41 is also difficult. Yes, we would have higher-timeframe flow on our side, but we’d be selling into the 111 handle, followed closely by June’s opening level at 110.83.
Data points to consider: No high-impacting events on the docket today.
Levels to watch/live orders:
- Buys: Flat (stop loss: N/A).
- Sells: Flat (stop loss: N/A).
USD/CAD:
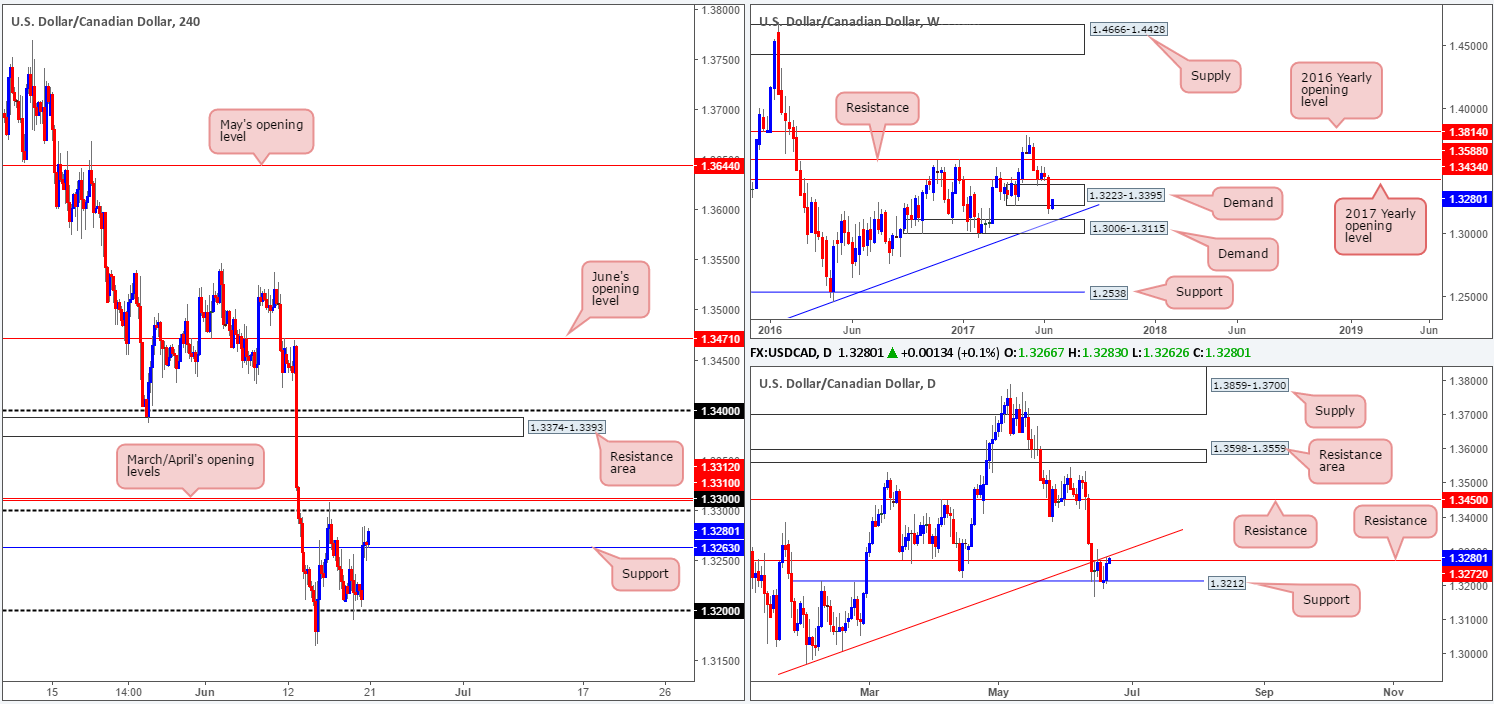
Monday’s call to buy from 1.32 worked out beautifully, as expected. The move from this number recently lifted H4 price above resistance at 1.3263 and now looks poised to attack the 1.33 handle, shadowed closely by March/April’s opening levels at 1.3312/1.3310. However, we do feel the bulls will likely struggle here since we’re also dealing with daily resistance at 1.3272 and a daily trendline resistance etched from the low 1.2968. On a more positive note, nevertheless, weekly action is seen trading from within the walls of demand formed at 1.3223-1.3395, which could help the buyers penetrate the said daily levels.
Our suggestions: Despite weekly bulls standing in a relatively favorable position, entering long when we know that both the daily and H4 charts show resistance structures ahead is not something our desk would feel comfortable with. By the same token, selling is just as risky, in our opinion, as you’d be shorting into weekly demand! Therefore, unless you are still long from 1.32, we would advise remaining flat today.
Data points to consider: Crude oil inventories at 3.30pm GMT+1.
Levels to watch/live orders:
- Buys: Flat (Stop loss: N/A).
- Sells: Flat (Stop loss: N/A).
USD/CHF:
On Tuesday, the pair spent the day clinging to the green H4 area at 0.9774/0.9750. This zone is comprised of a H4 resistance level at 0.9774, a H4 AB=CD 127.2% ext. at 0.9760 taken from the low 0.9613, a H4 trendline resistance etched from the low 0.9691 and a H4 mid-level resistance drawn from 0.9750.
As we mentioned in our previous report, although the confluence surrounding the green zone is attractive, we have our eyeballs on the H4 supply seen overhead at 0.9825-0.9801. Apart from converging with a H4 AB=CD 161.8% ext. at 0.98 taken from the low 0.9613 and the round number 0.98, this area is also positioned around the upper edge of daily supply marked at 0.9825-0.9786.
Our suggestions: Should price strike the H4 supply area mentioned above at 0.9825-0.9801 today/this week, we would, dependent on the time of day, look to sell from here at market, with stops sited at 0.9827, targeting 0.9750 as an initial take-profit zone.
Data points to consider: No high-impacting events on the docket today.

Levels to watch/live orders:
- Buys: Flat (stop loss: N/A).
- Sells: 0.98 (stop loss: 0.9827).
DOW 30:
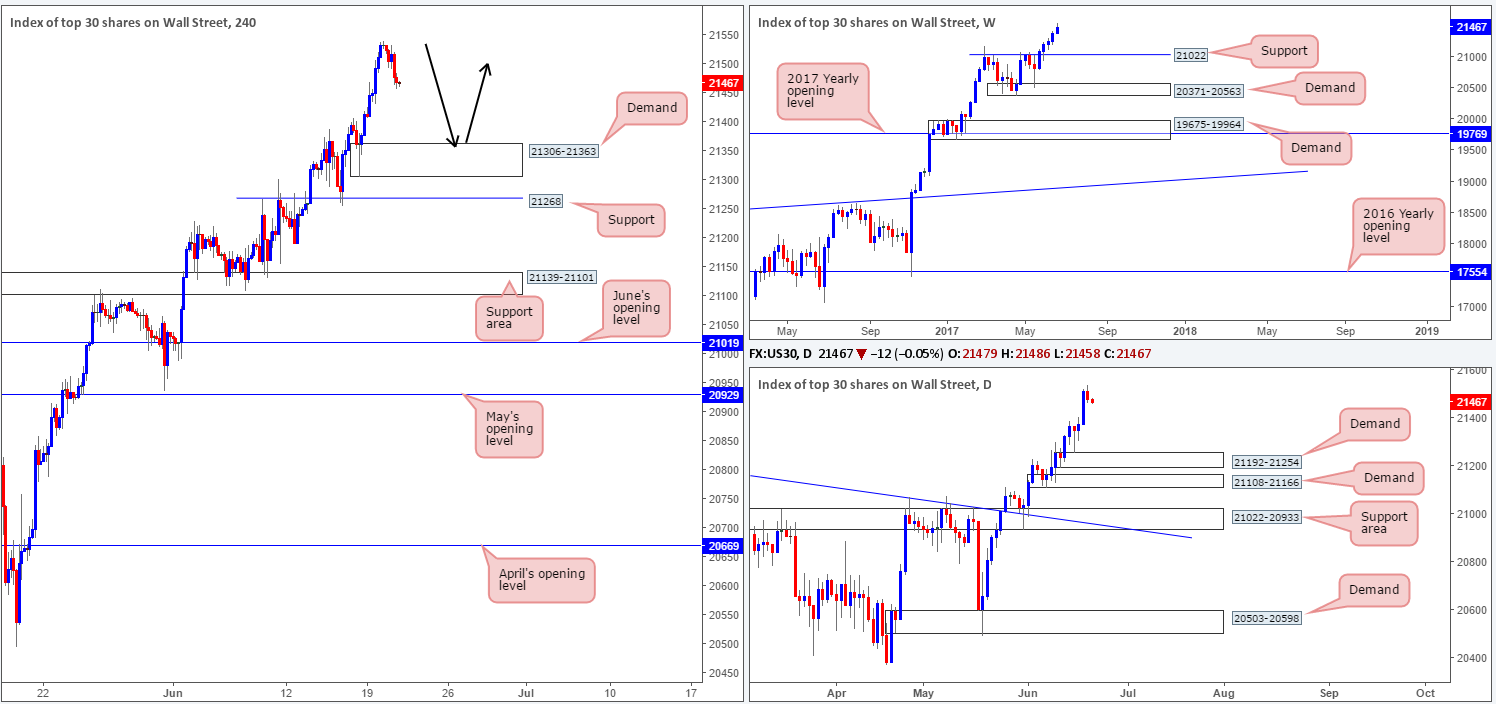
US equities pulled back from a fresh record high of 21541 yesterday, bringing H4 price to a low of 21465.Should the index continue to be sold, the next port of call will likely be the H4 demand base coming in at 21306-21363. For those who follow our analysis on a regular basis, you may recall that our desk is currently long from 21164. 50% of that position was quickly liquidated at 21234, with the remaining 50% left in the market to run since we intend on trailing this trend long term. The stop-loss order is currently positioned below the said H4 demand at 21298, as we believe this to be the safest area for the time being.
Our suggestions: Personally, we are looking for price to continue rallying before it reaches the aforementioned H4 demand. Should price challenge 21306-21363 this week, however, and is reinforced by a full or near-full-bodied bullish candle, we may look to add to our current position (as per the black arrows) and trail accordingly.
Data points to consider: No high-impacting events on the docket today.
Levels to watch/live orders:
- Buys: 21164 ([live] stop loss: 21298). 21306-21363 ([waiting for a reasonably sized H4 bull candle – preferably a full-bodied candle – to form before pulling the trigger is advised] stop loss: ideally beyond the candle’s tail).
- Sells: Flat (stop loss: N/A).
GOLD:
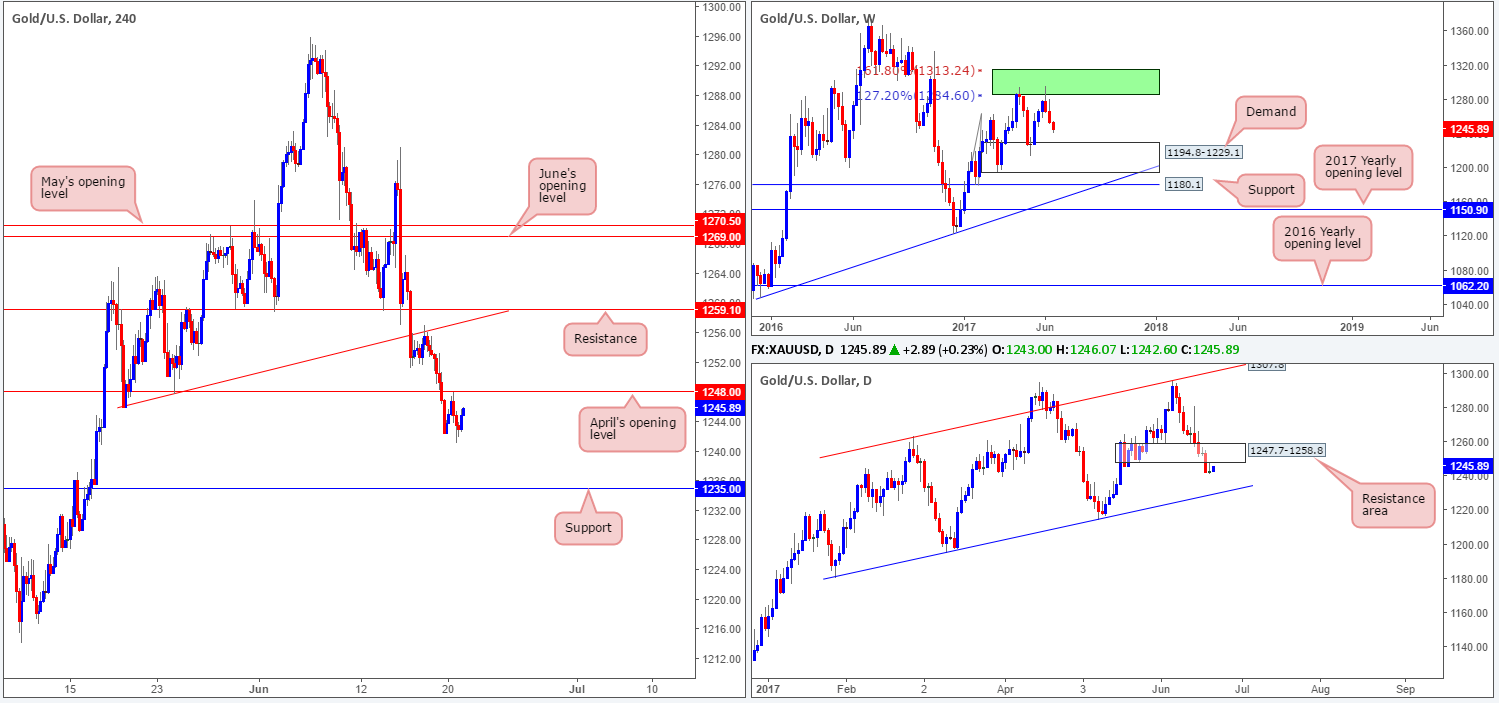
Early on in yesterday’s US segment, the yellow metal retested April’s opening level at 1248.0 as resistance. In Tuesday’s report, we stated that should this level be tested and accompanied by a reasonably sized H4 bearish candle (preferable a full-bodied candle), then it’d be an ideal zone to sell from. H4 price did print a bearish candle from this line, but also slightly corrected before the candle closed, so we passed on the setup.
To our way of seeing things, it appears as though the H4 candles are going to retest April’s level once again. Given that this line is bolstered by a daily resistance area formed at 1247.7-1258.8, and weekly price shows room to extend down to demand pegged at 1194.8-1229.1, this line still deserves attention.
Our suggestions: As such, a second retest of April’s opening level at 1248.0 would, if it’s accompanied by a reasonably sized H4 bearish candle (preferable a full-bodied candle), be an ideal zone to sell from, targeting the H4 support level at1235.0, followed closely by the top edge of weekly demand at 1229.1.
Levels to watch/live orders:
- Buys: Flat (stop loss: N/A).
- Sells: 1248.0 region ([waiting for a reasonably sized H4 bear candle – preferably a full-bodied candle – to form before pulling the trigger is advised] stop loss: ideally beyond the candle’s wick).


