
Key risk events today:
UK Inflation; Canada Inflation; BoE Gov. Bailey Speaks; FOMC Meeting Minutes.
(Previous analysis as well as outside sources – italics).
EUR/USD:
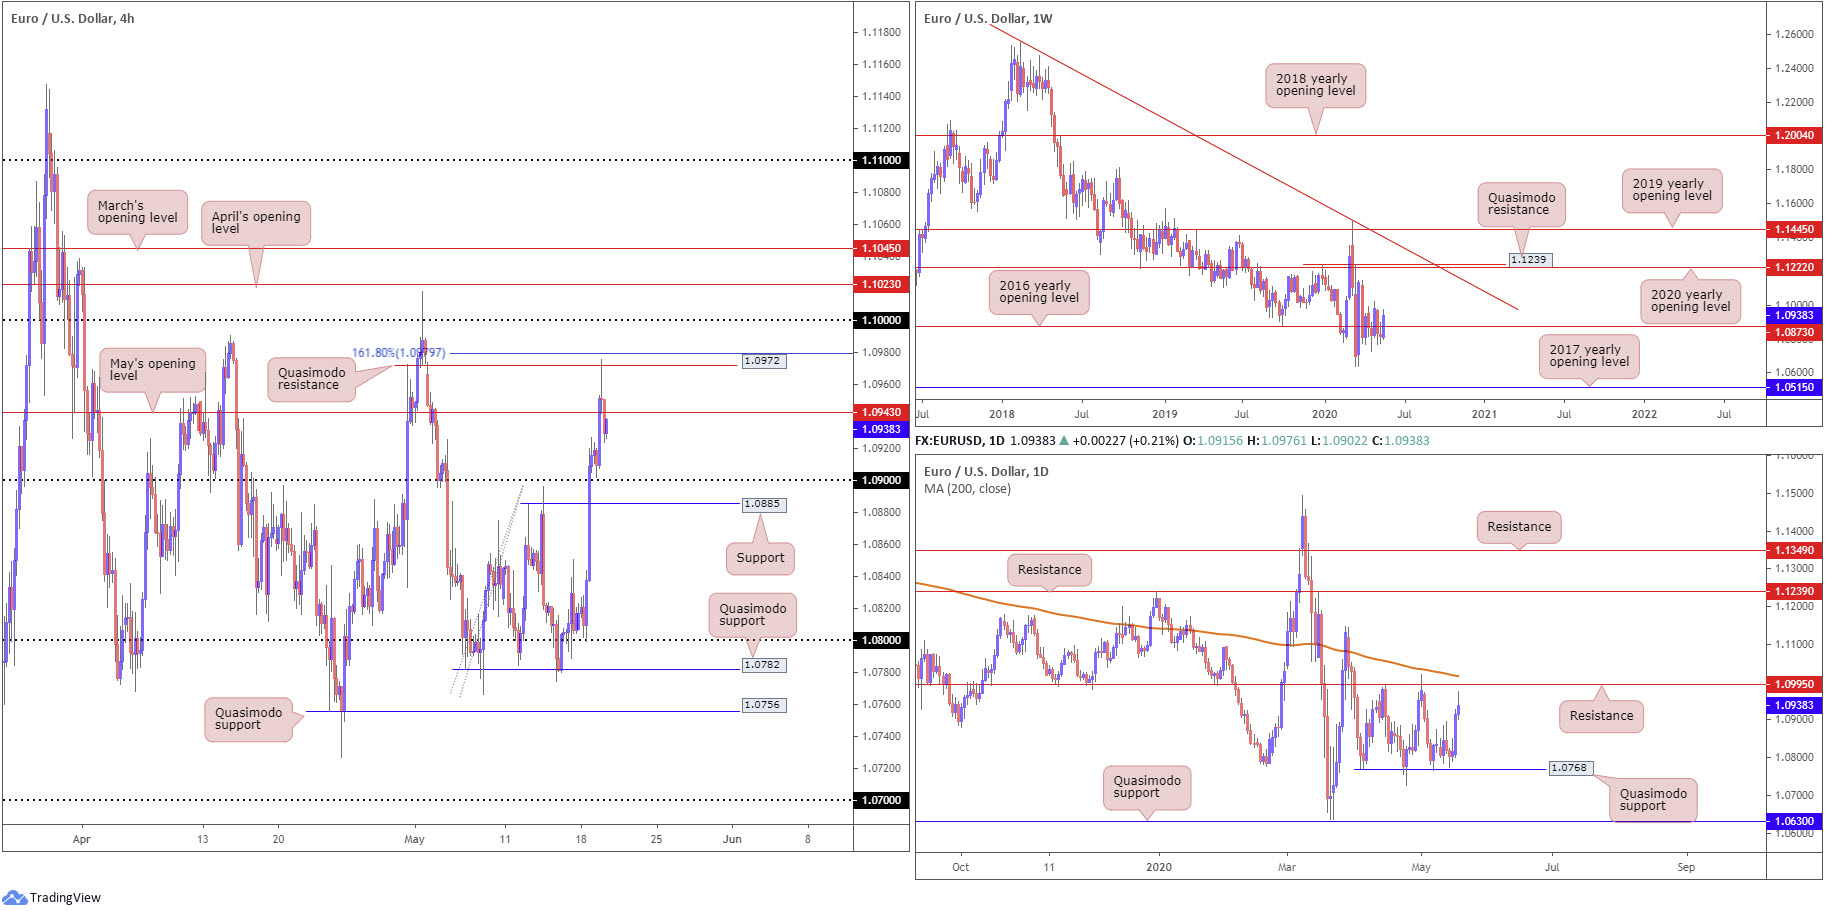
Europe’s shared currency extended Monday’s vigorous recovery against the US dollar on Tuesday, scoring highs at 1.0976.
EUR/USD, as you can see, tested H4 Quasimodo resistance at 1.0972, missing a 161.8% Fibonacci extension point at 1.0979 by a couple of pips, before retreating after French Finance Minister Le Maire dampened euphoria by underlining the extra Eur500 billion cash will not be available until 2021.
H4 action concluded the session south of May’s opening level at 1.0943, throwing light on 1.09 as potential support today, with a break exposing support at 1.0885 (prior Quasimodo resistance).
Further afield, weekly price is attempting to regain footing above the 2016 yearly opening level at 1.0873, with further buying potentially setting the stage for an eventual run to the 2020 yearly opening level at 1.1222. A bump lower from here, though, could have multi-year lows enter at 1.0635. It’s also worth reminding ourselves the pair has remained in a long-term downtrend since topping in early 2018.
Price movement on the daily timeframe, despite topping at 1.0976, still has eyes on resistance at 1.0995, followed by the 200-day SMA (orange – 1.1016). Traders may also want to note between the said resistance and a Quasimodo support at 1.0768 has, since early April, seen a consolidation form.
Areas of consideration:
1.09 may be brought into the frame as support today. Yet, as underlined in Tuesday’s technical briefing, traders are also urged to pencil in the possibility of a fakeout through the round number to H4 support at 1.0885, before buyers step in. As for upside targets, traders will likely settle at 1.0943 as an initial base.
In the event we climb, leaving 1.09 unchallenged, eyes will likely be on the key figure 1.10, which comes together with a daily resistance level plotted at 1.0995.
GBP/USD:
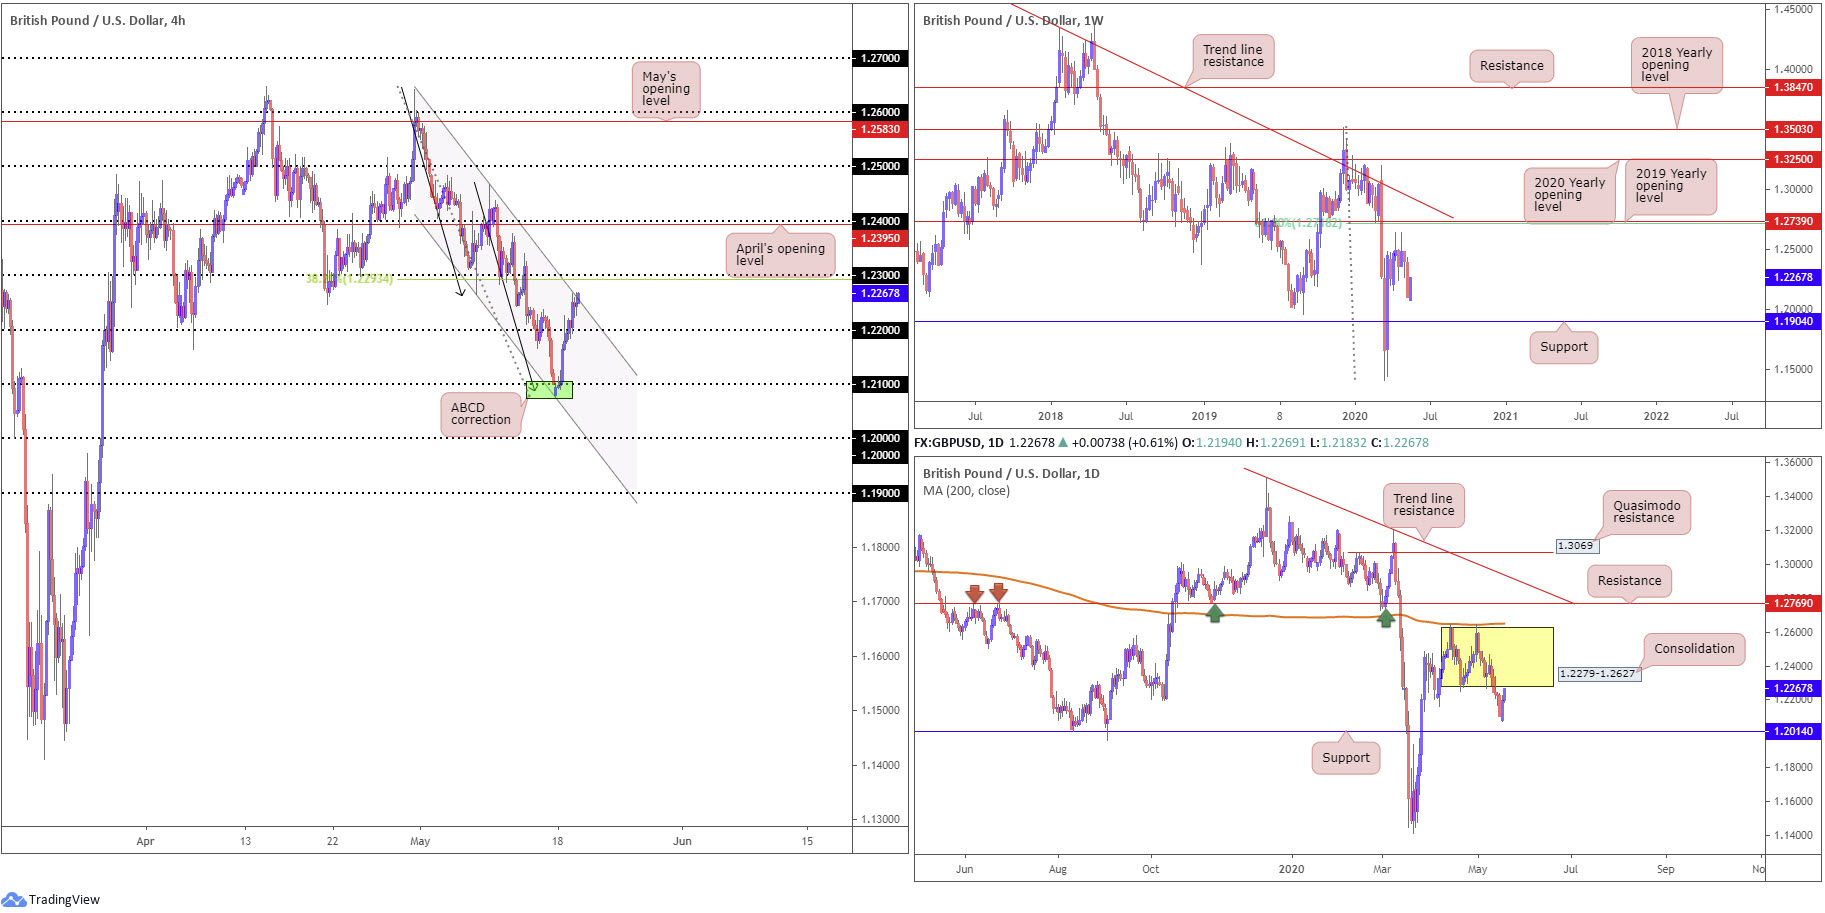
Sterling, like the euro, extended recovery gains against the buck Tuesday, toppling 1.22 and reaching H4 channel resistance, extended from the high 1.2642. On the data front, UK claimant count came in higher than expected along with marginally weaker-than-consensus earnings. Unemployment, nonetheless, beat expectations at 3.9% vs. 4.4%.
Above the current H4 channel resistance, technicians will note the 1.23 handle and 38.2% Fibonacci retracement ratio at 1.2293. What’s notable about this Fibonacci level is it marks the first take-profit target out of the recently completed H4 ABCD completion (black arrows) from 1.2085.
Higher up on the curve, we can see from the weekly timeframe we have support positioned at 1.1904, while resistance is found at 1.2739, the 2019 yearly opening level, closely intersecting with a 61.8% Fibonacci retracement ratio at 1.2718. Movement on the daily timeframe, however, locates price action at the underside of recently broken daily range lows at around 1.2279.
Areas of consideration:
It’s likely we’re to see a break of the H4 channel resistance today, in favour of offers residing around the 1.23 angle. In light of this level uniting with a 38.2% Fibonacci retracement ratio at 1.2293, a level with a connection to the recently completed H4 ABCD correction, and daily price toying with the lower edge of a familiar range, sellers may make an appearance from the 1.23ish vicinity today.
AUD/USD:
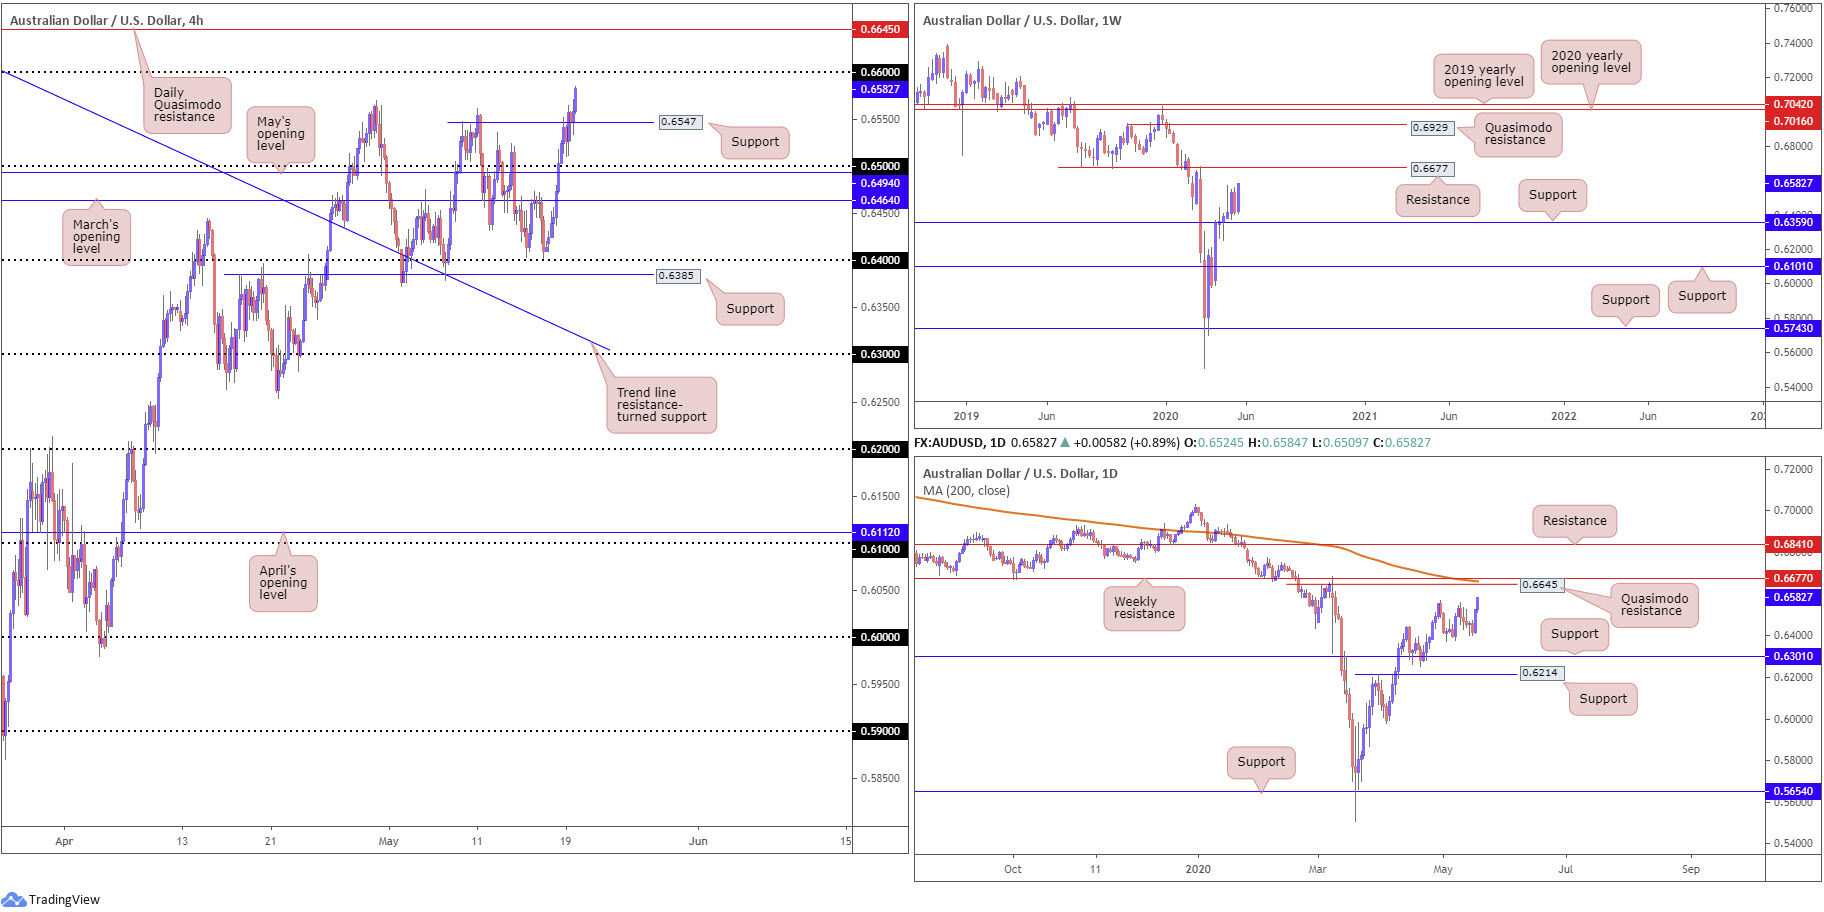
The Australian dollar rallied against the US dollar Tuesday, building on Monday’s 100-pip advance. Reclaiming all of the prior week’s losses, the weekly timeframe suggests scope for further buying this week, targeting resistance coming in at 0.6677.
A closer reading of price action on the daily timeframe had the unit burst through the 0.6569 April 30 high, perhaps unlocking the door for a rally to a Quasimodo formation from 0.6645, parked just ahead of the weekly resistance level mentioned above at 0.6677 and a 200-day SMA (orange – 0.6661).
Across the page on the H4 timeframe, Quasimodo resistance at 0.6547 was overturned yesterday, visibly supporting price shortly after. 0.66 is positioned within touching distance, with a break directing focus to daily Quasimodo resistance mentioned above at 0.6645.
Areas of consideration:
Traders long the break of 0.6547 may be watching 0.66 as a cue to reduce risk to breakeven and potentially bank partial profits. Beyond 0.66 today could see longs add to their positions, fuelled by fresh breakout buying north of 0.66, targeting 0.6645 and weekly resistance at 0.6677.
USD/JPY:
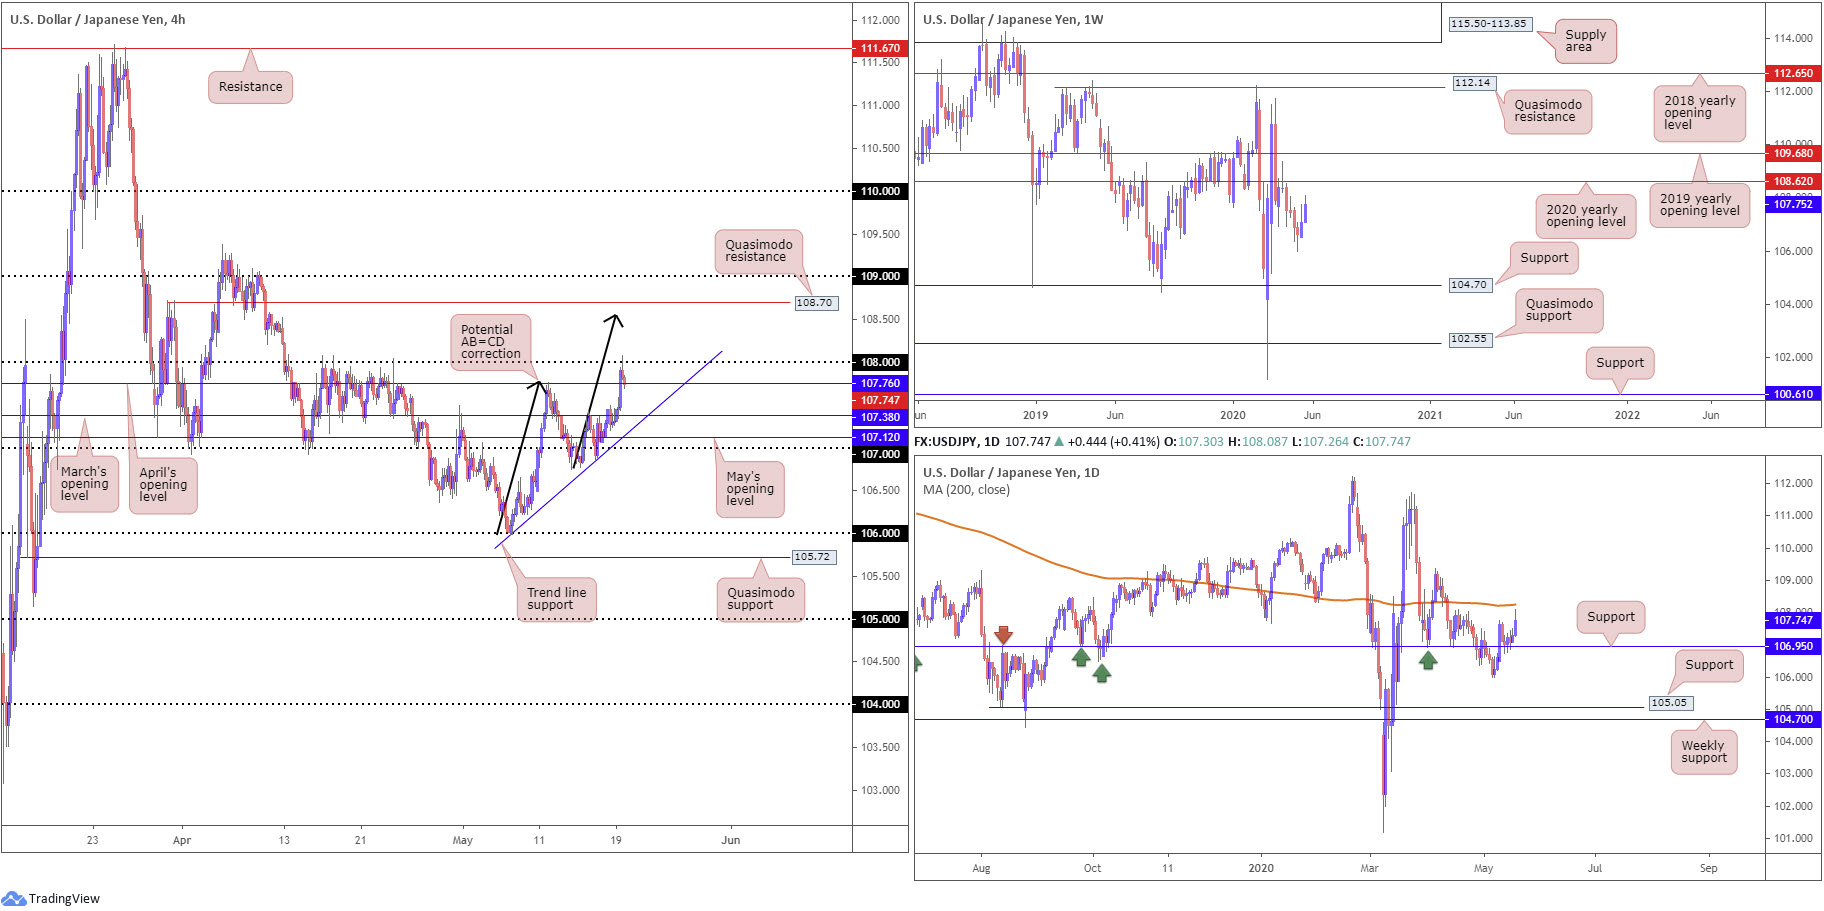
The US dollar exhibited a reasonably strong upside bias against the Japanese yen on Tuesday amid reports of further policy easing by the Bank of Japan. Sustained USD weakness and technical selling off 108, nonetheless, put a cap on gains, with H4 action retesting April’s opening level at 107.76, as we write. Above 108 shows scope to approach an AB=CD correction (black arrows) at 108.56, closely followed by Quasimodo resistance at 108.70. Further downside, on the other hand, could lead to March’s opening level at 107.38 being brought into view, as well as an intersecting trend line support, etched from the low 105.98.
Extending last week’s recovery, a move that snapped a five-week bearish phase, USD/JPY bulls appear poised to retest the 2020 yearly opening level at 108.62 on the weekly timeframe. A rotation to the downside, however, has support at 104.70 to target.
Technical action on the daily timeframe recently shook hands with support at 106.95, after dipping from three-week tops at 107.76. Current movement, as you can see, came within striking distance of bringing in the 200-day SMA (orange – 108.25).
Areas of consideration:
The higher timeframes suggest additional bullish sentiment could be on the horizon, despite 108 serving as resistance.
A fakeout through 108 into the 200-day SMA at 108.25 is a potential scenario today, possibly interesting sellers. Buy-stops contained above 108 will likely provide enough fuel to sell. Conservative traders, though, may seek a H4 close back beneath 108 before committing.
The H4 AB=CD correction at 108.56 also marks an interesting reversal zone, an area boasting a close relationship with H4 Quasimodo resistance at 108.70 and weekly resistance at 108.62 (the 2020 yearly opening level).
USD/CAD:
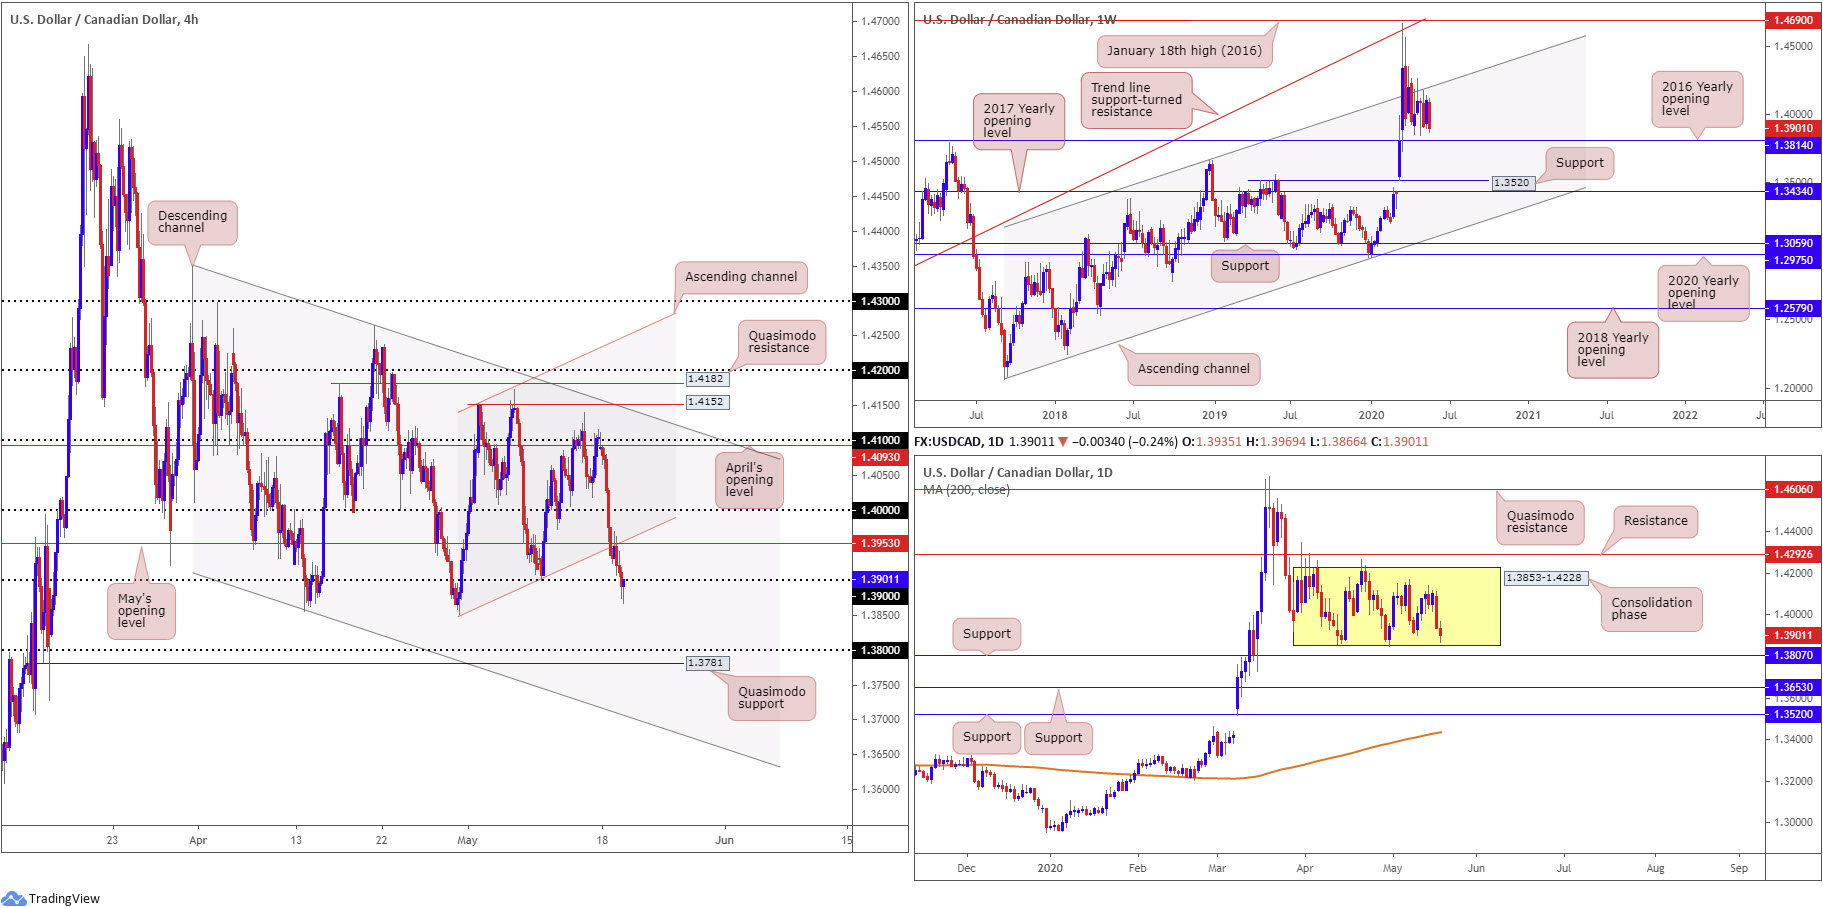
Registering fresh monthly lows at 1.3866, USD/CAD cruised through May’s opening level at 1.3953 on the H4 timeframe, as well as a channel support, extended from the low 1.3850, and, in recent hours, the 1.39 handle. Assuming we hold under 1.39, broad USD weakness shifts focus towards the 1.38 handle and Quasimodo support from 1.3781.
The story on the daily timeframe, nonetheless, has seen price action carve out a consolidation between 1.3853-1.4228. As you can see, we are trading within close proximity of range lows, as we write. Areas outside of the base can be found at resistance drawn from 1.4292 and support at 1.3807. In addition, traders will note the 200-day SMA (orange – 1.3435) has been drifting northbound since March.
The daily range is also visible on the weekly timeframe, forming mid-way between a long-standing channel resistance, taken from the high 1.3661, and support off the 2016 yearly opening level at 1.3814. The said base stands in a reasonably healthy position as, overall, we’ve been trending higher since September 2017.
Areas of consideration:
If 1.39 holds as resistance, sellers may make a show, with plans on reaching daily range lows at 1.3853 and maybe, with a little oomph, the 1.38 handle.
Reclaiming 1.39+ status, on the other hand, could see H4 action form resistance off May’s opening level at 1.3953, positioned closely with H4 channel support-turned resistance (green).
USD/CHF:
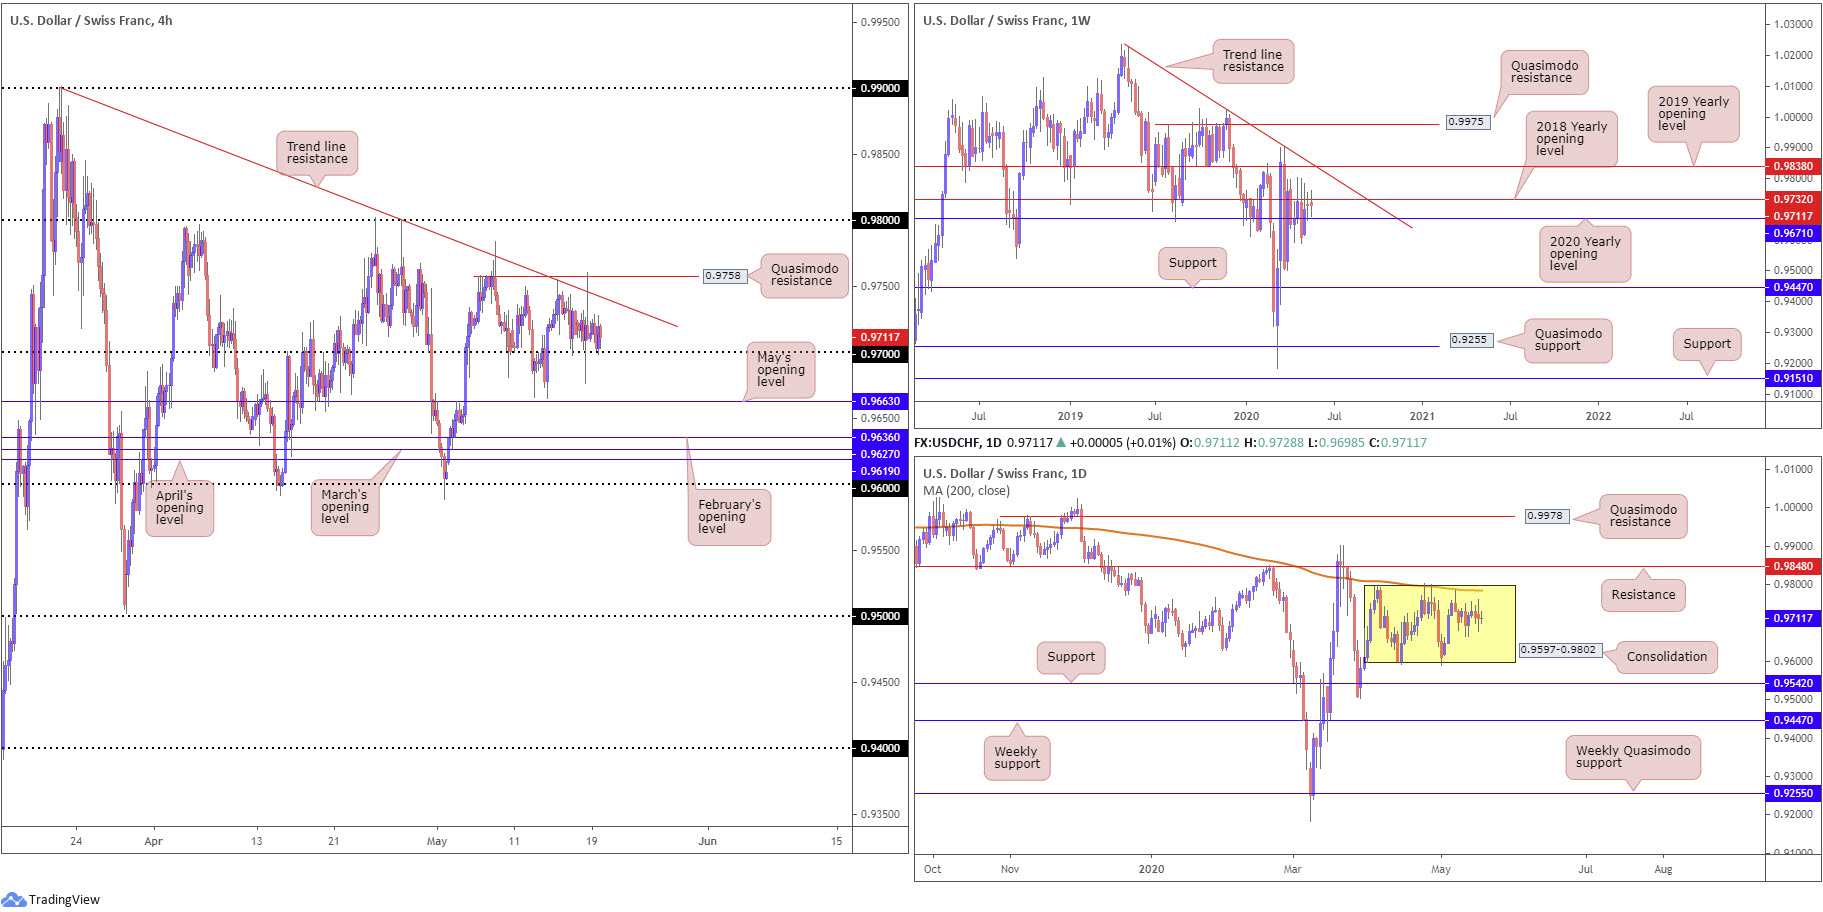
Shifting focus to the weekly timeframe reveals, from April onwards, the 2018 yearly opening level at 0.9732 has established resistance, recently motioned in the form of consecutive selling wicks off 0.9800ish. Last week, and the current week’s candle, however, echo an indecisive tone in the form of clear-cut indecision candles beneath 0.9732. Technical structure above 0.9732 is seen at the 2019 yearly opening level at 0.9838 and a trend line resistance, taken from the high 1.0226. Moves south of nearby support at 0.9671 (the 2020 yearly opening level), however, throws light on the possibility of a run to support at 0.9447.
Price action on the daily timeframe continues to seesaw between gains/losses, inside a month-long range between 0.9802/0.9597. Note the 200-day SMA (orange – 0.9784) is seen circling the upper edge of the said range. Outside of the consolidation, we see resistance at 0.9848 while support can be found at 0.9542.
Against the backdrop of higher-timeframe flow, H4 trend line resistance, etched from the high 0.9900, and a Quasimodo resistance at 0.9758 remain standout levels to the upside on the H4 scale. 0.97, despite a vigorous break to lows at 0.9676, also remains notable support. Taking out the aforesaid resistances shines focus on the 0.98 handle, while trekking sub 0.97 has May’s opening level at 0.9663 on the radar.
Areas of consideration:
Having noted weekly price gripping the underside of resistance at 0.9732 (2018 yearly opening level), violating 0.97 would not be surprising. Although a push through 0.97 advertises a possible run to May’s opening level at 0.9663 on the H4 timeframe, traders are urged to pencil in weekly support at 0.9671, the 2020 yearly opening level, which could also hamper downside. Therefore, unless you’re prepared to drill down to the lower timeframes and trade tighter stops, the distance between 0.97 and 0.9671 may be too narrow to consider breakout scenarios.
In case of buying, 0.98 could be the next resistance in line, assuming we take over the current H4 trend line resistance and Quasimodo formation at 0.9758. Given 0.98’s connection to the upper edge of the current daily range, 0.98 could serve as not only as a take-profit target for longs above 0.97 and additional intraday long positions above 0.9758, but also as a platform for sellers.
Dow Jones Industrial Average:
Concerns surrounding Moderna’s coronavirus vaccine weighed on US stocks Tuesday. The Dow Jones Industrial Average dipped 390.51 points, or 1.59%; the S&P 500 erased 30.97 points, or 1.05%, and the tech-heavy Nasdaq 100 concluded lower by 33.38 points, or 0.36%.
Technically, H4 flow reconnected with a familiar area of resistance on Tuesday, moving into the London session, comprised of a daily resistance level at 24934 and weekly resistance, by way of the 2018 yearly opening level, at 24660 (blue). The reaction has drawn H4 candles back to May’s opening level at 24121.
Since mid-April on the weekly timeframe, price has been sandwiched between 23313 (2019 yearly opening level) and 24660, closely shadowed by a 61.8% Fibonacci retracement ratio at 25229. A violation of 23313 shines light on support from 18364, whereas the sky above 25229 is reasonably clear back to the 2020 yearly opening level at 28595.
A similar picture is present on the daily timeframe, only resistance rests at 24934 and support at 23291. Beyond resistance we have the 200-day SMA (orange – 26362) lurking close by, whereas through support we may find another layer of support emerge at 21045.
Areas of consideration:
In light of where we’re trading from on the higher timeframes, between 24934/24660, a violation of May’s opening level at 24121 is possible, with breakout sellers targeting H4 support at 23350 as an initial take-profit zone, followed by H4 support at 22405/22816.

XAU/USD (GOLD):
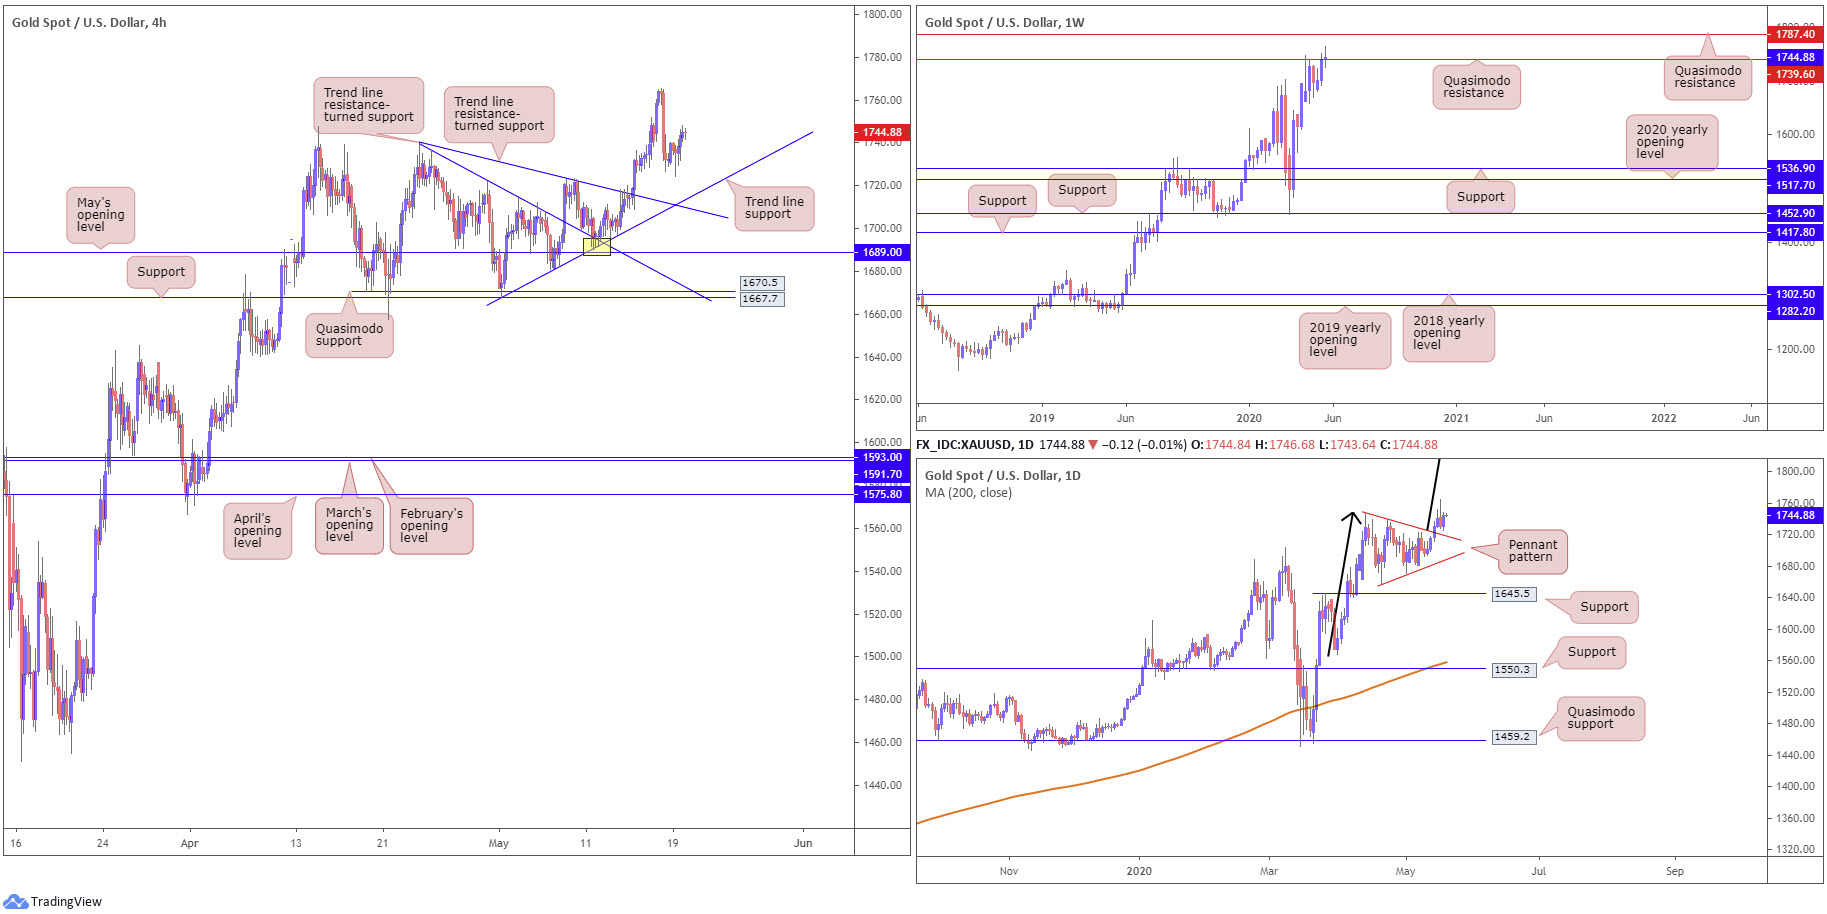
Coming from the top this morning, the technical landscape on the weekly timeframe shows price attempting to establish position above Quasimodo resistance at 1739.6. Clearance of this level perhaps places another layer of Quasimodo resistance on the hit list at 1787.4. It may also interest some traders to note the trend on gold has faced a northerly trajectory since 2016.
In conjunction with weekly buyers showing spirit above Quasimodo resistance, chart pattern traders on the daily timeframe will note the recently formed pennant pattern, established from a high of 1747.7 and a low of 1658.1, had its upper boundary breached into the later stages of last week. Take-profit targets out of these patterns are measured by taking the preceding move (black arrows) and adding the value to the breakout point. As you can see, this is a sizeable take-profit, coming in at 1909.4.
Across the page on the H4 timeframe, price is showing signs of recovery north of trend line support, extended from the low 1668.0. In order to help confirm upside on this scale, taking out Monday’s high at 1765.3 is needed.
Areas of consideration:
Testing H4 trend line support, based on the H4 timeframe, would likely interest buyers in this market, having seen daily price crack through the upper edge of a pennant pattern and weekly price attempting to regain a footing above 1739.6. Owing to trend lines being prone to fakeouts, traders may seek additional H4 candlestick confirmation before pulling the trigger.
The accuracy, completeness and timeliness of the information contained on this site cannot be guaranteed. IC Markets does not warranty, guarantee or make any representations, or assume any liability regarding financial results based on the use of the information in the site.
News, views, opinions, recommendations and other information obtained from sources outside of www.icmarkets.com.au, used in this site are believed to be reliable, but we cannot guarantee their accuracy or completeness. All such information is subject to change at any time without notice. IC Markets assumes no responsibility for the content of any linked site.
The fact that such links may exist does not indicate approval or endorsement of any material contained on any linked site. IC Markets is not liable for any harm caused by the transmission, through accessing the services or information on this site, of a computer virus, or other computer code or programming device that might be used to access, delete, damage, disable, disrupt or otherwise impede in any manner, the operation of the site or of any user’s software, hardware, data or property.


