
EUR/USD:
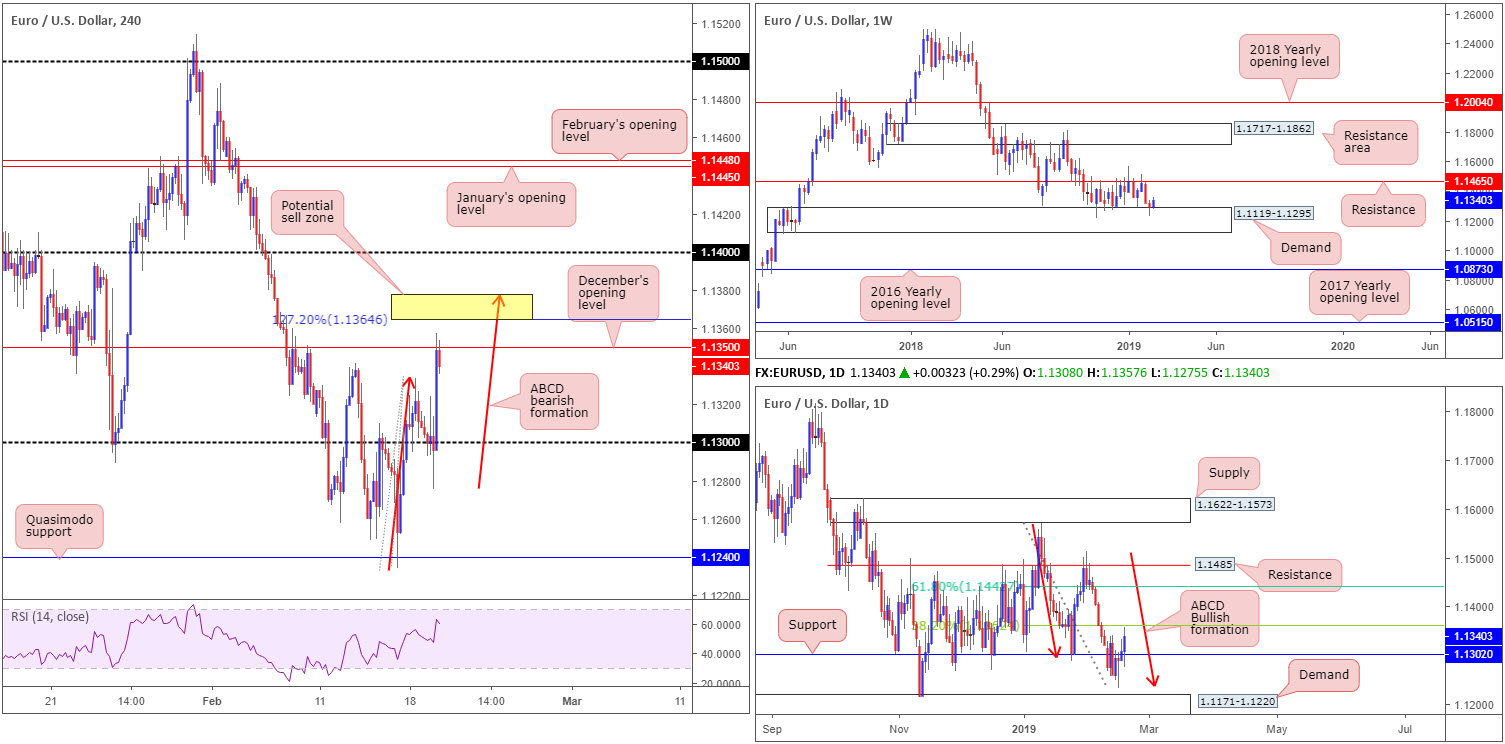
Broad-based USD selling along with an advancing GBP/USD market reinforced EUR/USD bulls Tuesday. Despite a robust move sub 1.13 mid-ways through London on the H4 timeframe, likely tripping stop-loss orders, the candles reclaimed the round number and in one fell swoop reached December’s opening level at 1.1350, which, as you can see, is holding ground as resistance. Directly above this barrier, it may also interest traders a 127.2% ABCD (red arrows) pattern exists around 1.1364, followed by the 1.14 handle.
In terms of economic data Tuesday, the ZEW Indicator of Economic Sentiment for Germany recorded an increase of 1.6 points in February 2019, and now stands at minus 13.4 points. Although the indicator improved slightly, it is still in negative territory and remains well below the long-term average of 22.4 points (zew.de). The report gave fresh impetus to the EUR/USD at 10 am London, bouncing from 1.13 to a high of 1.1314, before declining lower.
Broader analysis reveals the weekly candles are countering the top edge of demand coming in at 1.1119-1.1295: the lower edge of the current weekly range since late October 2018. Lower down on the curve, daily price, after Friday’s movement shook hands with an ABCD bullish completion point (red arrows) around 1.1240 and engulfed resistance at 1.1302 (now acting support) Monday, came within striking distance of testing a 38.2% Fibonacci resistance value at 1.1362 in recent trade. This is actually the first take-profit target for many traders long the daily ABCD formation, and is also a potential sell zone on the H4 at the 127.2% ABCD (red arrows) around 1.1377/1.1364.
Areas of consideration:
The yellow zone marked on the H4 timeframe at 1.1377/1.1364 is certainly worthy of the watchlist today for possible sells, given its close connection with a daily 38.2% Fibonacci resistance value at 1.1362. The only grumble is weekly price threatening higher prices from demand mentioned above at 1.1119-1.1295. For that reason, waiting for additional H4 candlestick confirmation to form before pulling the sell trigger is advised (entry/stop parameters can be set according to candlestick structure). Ultimately, though, the research team expects at least a retest of 1.13 out of 1.1377/1.1364, which happens to also represent daily support at 1.1302.
Today’s data points: FOMC Meeting Minutes.
GBP/USD:
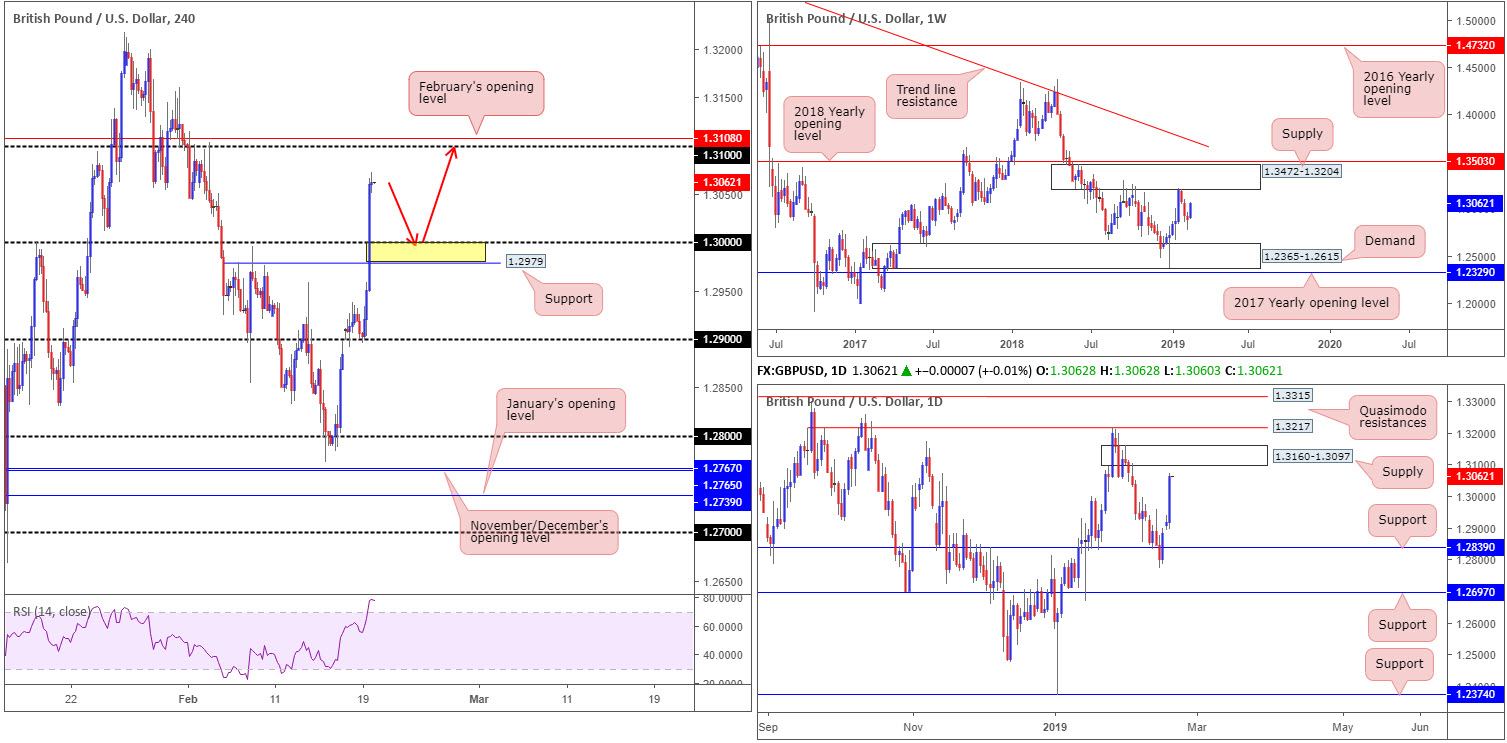
Cable, as you can see, strongly extended its recovery gains Tuesday, eclipsing key figure 1.30 on the H4 timeframe and reaching highs of 1.3073. Aside from UK job’s data, which was largely overlooked, a combination of renewed Brexit hopes and a waning greenback were the main drivers behind yesterday’s upsurge.
To the upside on the H4 timeframe, the 1.31 handle and February’s opening level at 1.3108 are the next levels of resistance in the firing range. Structure on the daily timeframe reveals a supply zone at 1.3160-1.3097 eclipses the aforesaid H4 barriers. Therefore, 1.31 is likely a level sellers inhabit.
The weekly timeframe, on the other hand, shows room to extend beyond the noted daily and H4 structures towards supply coming in at 1.3472-1.3204.
Areas of consideration:
With all three timeframes exhibiting a bullish vibe this morning, key figure 1.30 is of interest, as is nearby H4 support at 1.2979. A retest of this area (yellow – red arrows), preferably before the unit tests 1.31, offers a reasonably high-probability level of support to work with. For conservative traders wishing to add additional confirmation to the mix out of 1.2979/1.30, waiting for a H4 bullish candlestick to form is an option. Another alternative is drilling down to the lower timeframes and searching for a resistance-turned support setup to trade that’s validated by way of a bullish candlestick configuration on the retest.
Both methods of confirmation provide entry and stop levels, with an ultimate upside target placed at 1.31.
Today’s data points: FOMC Meeting Minutes.
AUD/USD:
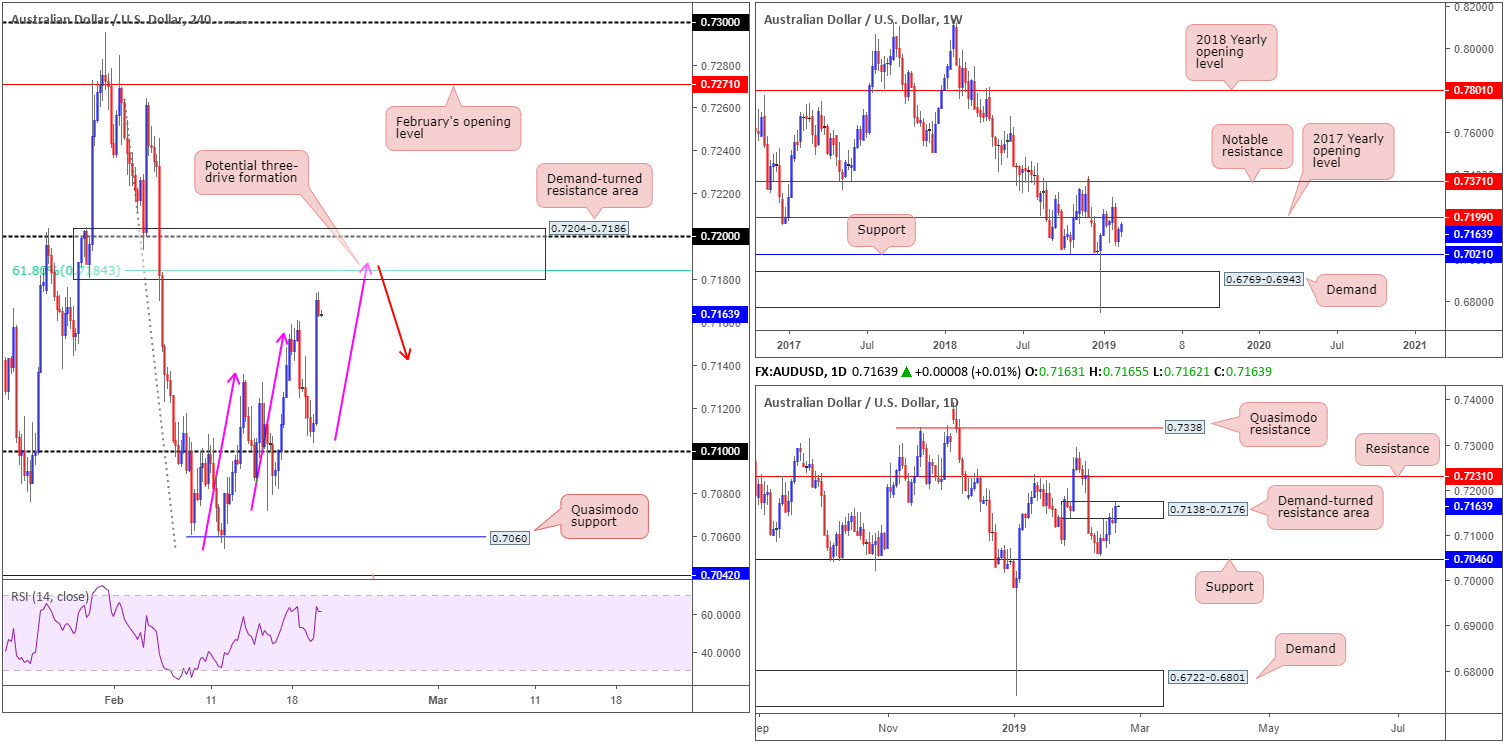
In the early hours of Tuesday’s segment, the Reserve Bank of Australia (RBA) in its February meeting minutes announced members agreed there was not a strong case for a near-term adjustment in monetary policy. This sent the AUD/USD lower, setting the intraday tone for Asia. It was not until US traders opened their doors for business did the market observe a rotation higher.
Leaving the 0.71 handle on the H4 timeframe unchallenged, the commodity-linked currency gravitated higher vs. its US peer, shattering the session high for the day at 0.7160 and clocking a peak of 0.7173. What’s notable on the H4 timeframe, from a technical standpoint, is the demand-turned resistance area at 0.7204-0.7186, which holds within it a 61.8% H4 Fibonacci resistance value at 0.7184 and the 0.72 handle. In addition to this, a three-drive formation (pink arrows) visibly completes around 0.7187. It might also be worth noting the H4 RSI indicator is seen fast approaching its overbought value.
Another factor in favour of the aforesaid H4 zone is the weekly timeframe’s 2017 yearly opening level residing around the 0.7199 region. Daily structure, however, shows price trading within the upper band of a demand-turned resistance zone at 0.7138-0.7176. A break above this area has resistance at 0.7231 to target, which is positioned beyond the current H4 demand-turned resistance zone.
Areas of consideration:
A selloff from the H4 demand-turned resistance area at 0.7204-0.7186 is high probability today, in view of its surrounding confluence. With stop-loss orders tucked above 0.7204, we could be looking at a run towards yesterday’s lows of 0.7103 as an initial take-profit target.
Today’s data points: FOMC Meeting Minutes.
USD/JPY:
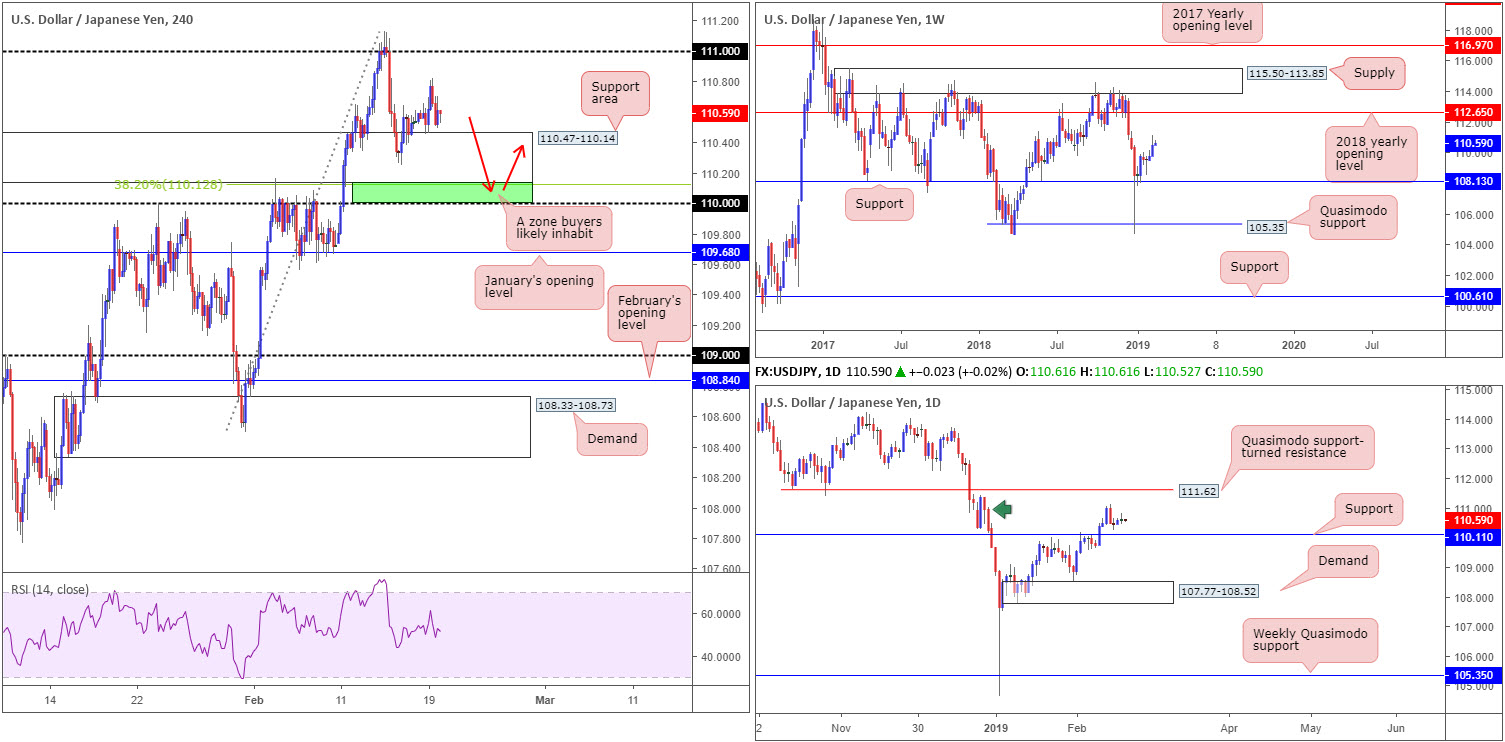
The USD/JPY, despite a sizeable USD decline across the board, continued to reflect an indecisive stance Tuesday around the top edge of a rather large H4 support area coming in at 110.47-110.14. The buck went back to playing on the defensive as US Treasury yields extended declines, with the 10-year note shaking hands with its lowest level in a week.
As a result of recent movement, much of the following piece will echo thoughts put forward in yesterday’s briefing.
Beginning from the top this morning, we can see USD/JPY bulls went on the offensive last week, achieving highs at 111.12. As long as the unit remains above support drawn from 108.13, upside on this timeframe is relatively free until connecting with its 2018 yearly opening level at 112.65.
Following Thursday’s strong bearish rotation candle on the daily timeframe, the market has generated little follow-through movement. Surrounding structure consists of a supply area at 111.40-110.27 (green arrow), a support level coming in at 110.10 and a Quasimodo support-turned resistance at 111.62. The aforementioned support level will likely enter the fold sometime this week, which we believe will hold ground given where we’re trading on the weekly timeframe. This may eventually run stops above the current supply and bring in sellers from 111.62.
Beneath the current H4 support zone highlighted above, traders may also want to pencil in daily support mentioned above at 110.11, shadowed closely by the 110 handle. Both levels boast relatively strong history, with the daily barrier positioned close by a 38.2% H4 Fibonacci support value at 110.12.
Areas of consideration:
Having observed weekly action poised to attack higher levels this week, as well as daily support plotted nearby, the green zone marked on the H4 timeframe between 110/110.12 (the round number 110, the daily support at 110.11 and the 38.2% H4 Fibonacci support at 110.12) remains worthy of the watchlist today/this week. The only caveat, nevertheless, is the possibility of a stop run materialising through 110 (common viewing around psychological numbers) before an advance is seen. To help avoid being stung, waiting for additional H4 candlestick confirmation to form out of the zone is an idea (entry/stop levels can be defined according to the candlestick’s rules of engagement).
Today’s data points: FOMC Meeting Minutes.
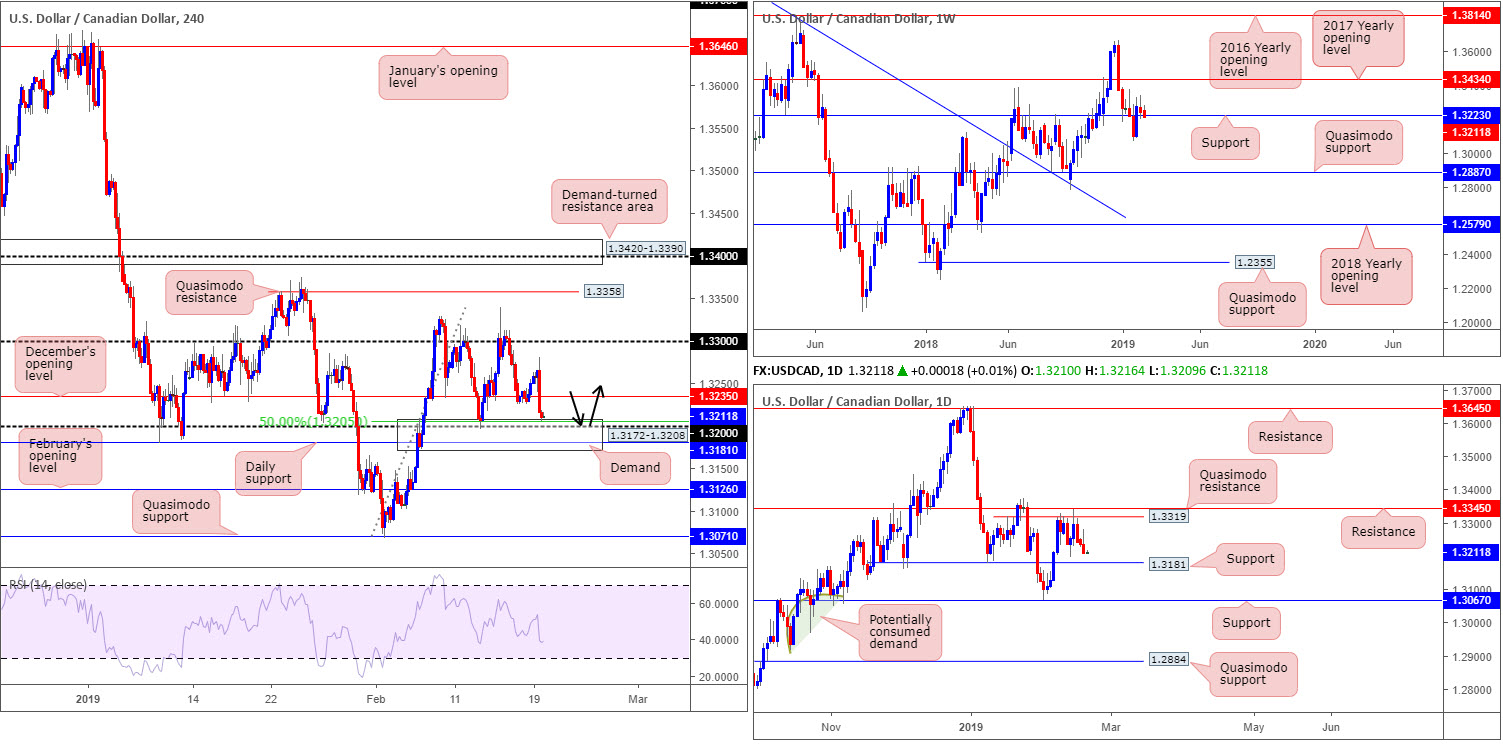
USD/CAD:
As is evident from the H4 timeframe this morning, demand at 1.3172-1.3208 elbowed its way into the spotlight in recent hours after price action overthrew December’s opening level at 1.3235 nearby. Note this area merges with the 1.32 handle and a 50.0% H4 support value at 1.3205, as well as a daily support level at 1.3181. It might also interest some traders to note weekly flow is seen challenging support around the 1.3223 neighbourhood.
Areas of consideration:
The H4 demand area mentioned above at 1.3172-1.3208 remains of interest for a potential long play, having noted its surrounding confluence (see above). With stop-loss orders set beneath 1.3172, traders have the option of entering long at current price or waiting and seeing if the candles drill lower into the said H4 demand and test daily support mentioned above at 1.3181. A long from this region will, of course, offer traders more favourable risk/reward conditions.
Irrespective of the entry point, buyers will likely be looking for a H4 close to formulate above December’s opening level before reducing risk to breakeven. Ultimately, to secure reasonable risk/reward, however, the underside of 1.33 stands as a logical (initial) take-profit target.
Today’s data points: FOMC Meeting Minutes.
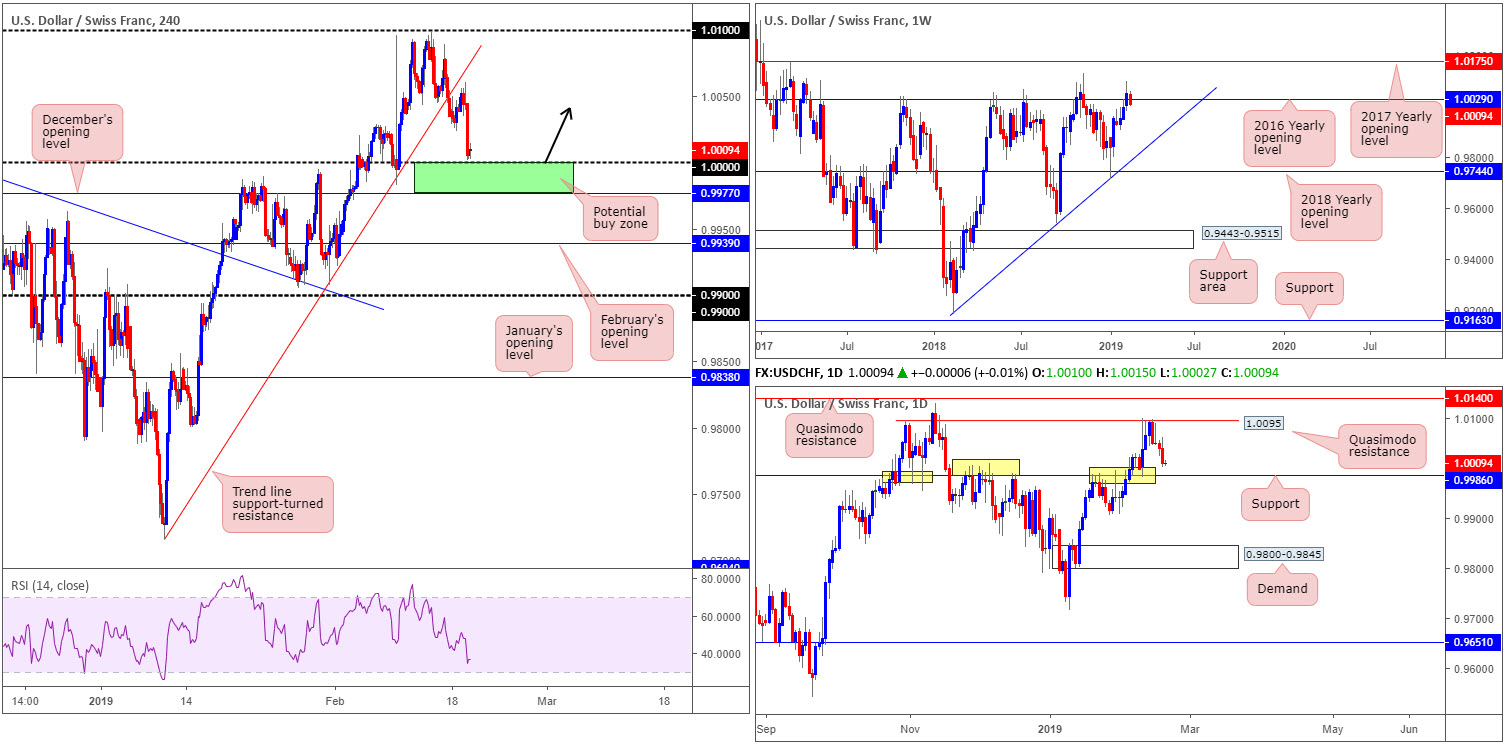
USD/CHF:
Weighed on by a fading greenback, Tuesday’s session witnessed the USD/CHF extend its downside presence to lows at 1.0001. Directly beneath here, 1.0000 (parity) is visible on the H4 timeframe followed closely by December’s opening level at 0.9977 (green zone). In between 0.9977 and 1.0000, traders may want to acknowledge long-standing daily resistance/support at 0.9986.
While 0.9977/1.0000 may be a tempting location to consider buying this market from, traders are urged to take into account weekly price trading beneath its 2016 yearly opening level at 1.0029. The barrier’s history as a resistance is certainly not to be overlooked.
Areas of consideration:
The combination of daily support mentioned above at 0.9986, December’s opening level at 0.9977 and 1.0000, offers a robust support area to keep an eye on today (stop-loss orders can be planted below December’s opening level at 0.9977). In regards to an initial upside target from here, 1.0050 appears a reasonably logical starting point.
For traders interested in longs from 0.9977/1.0000 today, though at the same time feel somewhat exposed here by the potential threat of weekly sellers residing above, consider waiting and seeing if H4 price chalks up a notable bullish candlestick formation before pulling the trigger. That way, not only do you have an alternate structure to base entry and stop levels from, the candle pattern also offers a visual clue buyers are interested in the zone and may take things higher.
Today’s data points: FOMC Meeting Minutes.
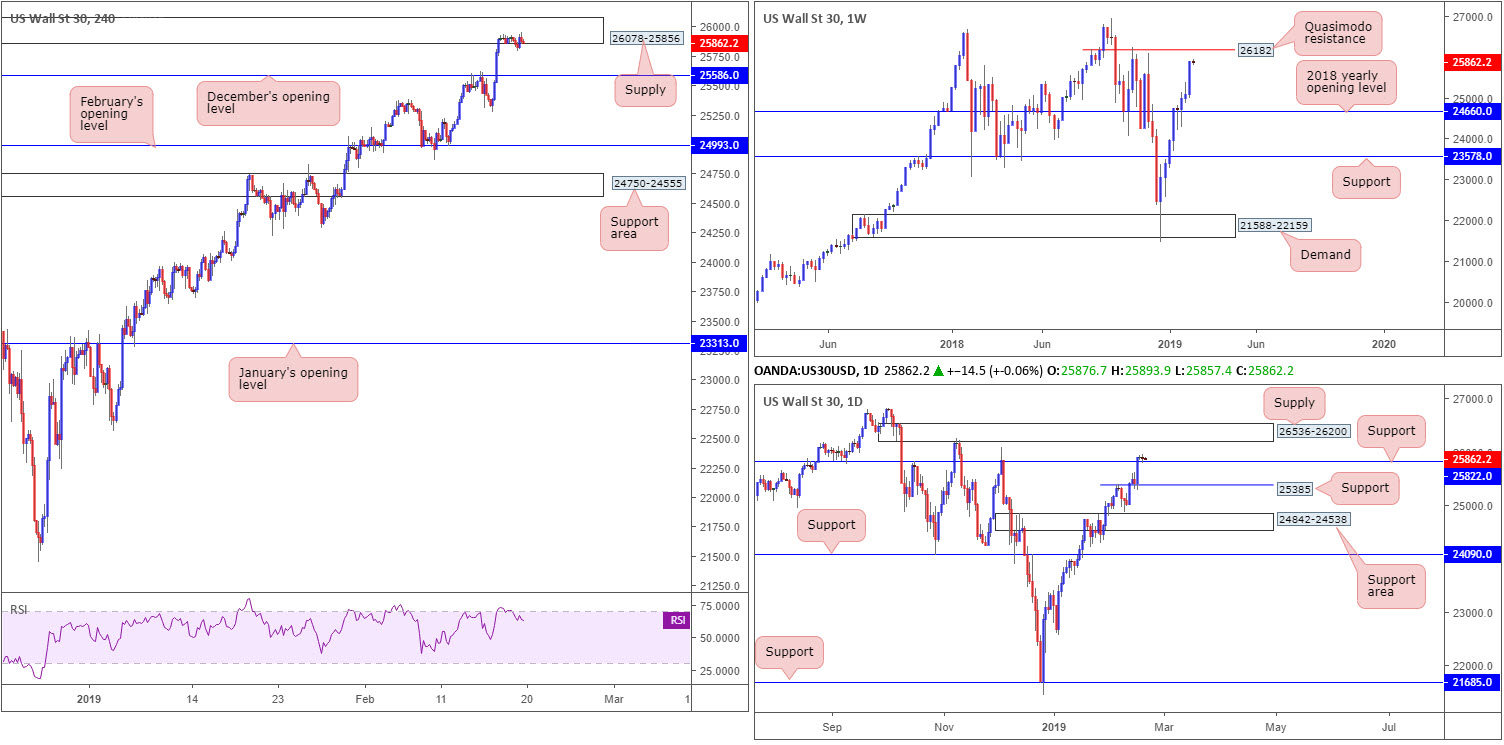
Dow Jones Industrial Average:
As the markets look to shake off the long weekend in the US, Wall Street was a mixed bag Tuesday as traders await fresh impetus from today’s FOMC meeting. As a result of this, the research team’s outlook remains unchanged going into today’s segment…
Since clearing and retesting the 2018 yearly opening level at 24660 as support on the weekly timeframe, the Dow Jones Industrial Average, in the shape of a near-full-bodied bull candle, reflects a strong bullish stance, up 800 points last week. Further buying this week has Quasimodo resistance at 26182 to target.
Recent trade also observed the daily candles establish support off 25385 (broken high-turned support) and marginally close above 25822. In the event this level holds firm as support this week, upside appears reasonably free until connecting with supply at 26536-26200 (sited just north of the weekly Quasimodo resistance).
Trade optimism provided fresh impetus Friday, pulling the candles beyond December’s opening level at 25586 into the walls of a H4 supply zone coming in at 26078-25856, where price remained Monday and Tuesday by way of a tight consolidation. Note this supply is positioned directly beneath daily supply mentioned above at 26536-26200.
Areas of consideration:
Although US equities trade with a strong upside bias, notable resistance is on the horizon. We have Quasimodo resistance out of the weekly timeframe at 26182, which is sited just beneath daily supply at 26536-26200, though is positioned above H4 supply at 26078-25856. Therefore, taking a long position in this market is difficult, according to our technical studies.
As for selling this week, the research team notes to wait and see if the unit connects with the weekly Quasimodo resistance 26182. Bringing in weekly sellers from here, and also daily sellers from nearby supply at 26536-26200, is likely enough to draw in sellers for a bounce lower. For conservative traders concerned about trading countertrend, waiting for a H4 bearish candlestick formation to print off 26182 is an option. This not only helps decipher whether sellers are active or not, it also provides entry/stop parameters to work with.
Today’s data points: FOMC Meeting Minutes.
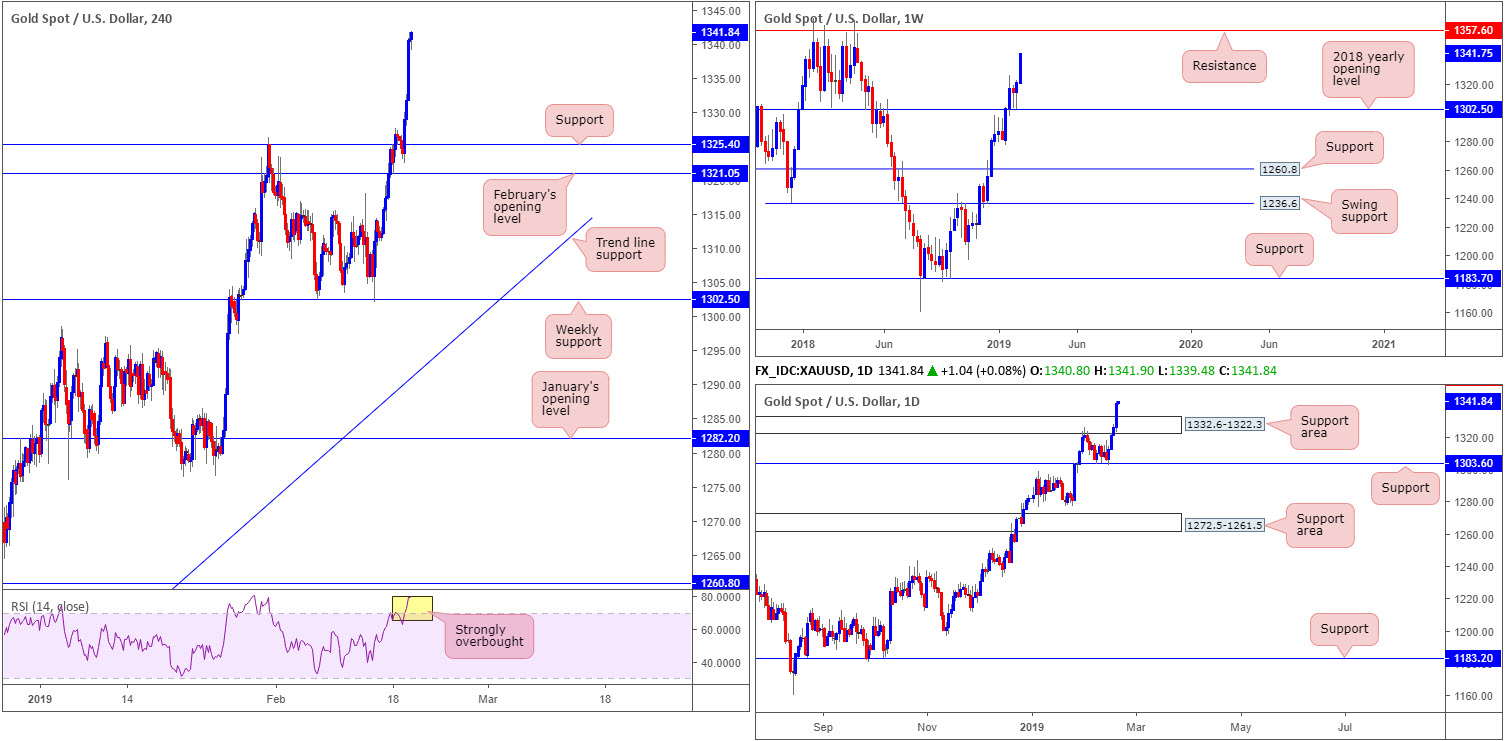
XAU/USD (GOLD):
Having observed US Treasury yields explore lower levels and the US dollar index establish firm ground sub 97.00, it should not come as a surprise to see the yellow metal gathered steam Tuesday, reaching highs not seen since April 2018 at 1341.8.
Recent buying on the weekly timeframe, as you can see, has positioned the unit within shouting distance of notable resistance coming in at 1357.6. By the same token on the daily timeframe, yesterday’s movement conquered nearby supply fixed at 1332.6-1322.3, and has potentially cleared the runway north towards resistance at 1356.8 (not seen on the screen).
A closer reading shows the H4 candles retested 1325.4, albeit a little deeper than expected, and advanced higher. The next upside objective on this scale falls in around a Quasimodo resistance level at 1350.7 (not seen on the screen). Well done to any of our readers who managed to pin down something off 1325.4 yesterday as this was a noted barrier in Tuesday’s briefing. In addition, for any of our readers who remain long from the weekly support at 1302.5, great work. You’ve effectively hopped aboard a runaway train!
Areas of consideration:
Should the H4 candles fail to pullback before testing 1357.6/1350.7 (comprised of the weekly resistance level at 1357.6, the daily resistance at 1356.8 and the H4 Quasimodo resistance at 1350.7), attention turns to a possible countertrend trade out of this zone.
The accuracy, completeness and timeliness of the information contained on this site cannot be guaranteed. IC Markets does not warranty, guarantee or make any representations, or assume any liability with regard to financial results based on the use of the information in the site.
News, views, opinions, recommendations and other information obtained from sources outside of www.icmarkets.com.au, used in this site are believed to be reliable, but we cannot guarantee their accuracy or completeness. All such information is subject to change at any time without notice. IC Markets assumes no responsibility for the content of any linked site. The fact that such links may exist does not indicate approval or endorsement of any material contained on any linked site.
IC Markets is not liable for any harm caused by the transmission, through accessing the services or information on this site, of a computer virus, or other computer code or programming device that might be used to access, delete, damage, disable, disrupt or otherwise impede in any manner, the operation of the site or of any user’s software, hardware, data or property.


