
Lower timeframe confirmation: simply means waiting for price action on the lower timeframes to confirm direction within a higher timeframe area. For example, some traders will not enter a trade until an opposing supply or demand area has been consumed, while on the other hand, another group of traders may only need a trendline break to confirm direction. As you can probably imagine, the list is endless. We, however, personally prefer to use the two methods of confirmation mentioned above in our trading.
EUR/USD:
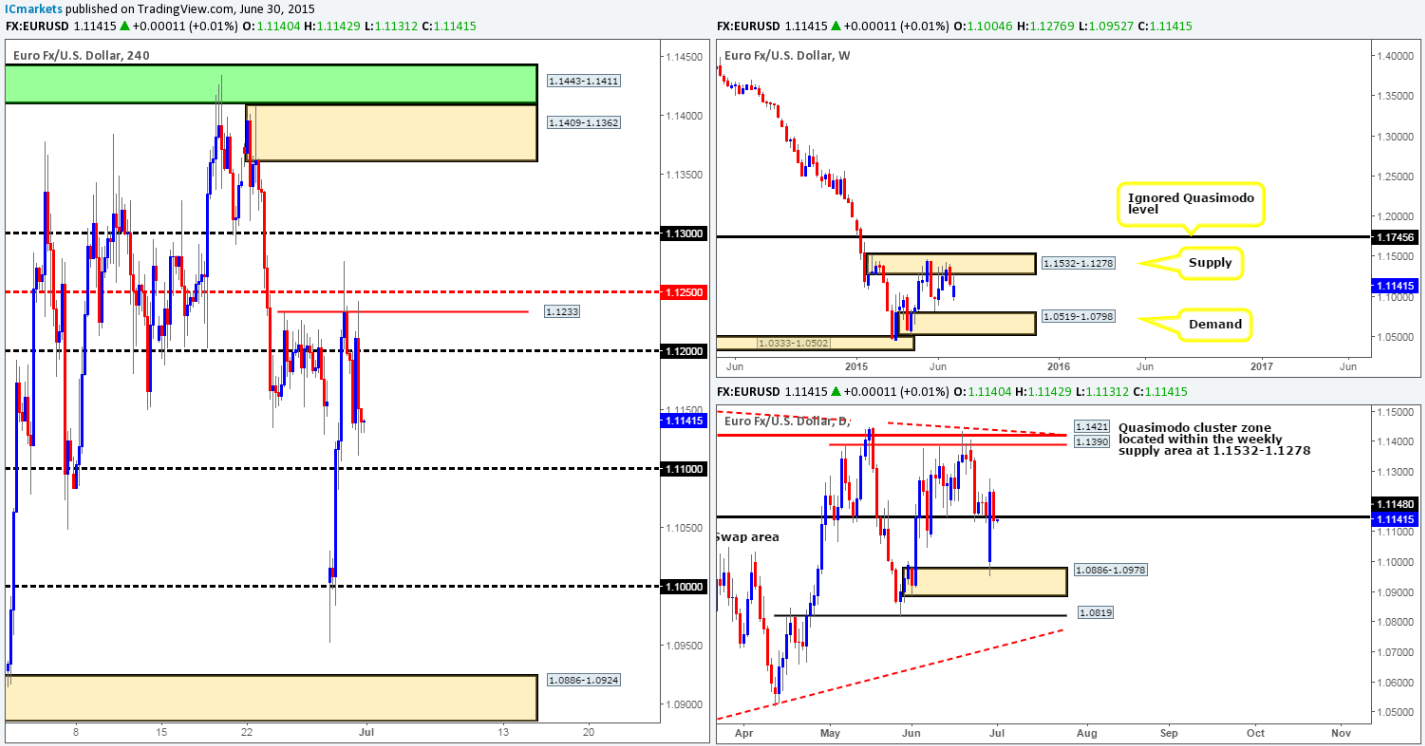
Recent events on the EUR show that offers remained strong around the 1.1233 mark yesterday, resulting in price driving south to fresh session lows at 1.1111 going into the London close. This decline likely stems from the latest headlines out of Greece who are set to default on their 1.6 billion Euro debt to the IMF at midnight GMT (current time is 21.28 GMT).
Higher timeframes reveal that price is currently trading off of a weekly supply area coming in at 1.1532-1.1278, which as you can see, forced price to close below a daily swap level at 1.1148, thus projecting a somewhat bearish tone going into today’s sessions. However, selling this market is considered a risky trade on the 4hr timeframe due to potentially strong bids looming just below at 1.1100. A more conservative approach here would be to wait for price to close below 1.1100, and enter only if price retests this barrier as resistance and shows some sort of lower timeframe selling signal.
Under normal market conditions, this would be something we’d consider trading. However, with the Greek uncertainty set to continue, our team has come to a consensus that remaining flat on this pair during this unpredictable environment is the best position to take.
Levels to watch/live orders:
- Buys: Flat (Stop loss: N/A).
- Sells: Flat (Stop loss: N/A).
GBP/USD:
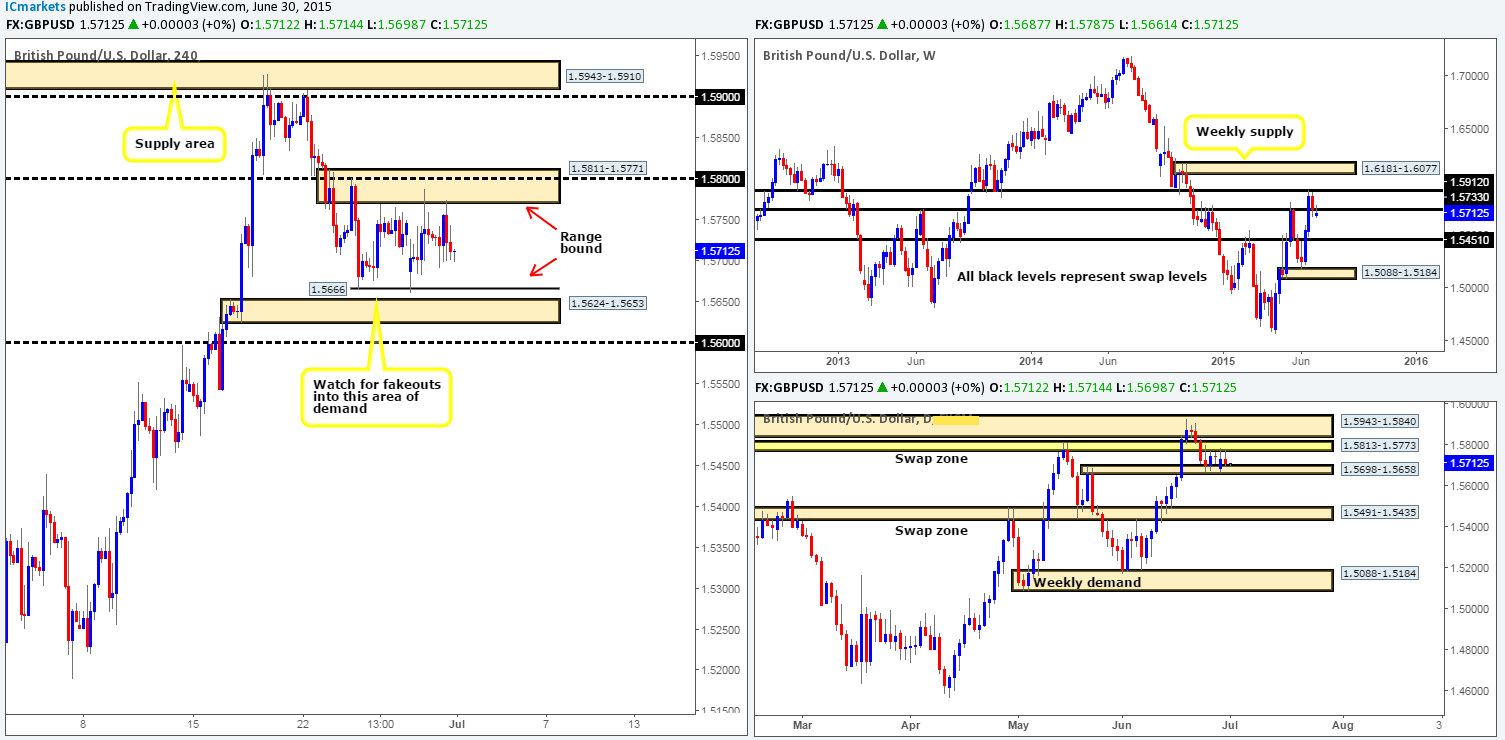
Unlike the Euro’s recent volatility, Cable has entered into a clear phase of consolidation between 1.5666 (the June 24th low), and 1.5811-1.5771/1.5800 (a combined 4hr supply/round number area). From looking at the daily picture, we can see that this range is encompassed by two daily swap areas. The upper zone falls in at 1.5813-1.5773, and the lower is seen at 1.5698-1.5658.
It is only when looking at the weekly timeframe can we see any true direction in our opinion, as price is currently seen nibbling at the underside of a weekly swap level at 1.5733, which incidentally shows plenty of room to move south. Therefore, with this in mind, a breakout lower of the 4hr/daily range is far more likely than a push higher.
Given the points made above, one could potentially look for trades at the extremes of the current 4hr consolidation area in today’s sessions. Nevertheless, fakeouts are a common occurrence within ranging environments such as this, and as such, we would strongly recommend only trading when there is clear confirmation coming from the lower timeframes (tentative buys are seen at 1.5671, while sells come in around the 1.5765 mark).
Levels to watch/ live orders:
- Buys: 1.5671 [Tentative – confirmation required] (Stop loss: dependent on where one confirms this level).
- Sells: 1.5765 [Tentative – confirmation required] (Stop loss: 1.5818).
AUD/USD:
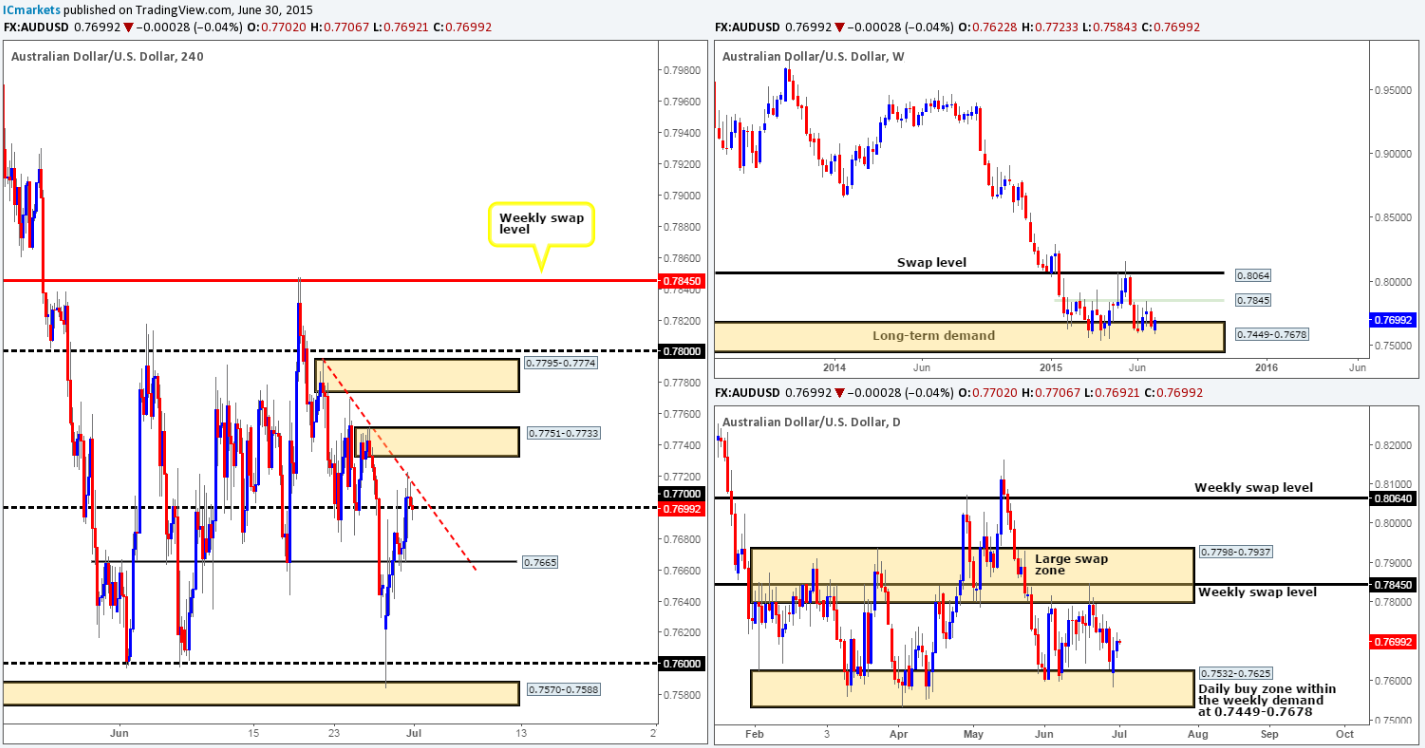
For those who read our previous report, you may recall that we mentioned to watch for confirmed buys around a 4hr swap level coming in at 0.7665, and look to target the 4hr downtrend line taken from the high 0.7795 as your first take-profit zone. As you can see, price did indeed rally from here and has hit its first target already. Unfortunately, we were not at our desks when price gave the signal to buy. Well done to anyone who managed to get in on this one! If we were in this trade, stops would certainly be at breakeven now, and 50% of our position would be locked in.
The reaction from the 4hr downtrend line has been slightly more aggressive than we anticipated. And as a result of this, we’re hoping to see strong bids come in and defend the round number just below it at 0.7700, since this will likely attract further buying today and push this market above the 4hr downtrend line up to the final take-profit target – 4hr supply at 0.7751-0.7733 (mentioned in yesterday’s analysis).
Supporting a further push north, we can see that the weekly picture shows price sitting firmly within demand at 0.7449-0.7678, and price currently trading mid-range on the daily timeframe (0.7532-0.7625 – daily buy zone, 0.7798-0.7937 – daily swap area), so with a little bit of luck, the final take-profit target will be hit today.
For those not in on this trade, like us, there could be a potential intraday buying opportunity off of 0.7700 today. Assuming that this level holds, and the lower timeframes shows some sort of confirming bull action, we would likely take a long trade from here up to the aforementioned 4hr supply area.
Levels to watch/ live orders:
- Buys: 0.7700 region [Tentative – confirmation required] (Stop loss: dependent on where one confirms this level).
- Sells: Flat (Stop loss: N/A).
USD/JPY:
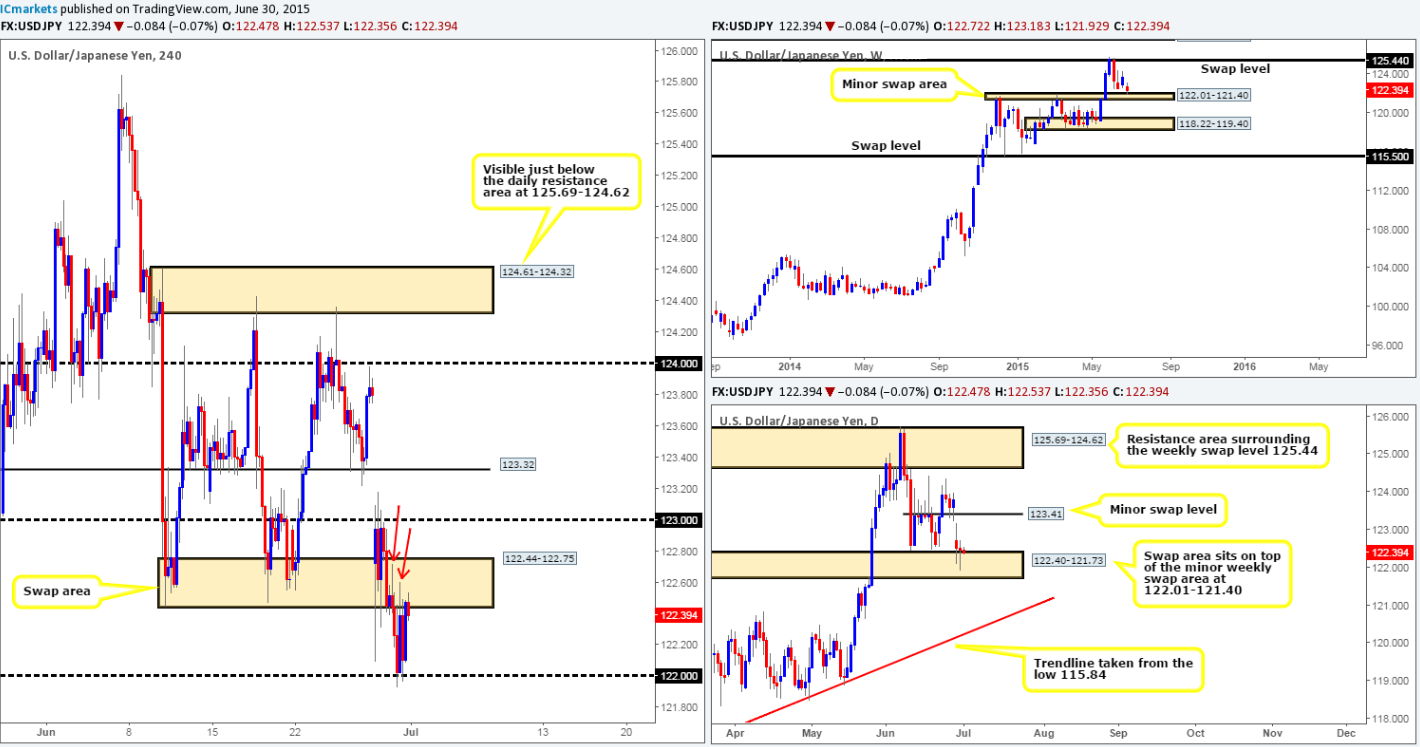
During the course of yesterday’s trade the USD/JPY pair continued to sell off, which in turn saw price shake hands with the round number 122.00 going into the London session. This number was a level of interest to us, as explained in our previous analysis here: http://www.icmarkets.com/blog/tuesday-30th-june-daily-technical-outlook-and-review/
As price attacked the 122.00 barrier, our team managed to find a lower timeframe (confirmed) entry on the 1 minute chart at 121.98 yesterday. As this is such a small timeframe, we gave the position a lot of breathing room and placed our stop according to the 4hr timeframe at 121.40, just below the 4hr swing low 121.43.
On the grounds that both the weekly (minor swap area at 122.01-121.40) and daily (swap area that sits on top of the weekly swap area at 122.40-121.73) timeframes show price trading in demand at the minute, we feel relatively confident that this pair will appreciate to at least 123.00. At this point, you may be disagreeing, thinking price could be held lower by the 4hr swap area at 122.44-122.75, and you could very well be right! However, we’re seeing consumed supply in this zone – check out the red arrows pointing to highs 122.60/122.71. These wicks tell us that most of the offers have already likely been consumed. As a result, the path north should, as far as we can see, be resistance free up to 123.00, thus giving us confidence to leave our current long position running.
Levels to watch/ live orders:
- Buys: 121.98 [Live] (Stop loss: 121.40).
- Sells: Flat (Stop loss: N/A).
USD/CAD:
Recent movement shows that the USD/CAD exploded north during the course of yesterday’s sessions. This move, as you can see, sliced above a 4hr Quasimodo resistance level at 1.2446 with absolutely no trouble whatsoever, and as a result connected up with another 4hr Quasimodo resistance level at 1.2490, which is seen holding firm at the time of writing.
Considering the fact that price is now trading within a daily supply area at 1.2562-1.2449 that sits ten pips above a weekly swap level at 1.2439, it is likely that either the current 4hr Quasimodo resistance level will see a reversal, or the one just sitting just above it coming in at 1.2537.
Therefore, with all of the above taken into consideration, our primary focus today will be looking for confirmed sell entries around these two Quasimodo resistance levels. We are going to allow quite a wide stop on any entries found, since from a technical perspective, the drop from here could be quite large.
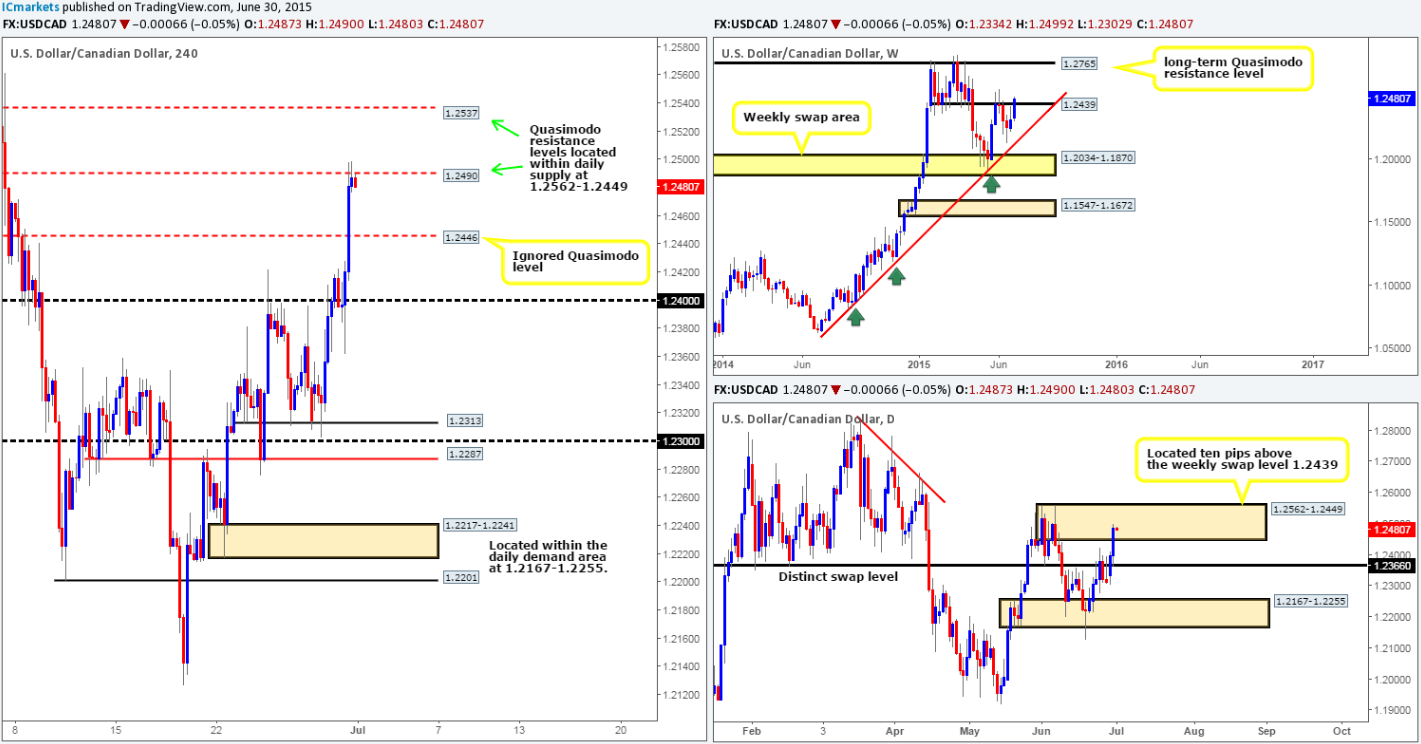
Levels to watch/ live orders:
- Buys: Flat (Stop loss: N/A).
- Sells: 1.2490/1.2537 [Tentative – confirmation required] (Stop loss: dependent on where one finds lower timeframe selling confirmation).
USD/CHF:
Previously, we mentioned that we had no interest in buying at the 4hr swap zone seen at 0.9259-0.9234, due to no obvious higher timeframe support backing this area. Bids within this zone were clearly stronger than we anticipated. Price launched itself north from here yesterday, consequently taking out 0.9300 and thrusting itself into the mid-level number 0.9350.
As per the higher timeframes (see both weekly and daily charts), we do not see any support or resistance currently in play. This makes our life difficult, as without direction from the higher scale, we feel like we’re driving in the dark with no headlights so to speak. Therefore, as directed by our trading plan, we’re only permitted to trade short-term moves today. In the event that 0.9350 continues to display resistive qualities, this may attract further selling going into the more liquid sessions and as a result send price back down to 0.9300. To trade this 50-pip move, however, we’d need to see lower timeframe confirmation before risking capital to this idea.
On the other hand, should price peek above 0.9350, this will likely result in a continuation drive north up to test 0.9400, which if you look at the daily chart, you’ll notice is in the same position as a long-term daily swap level seen at 0.9397. In order for us to be permitted to trade this move , price would need to retest 0.9350 as support, and also show lower timeframe buying strength has entered the market (pin-bar candle, multiple buying tails etc…).
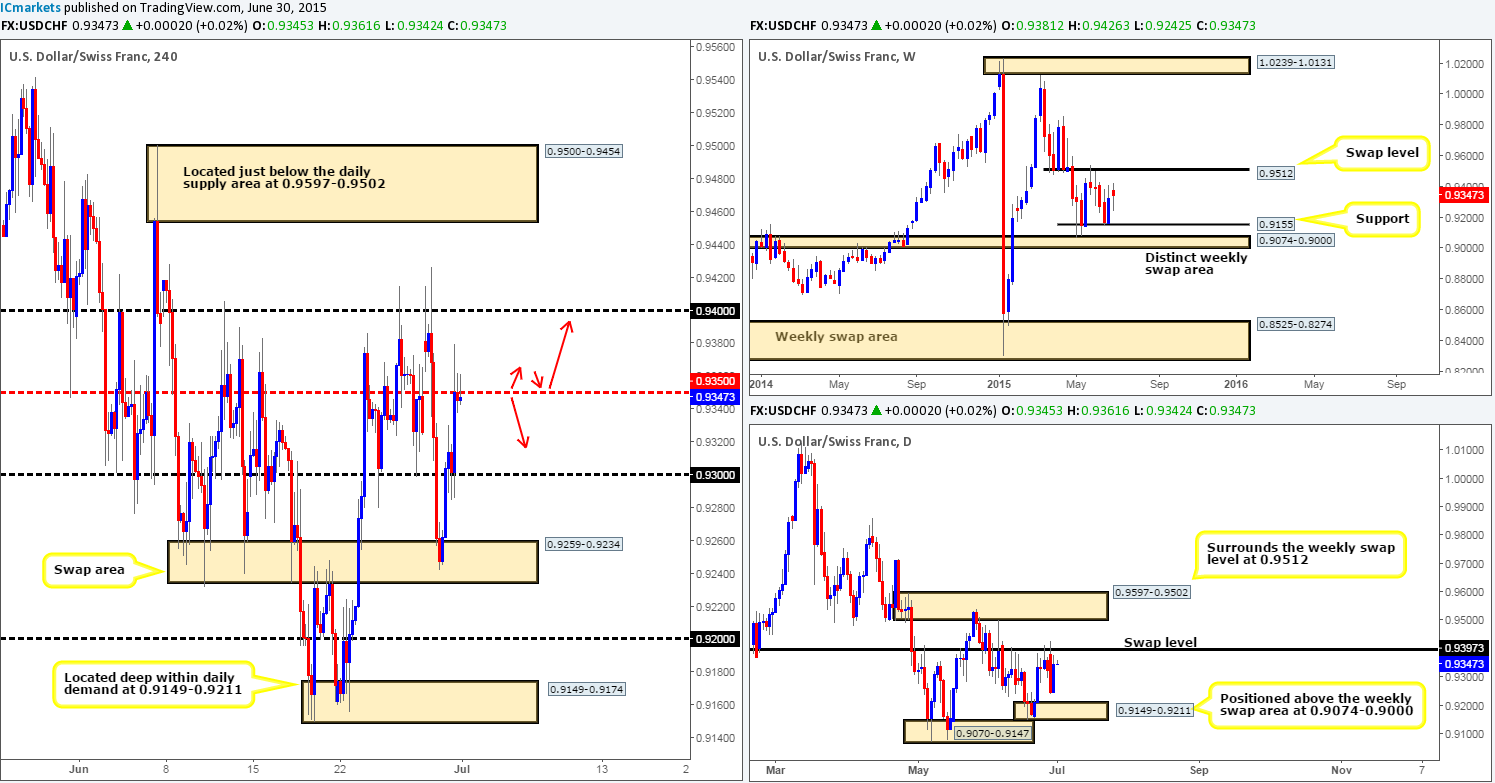
Levels to watch/ live orders:
- Buys: Flat (Stop loss: N/A).
- Sells: 0.9350 [Tentative – confirmation required] (Stop loss: dependent on where one confirms this level).
US 30:
Yesterday’s trade rallied from the weak-looking 4hr demand area at 17615-17659 during the London morning session, which, very similar to Monday’s sessions, reversed as we entered into the U.S session. This reversal saw the DOW tumble, consequently printing fresh lows at 17571, which, as you can see, missed connecting with the top-side of a 4hr demand area at 17514-17565 by only a few points.
Looking at the higher timeframe structures, price is still seen dancing within a daily Quasimodo base area at 17547-17662 at the moment, while the weekly timeframe also shows price is now within touching distance of hitting the weekly swing low 17547. Therefore, we feel that this market has entered into oversold territory now.
Given the points made above in bold, we have decided to place pending buy order at 17570, just above the 4hr demand area at 17514-17565, with a stop set just below at 17502. The reason we’re not waiting for confirmation on this trade is simply because all the ducks are technically lining up from the weekly right down to the 4hr timeframe.
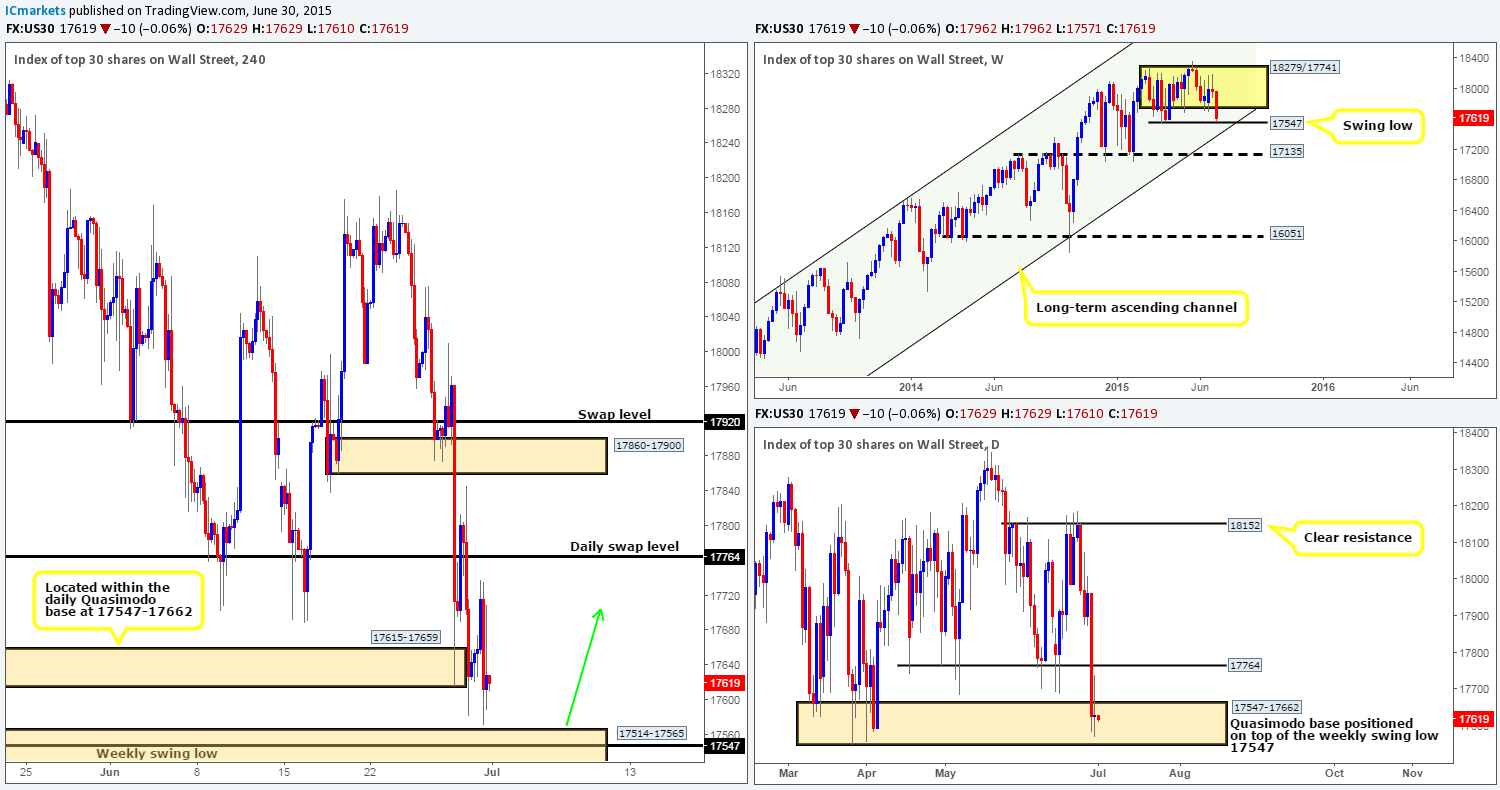
Levels to watch/ live orders:
- Buys: 17570 (Stop loss: 17502).
- Sells: Flat (Stop loss: N/A).
XAU/USD: (Gold)
Yesterday’s trade saw the Gold markets take a tumble, resulting in price crossing swords with a long-term 4hr swap level coming in at 1170.4 (represents the lower limit of the daily buy zone at 1170.3-1184.0). The reaction from this barrier was quite violent as price stabbed lower, and then jabbed higher (see green arrows) thrusting itself into a 4hr swap area coming in at 1180.1-1177.8. Now, seeing as price spiked lower first, presumably to shake out any buyers, we believe that the push higher was simply to consume as many sellers as it possibly could, in an attempt to clear the path north for further upside.
Our rationale behind this idea simply comes from where price is currently located on the higher timeframe picture. The weekly, as you can see, shows price nibbling at the top-side of a weekly demand area at 1142.5-1167.3 (lower limit of the current weekly range), and the daily reveals that price is trading at the extremes of a daily support barrier at 1170.3-1184.0 (positioned just above the aforementioned weekly demand area).
With all of the above taking into account, our attention will mostly be driven toward longs today. In the event that we can find a suitable lower timeframe entry around the 1170.4 region today (pink circle), we’ll look to target the 4hr supply area seen above at 1188.0-1185.5, and potentially beyond this area given the right price action.
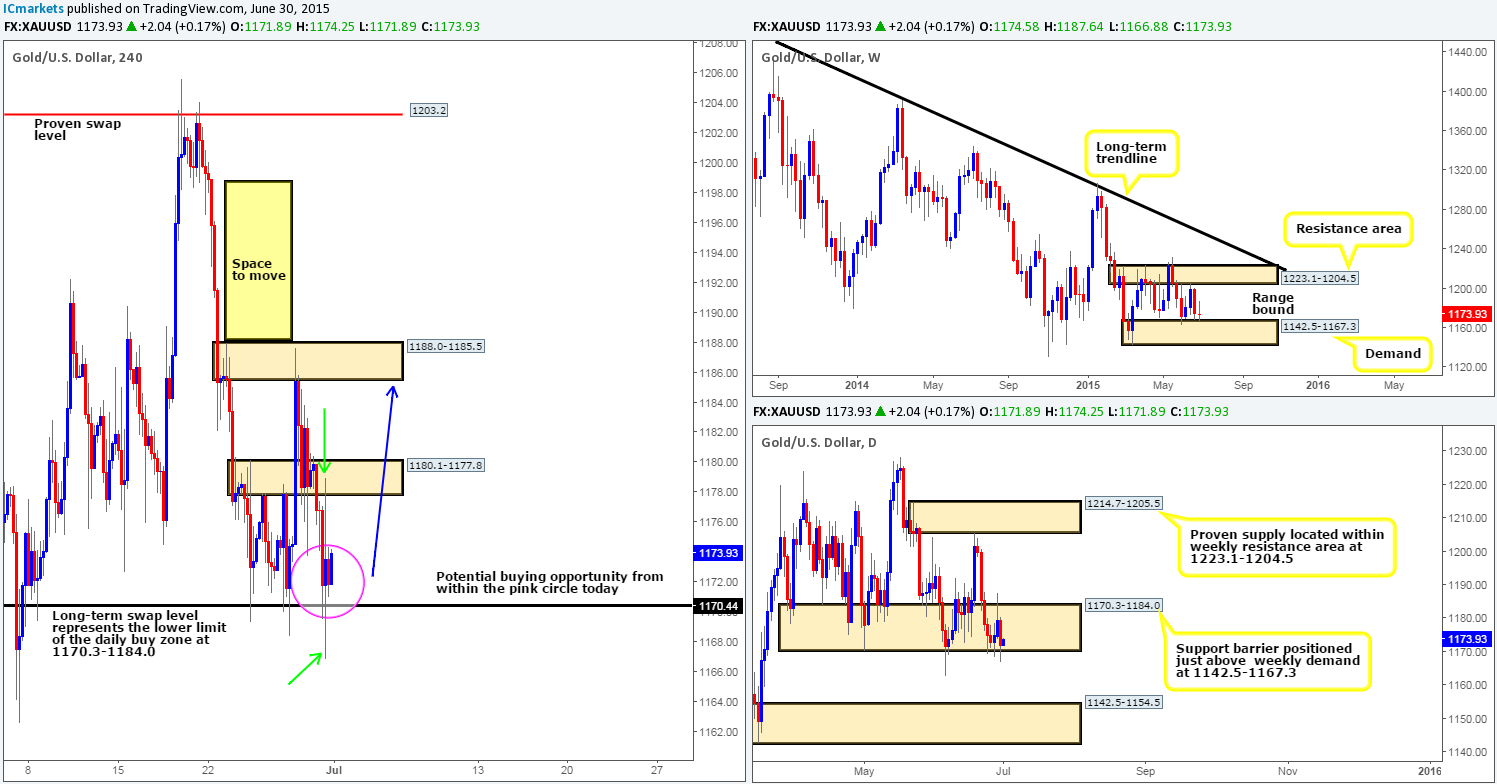
Levels to watch/ live orders:
- Buys: 1170.4 region [Tentative – confirmation required] (Stop loss: Dependent on where one confirms this area).
- Sells: Flat (Stop loss: N/A).


