
EUR/USD:
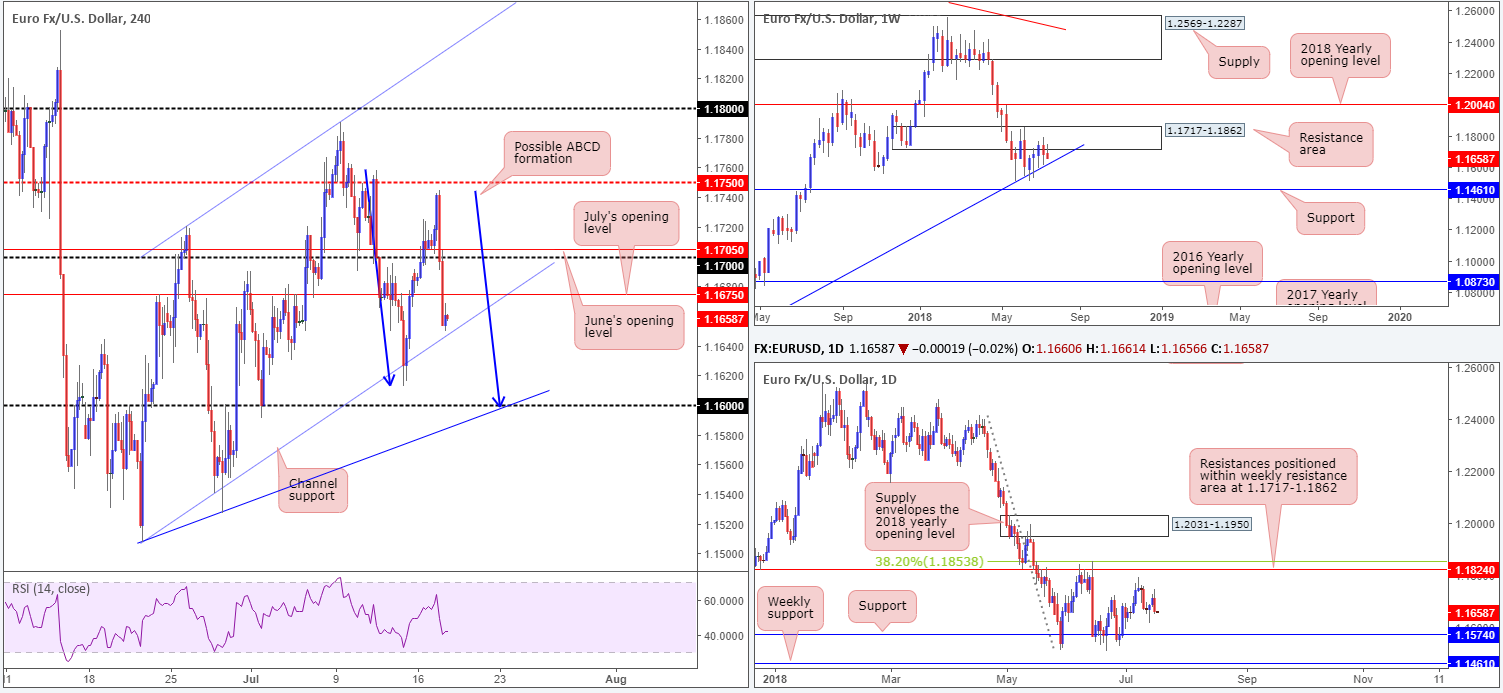
Leaving the H4 mid-level resistance at 1.1750 unchallenged, the single currency came under pressure mid-way through London’s morning session on Tuesday. Further losses were seen in US trade as the USD gathered momentum on Fed Powell’s testimony. A number of H4 technical supports were consumed throughout the sessions, leaving the H4 candles hovering just north of a H4 channel support (extended from the low 1.1508) into the close.
From a technical standpoint, this is what we see top-down:
- Weekly movement is responding to a resistance area plugged in at 1.1717-1.1862, with the latest candle eyeing nearby trend line support (etched from the low 1.0340).
- Daily flows show room to press as far south as support coming in at 1.1574, after printing a clear-cut bearish engulfing candle yesterday.
- While H4 price is seen nearing channel support (highlighted above), recent trade also implies a possible ABCD formation in the midst that terminates around the 1.16 handle (blue arrows).
Areas of consideration:
On the whole, the expectation is for a break of the current H4 channel support. Why? Well, not only are we facing potential selling pressure from the daily bearish engulfing candle, let’s remember there’s room to probe lower on BOTH the weekly and daily timeframes.
On account of the above, the team has underlined 1.16 as a level of interest this morning for longs. Our reasoning comes from the following:
- H4 trend line support (taken from the same low as the H4 channel support) merges with 1.16.
- The weekly trend line support is positioned nearby 1.16 (it actually comes in a little higher around the 1.1620s).
- The (possible) H4 ABCD approach.
- H4 RSI will likely be shaking hands with the oversold value by that point, too.
Owing to 1.16 likely being a watched number by many, however, waiting and seeing if H4 price can chalk up a full or near-full-bodied bull candle before pulling the trigger may be an option. This way, it helps avoid being taken out on any whipsaws seen, which, as most are aware, is common viewing around psychological boundaries to run stop-loss orders.
Today’s data points: EUR Final CPI y/y; US building permits and Housing starts; Fed Chair Powell testifies.
GBP/USD:
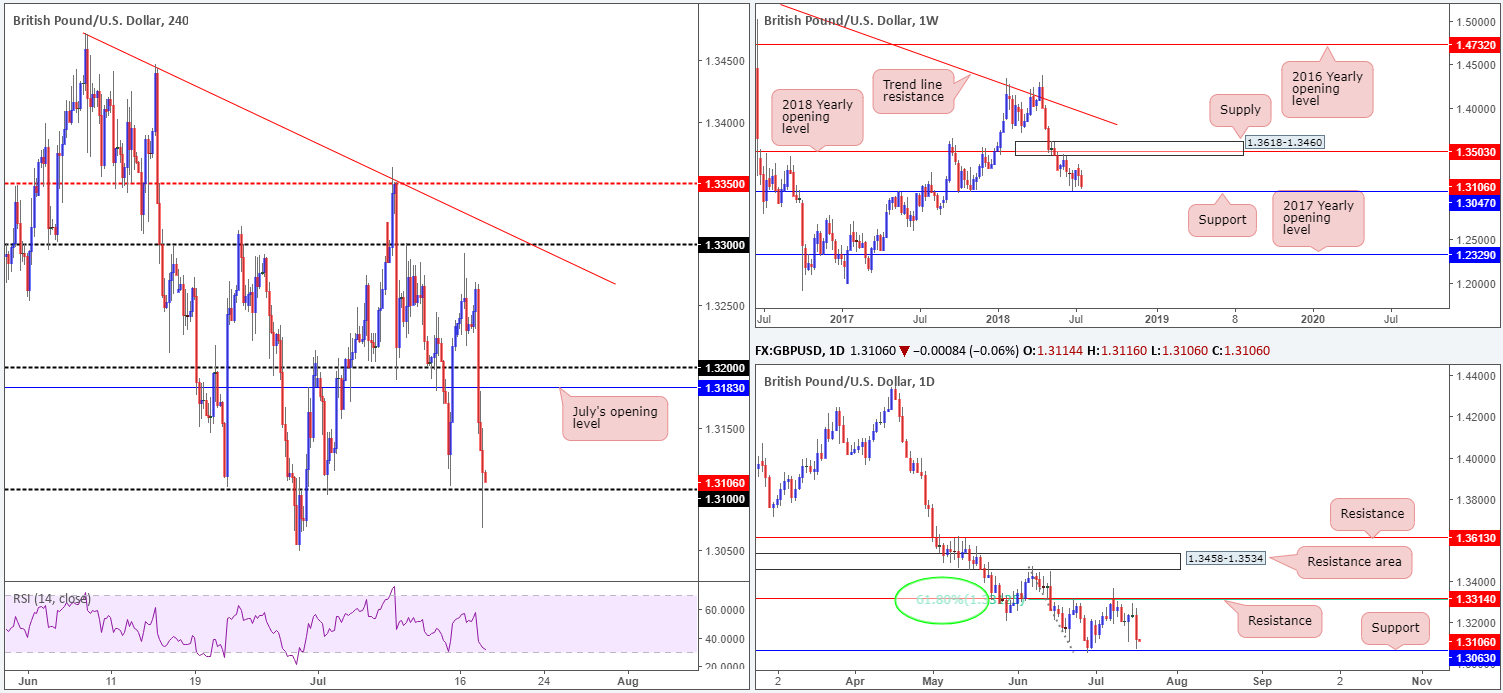
Undermined by negative Brexit headlines, the British pound spun off into a phase of selling amid Tuesday’s sessions. Shedding in excess of 100 pips on the day, the pair gnawed through the 1.32 handle seen on the H4 timeframe and July’s opening level at 1.3183. Amidst Brexit woes, UK employment data, which is generally a market mover, was largely disregarded.
The day concluded with H4 candles whipsawing through 1.31 to lows of 1.3068. No doubt this move flushed out a truckload of stop-loss orders, both from traders looking to fade the number and those attempting to sell the breakout.
Interestingly, though, higher up on the curve, support is in sight:
- Daily support at 1.3063 – a level that boasts strong history.
- Weekly support at 1.3047 – a level that also has a strong background.
Areas of consideration:
Breakout sellers want to exercise caution below 1.31, or at least remain cognizant of the higher-timeframe supports mentioned above. These levels command attention. Don’t make the mistake of ignoring them!
Between 1.3047/1.3063 (the higher-timeframe supports) is an area the market expects a bounce to the upside. For that reason, keep a close eye on how H4 action responds. A reasonably strong rotation candle to the upside from here could offer one an incredible trading opportunity in terms of risk/reward (stops generally positioned below the rejection candle’s tail).
Today’s data points: UK Inflation figures; US building permits and Housing starts; Fed Chair Powell testifies.
AUD/USD:
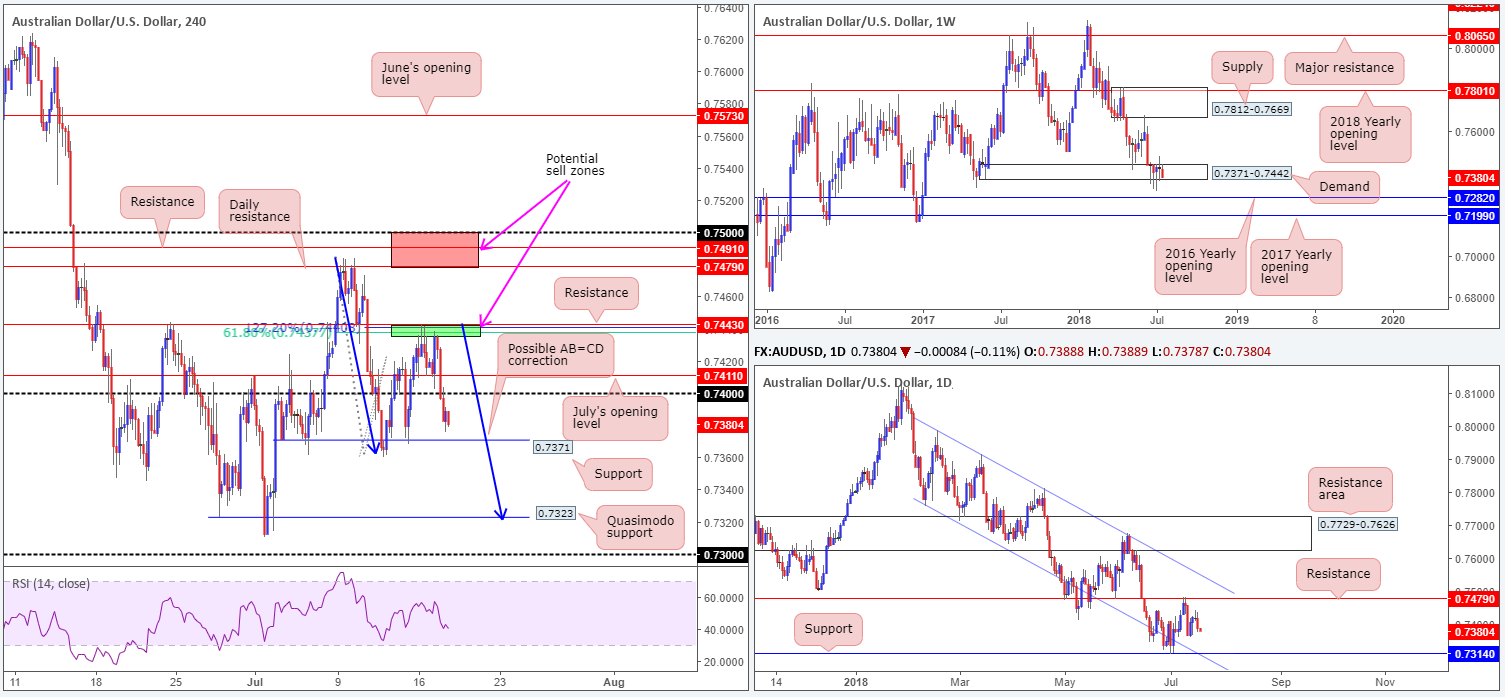
Early hours on Tuesday saw the RBA leaning towards an interest rate hike, but stated only if key economic indicators continue to improve. This lifted the commodity currency off July’s opening level on the H4 timeframe at 0.7411 and retested the underside of our noted green H4 sell zone at 0.7443/0.7437 (comprised of a H4 resistance level at 0.7443, a 61.8% H4 Fib resistance value at 0.7437 and H4 resistance in the form of a 127.2% Fib ext. point at 0.7440).
As you can see, the sell zone held, capping upside and sending price action lower into European trade on the back of a stronger USD across the board. Adding to USD upside was Fed Powell’s testimony who struck a decidedly hawkish tone on growth potential. Well done to those who remain short from the noted H4 zone!
A quick look over higher timeframe structure reveals weekly price continues to engage with a somewhat fragile demand area at 0.7371-0.7442. Continued indecisiveness here could open the window to a possible test of the 2016 yearly opening level at 0.7282 sometime down the road. In the event that the bulls regain consciousness, however, a retest of supply at 0.7812-0.7669 may be on the cards. Support at 0.7314, alongside its closely associated channel support taken from the low 0.7758, remains a focal point on the daily timeframe, as does the resistance level seen overhead at 0.7479. Both levels carry equal weight, in our opinion.
Areas of consideration:
Thanks to recent selling, the H4 candles are seen approaching support at 0.7371. It would be a chancy move to attempt a long from here, given how close 0.74 sits. Beyond 0.7371, traders’ crosshairs are likely fixed on the H4 Quasimodo support at 0.7323, which happens to converge with a possible H4 AB=CD completion point (blue arrows) and is located just ahead of daily support mentioned above at 0.7314. This would be an ideal take-profit zone for those short, as it is also a reasonably strong buy zone!
A H4 close below 0.7371, followed up with a retest, may also offer traders the opportunity to short (intraday), targeting the noted H4 Quasimodo support.
Today’s data points: US building permits and Housing starts; Fed Chair Powell testifies.
USD/JPY:
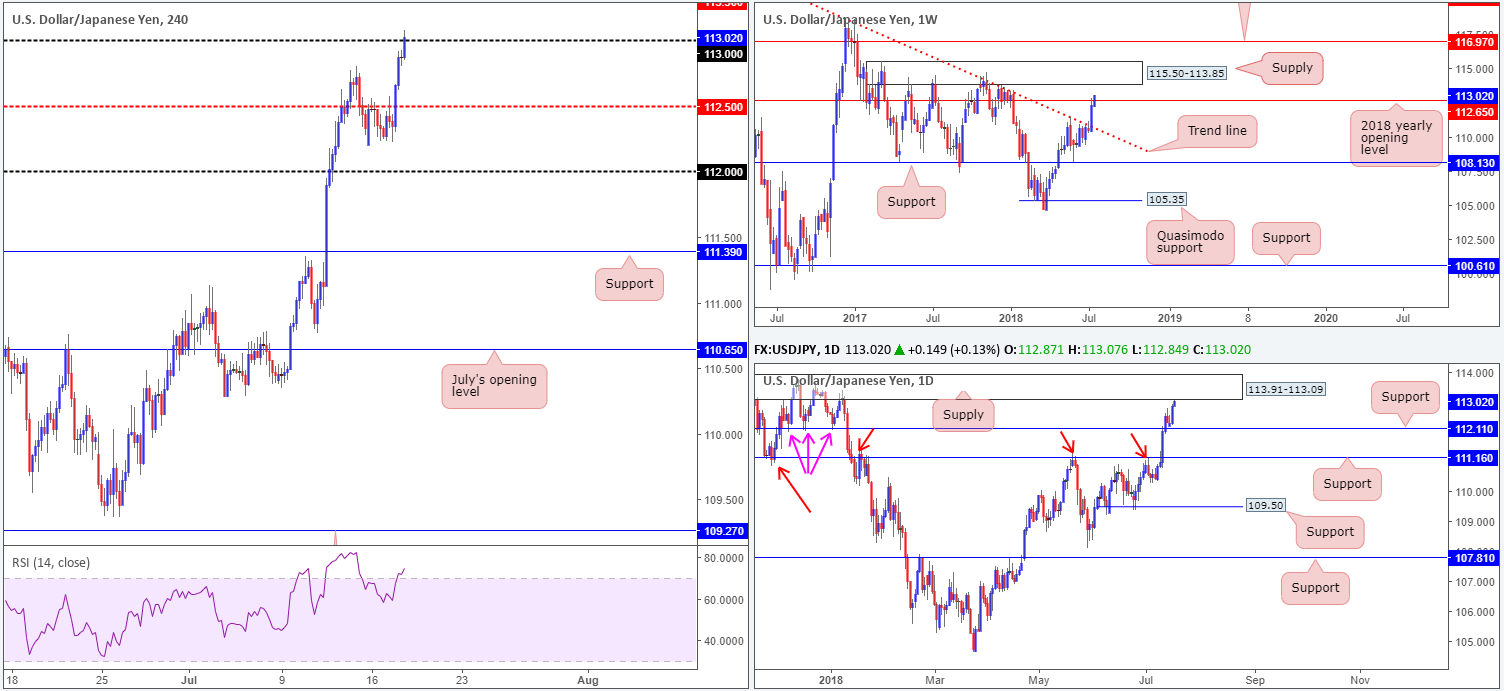
Improved sentiment along with a robust USD seen across the board, provided a floor of support for the USD/JPY on Tuesday. H4 mid-level resistance at 112.50 was taken out mid-way through London’s morning session, clearing the path north for US traders to approach the 113 handle.
As of current movement, the pair is seen crossing swords with 113. Traders who follow multiple timeframes may have also noticed a daily supply at 113.91-113.09 lurking just overhead, which houses a H4 Quasimodo resistance level brought in from early January 2018 at 113.30 (not seen on the screen).
Another consideration worthy of attention in this market is weekly price. Note the pair recently crossed above a 2018 yearly opening level at 112.65. Should buyers remain defensive, further upside to weekly supply at 115.50-113.85 could eventually come to fruition.
Areas of consideration:
Although there’s a possibility the market could stage a selloff from 113 today, the team favours higher prices for shorts: the H4 Quasimodo resistance mentioned above at 113.30. With the backing of the current daily supply and also the liquidity taken from stop-loss orders above 113, the odds of 113.30 producing a move lower far outweigh that of 113, in our opinion.
Electing to wait and see how H4 price action responds from 113.30 before pulling the trigger, however, is a smart move, since let’s not forget weekly price indicates further buying may be in store.
Today’s data points: US building permits and Housing starts; Fed Chair Powell testifies.
USD/CAD:
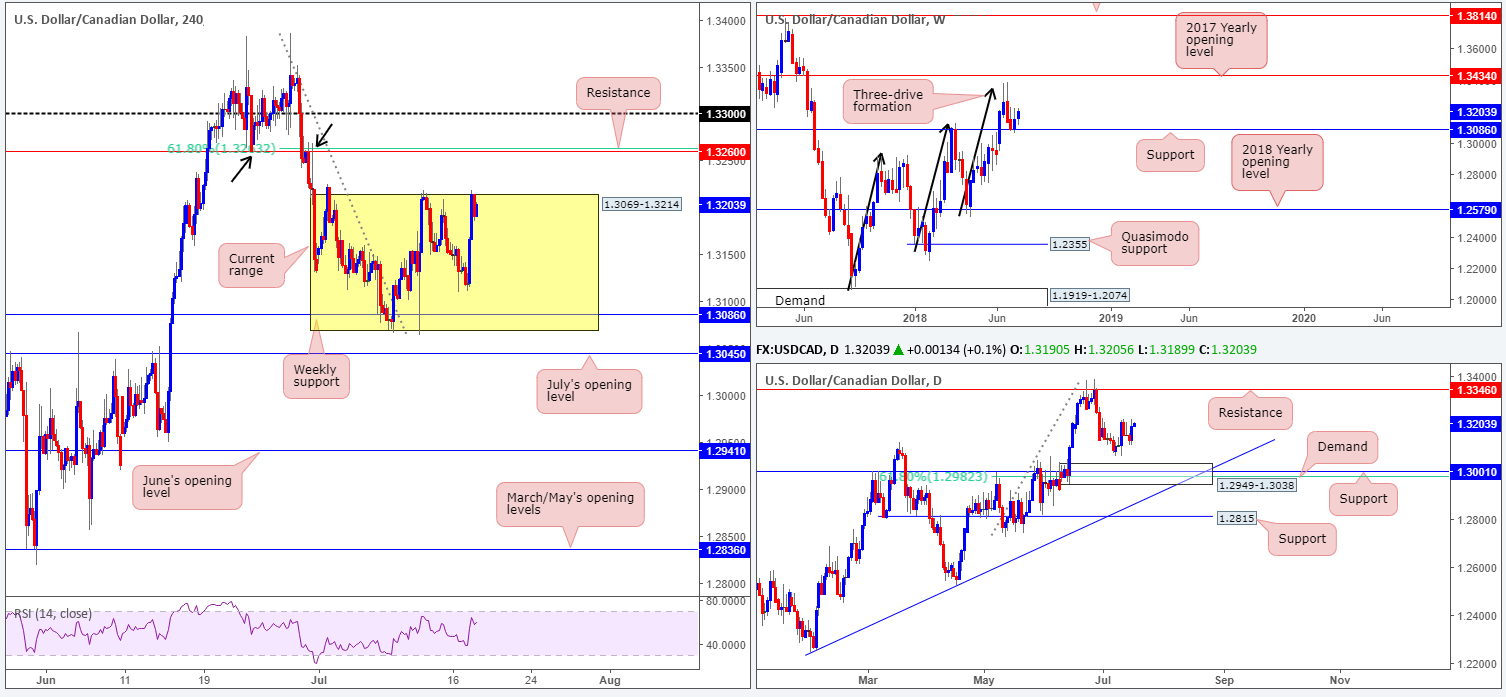
Boosted by a healthy US dollar, the pair advanced north on Tuesday, consequently bringing the H4 candles up to the top edge of its current range at 1.3214. A breach of this area will place H4 resistance at 1.3260 in the firing range (fuses with a 61.8% H4 Fib resistance at 1.3263), whereas a rejection off 1.3214 could see the unit pullback to weekly support at 1.3086 (seen supporting the lower edge of the current H4 range [1.3069]).
In terms of weekly structure, further buying is certainly a possibility. The weekly support mentioned above at 1.3086 is seen in play, with upside clear on the weekly scale for a test of the June 25 weekly high at 1.3386, followed closely by the 2017 yearly opening level at 1.3434. A closer look at price action on the daily timeframe, however, reveals strong support standing at 1.3001 (history dating back to Sept 2016), followed by a 61.8% Fib support value at 1.2982. On top of this, we can also see demand at 1.2949-1.3038 converging with these levels! Collectively, these areas are likely to hinder downside movement. To the upside, nonetheless, we see very little in terms of active resistance until 1.3346.
Areas of consideration:
Aside from a possible selloff from the H4 range upper edge this morning, trading opportunities are somewhat limited.
The H4 resistance level mentioned above at 1.3260 that converges with a 61.8% Fib number may well be an area that holds price lower. With higher timeframes pointing in a northerly direction, though, this, along with shorts off the 1.33 handle, would be considered low-probability trades, in our humble view. Therefore, trade with caution.
Today’s data points: US building permits and Housing starts; Fed Chair Powell testifies.
USD/CHF:
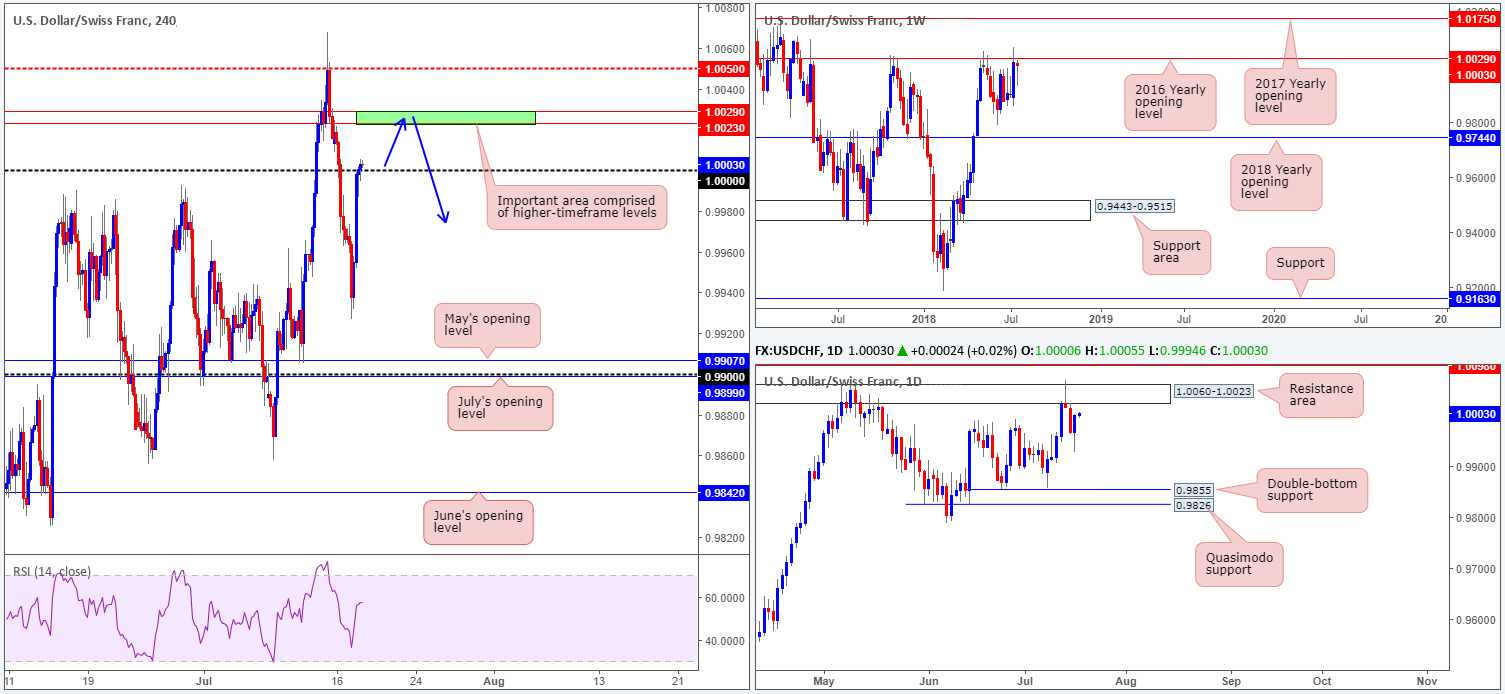
USD/CHF bulls went on the offensive amid Tuesday’s sessions, after bottoming at lows of 0.9927. In recent hours, buyers reclaimed parity (1.0000) on the H4 timeframe. Exposing the H4 mid-level resistance at 1.0050 as the next upside target on this scale, this could signal a resumption of bullish sentiment today.
Things, however, get a little problematic on the higher timeframes. We say this due to weekly price showing long-term resistance positioned at 1.0029: the 2016 yearly opening level that has held price lower on numerous occasions. Further adding to this, daily structure shows a resistance area just ahead of current price at 1.0060-1.0023, which happens to house the noted 2016 yearly opening level.
Areas of consideration:
Knowing there is higher-timeframes resistance nearby, is a long above 1.0000 a high-probability move? Well, certainly in terms of technical structure, it isn’t.
All eyes should be on the green area highlighted on the H4 timeframe at 1.0029/1.0023. This small zone underlines the 2016 yearly opening level on the weekly timeframe and the underside of the current daily resistance area.
If H4 price reaches 1.0029/1.0023 and forms a full or near-full-bodied bearish candle, shorting this market is considered high probability. A H4 close back beneath 1.0000 would be a strong cue of bearish intent and therefore a good time to consider reducing risk to breakeven and maybe even taking some profits off the table.
Today’s data points: US building permits and Housing starts; Fed Chair Powell testifies.
Dow Jones Industrial Average:
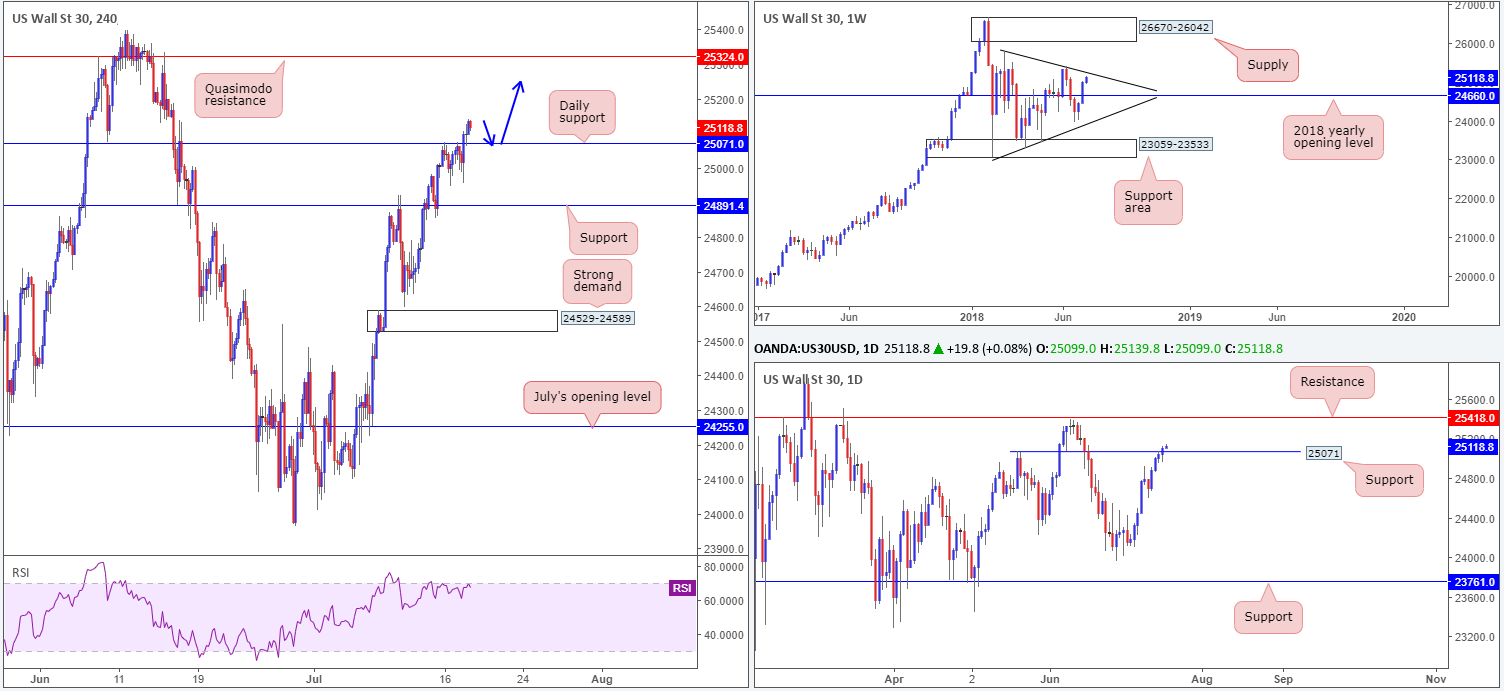
Wall Street eked out its fourth consecutive daily gain on Tuesday, supported by Fed’s Powell’s optimistic comments on growth potential. The move dragged H4 price beyond a daily Quasimodo resistance level at 25071, consequently exposing a H4 Quasimodo resistance at 25324.
Although the index appears on a strong footing, traders may want to exercise caution. Before the H4 candles reach the aforementioned Quasimodo resistance level, weekly sellers may put up a fight from trend line resistance (etched from the high 25807) and pull the market back to the 2018 yearly opening level at 24660.
Areas of consideration:
Keeping it Simple Simon this morning, longs on a retest of 25071 are still an option (preferably supported by a H4 full or near-full-bodied bull candle), despite overhead resistances. Rather than targeting the H4 Quasimodo resistance at 25324, though, the first take-profit target should be fixed at the weekly trend line resistance highlighted above. Should we breach this level, then by all means look for a touch of the noted H4 barrier.
Today’s data points: US building permits and Housing starts; Fed Chair Powell testifies.
XAU/USD (Gold)
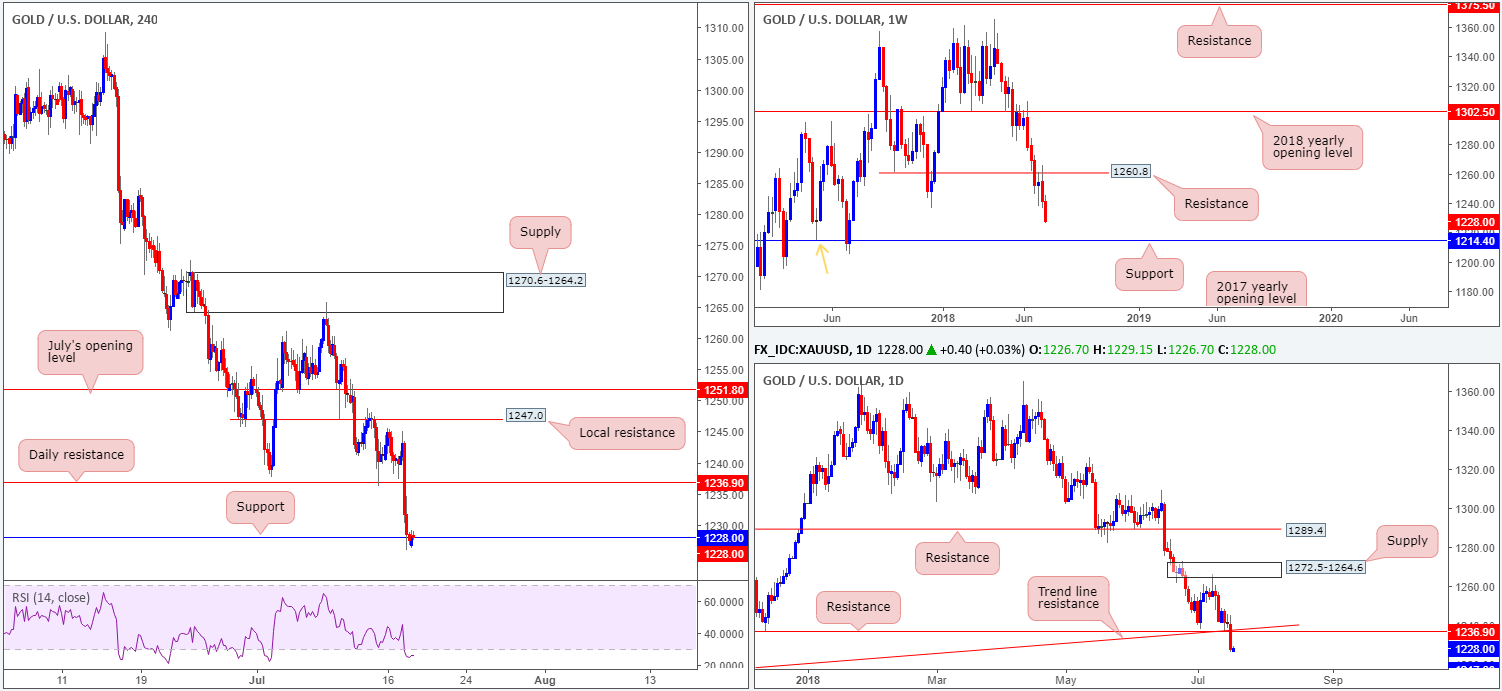
Across the board, markets witnessed demand for US-related assets on Tuesday, placing commodities under pressure. Down over 1% on the day, XAU/USD filtered its way through daily support at 1236.9, along with its daily trend line support etched from the low 1195.1 (both now acting resistances). As you can see, the day concluded with H4 candles marginally surpassing support notched up at 1228.0. Beyond here, the next support target can be seen at H4 demand drawn from 1214.6-1218.6 (not seen on the screen).
Concerns over the strength of the current H4 support level are valid, in our opinion. Our rationale behind this approach stems from the higher timeframes. From the weekly timeframe we can see room to press as far south as weekly support at 1214.4, which also happens to represent a Quasimodo support taken from the left shoulder marked with an orange arrow. In addition to this, daily action also displays room to probe as low as Quasimodo support at 1217.6 (not seen on the screen).
Areas of consideration:
Due to where we’re coming from on the bigger picture, caution is warranted should you intend on buying this market.
To that end, a H4 close beyond the current H4 support that’s followed up with a retest as resistance in the shape of a full or near-full-bodied H4 bear candle would, according to the overall technical picture, be a high-probability short, targeting the H4 demand mentioned above at 1214.6-1218.6.
The use of the site is agreement that the site is for informational and educational purposes only and does not constitute advice in any form in the furtherance of any trade or trading decisions.
The accuracy, completeness and timeliness of the information contained on this site cannot be guaranteed. IC Markets does not warranty, guarantee or make any representations, or assume any liability with regard to financial results based on the use of the information in the site.
News, views, opinions, recommendations and other information obtained from sources outside of www.icmarkets.com.au, used in this site are believed to be reliable, but we cannot guarantee their accuracy or completeness. All such information is subject to change at any time without notice. IC Markets assumes no responsibility for the content of any linked site. The fact that such links may exist does not indicate approval or endorsement of any material contained on any linked site.
IC Markets is not liable for any harm caused by the transmission, through accessing the services or information on this site, of a computer virus, or other computer code or programming device that might be used to access, delete, damage, disable, disrupt or otherwise impede in any manner, the operation of the site or of any user’s software, hardware, data or property.


