EUR/USD:
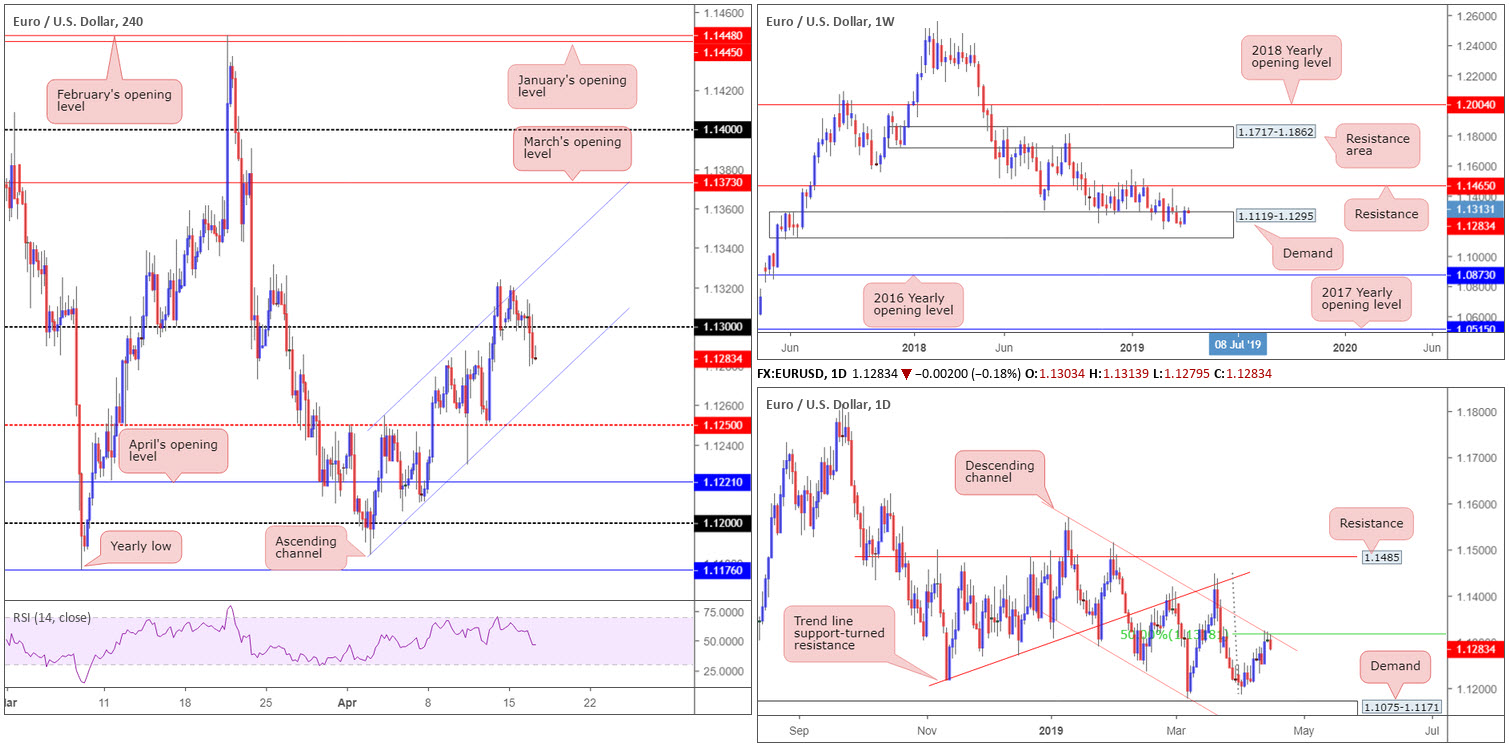
The single currency soured in the face of a healthy dollar Tuesday, consequently reclaiming 1.13 to the downside on the H4 timeframe. According to our technical studies, the move potentially sets the stage for a run towards channel support (extended from the low 1.1183), followed by 1.1250 support.
Assisting sellers is channel resistance (taken from the high 1.1569) and a merging 50.0% resistance value at 1.1318 on the daily timeframe. From this point, the 1.1183 Apr 2 low, shadowed closely by demand at 1.1075-1.1171, are in sight as workable supports.
While the H4 and daily timeframes offer a somewhat bearish vibe this morning, traders are still urged to consider the picture on the weekly timeframe: demand coming in at 1.1119-1.1295. With this in mind, there’s a strong chance weekly buyers from within this area may soak up any selling pressure from lower-timeframe players.
Areas of consideration:
A retest of 1.13 as resistance could be a scenario to keep an eye out for today for selling, targeting the aforementioned H4 channel support as the initial port of call. Strict trade management is advised, as despite daily flow supporting a move lower, weekly price possibly signals higher price.
Longs off the H4 channel support may also be something to consider today, given the weekly timeframe’s position. The 1.1250 barrier, sited beneath the channel, is also an option, in light of its service as support and resistance over the past couple of weeks.
Irrespective of which levels are selected, waiting for additional confirmation is likely to add weight and also provide entry/risk levels to work with.
Today’s data points: FOMC Member Bullard Speaks.
GBP/USD:
The GBP/USD was subject to two-way Brexit headline risk Tuesday, following reports that talks between the government and opposition had broken down – later denied by Labour. In terms of market data, the unemployment rate in the UK came in unchanged at 3.9%, as expected. It might also interest some traders to note the US dollar index reclaimed 97.00+ status.
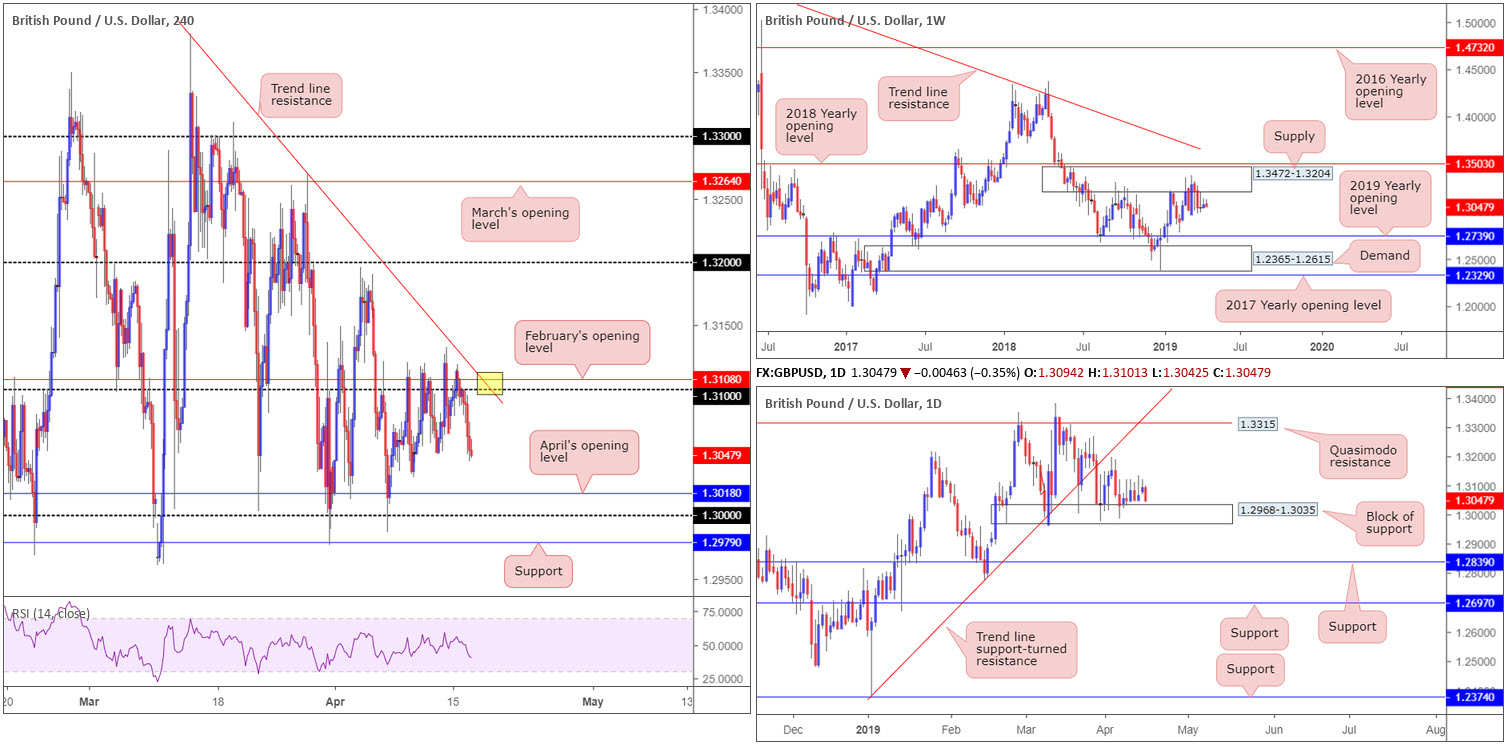
Kicking things off from the top, weekly movement continues to consolidate around the underside of supply at 1.3472-1.3204, situated a few points south of the 2018 yearly opening level at 1.3503. Since the end of February this supply area has been home to many traders. With the next obvious downside target not realised on this timeframe until the 2019 yearly opening level at 1.2739, followed by demand coming in at 1.2365-1.2615, sellers still have plenty of room to manoeuvre if they press lower.
Against the backdrop of weekly flow, daily activity remains teasing a block of support at 1.2968-1.3035. Buying from here is likely to find resistance at a Quasimodo formation drawn from 1.3315, closely followed by a trend line support-turned resistance (extended from the low 1.2373). In the event the current support fails, as weekly structure suggests, support coming in at 1.2839 is in sight, alongside another layer of support at 1.2697 (at this point we’ll be trading below the 2019 yearly opening level on the weekly timeframe).
A closer reading of price action on the H4 timeframe has the unit exploring ground beneath 1.31, targeting April’s opening level at 1.3018, key figure 1.30 and support priced in at 1.2979. Note 1.31 also merges with a trend line resistance (taken from the high 1.3380) and February’s opening level at 1.3108.
Areas of consideration:
In similar fashion to previous reports, higher-timeframe structure offers an indecisive picture at present, leaving traders with only H4 levels to work with at the moment.
The point the current H4 trend line resistance (1.3380) merges with 1.3108/1.31 (yellow) offers attractive confluence and, therefore, is likely to produce a bounce if tested. Although this area draws in reasonably robust confluence from the H4 timeframe, the base does, however, lack higher-timeframe convergence. For that reason, waiting for additional H4 confirmation to form prior to pulling the trigger is recommended (entry/risk levels can be determined according to this structure).
Traders interested in entering long from the 1.30 region bring with them a clear block of daily support mentioned above at 1.2968-1.3035, along with nearby H4 supports highlighted in bold. Though this region is likely to encourage buyers, the main concern is on the weekly timeframe: supply at 1.3472-1.3204. As a result, it may also be worth considering waiting for H4 confirmation to form here as well.
Today’s data points: UK CPI y/y; UK PPI Input m/m; UK RPI y/y; BoE Gov. Carney Speaks; FOMC Member Bullard Speaks.
AUD/USD:
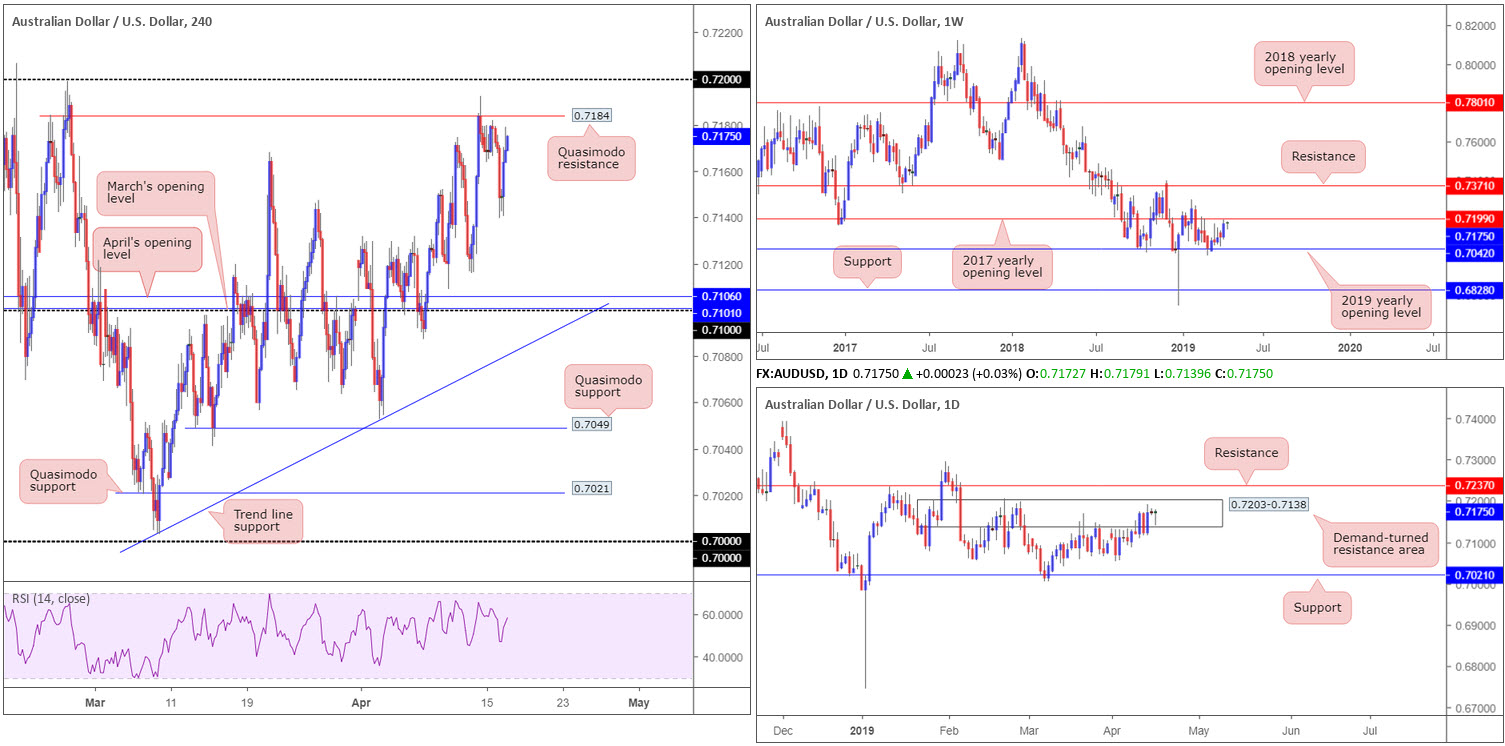
Amid the early hours of the Asian session Tuesday, the Australian dollar fell sharply against its US counterpart. Induced by a dovish RBA which seems to be laying out the conditions needed for it to cut rates, H4 price clocked a session low of 0.7139. A reasonably tight consolidation followed (visible on the H1 timeframe) before turning northbound and reclaiming losses during the US session.
With the above in mind, since mid-February, the weekly candles have been carving out a reasonably tight consolidation between the 2017/2019 yearly opening levels at 0.7199/0.7042. As you can see, last week’s movement wrapped up a few pips south of the upper limit of this range, therefore the outlook on this scale potentially bodes well for sellers at the moment.
Following a modest rebound off daily support at 0.7021 early March, the pair, since March 20, has been clinging to the underside of a daily demand-turned resistance area at 0.7203-0.7138. A push higher from here may eventually land the unit at daily resistance drawn from 0.7237.
Recent action on the H4 timeframe landed the candles within striking distance of Quasimodo resistance at 0.7184. Although the current Quasimodo held as resistance, the temptation to climb higher and draw in sellers from the 0.72 handle is there due to its connection with the 2017 yearly opening level on the weekly timeframe at 0.7199. It is also worth bearing in mind 0.72 is tucked within the upper limits of the daily demand-turned resistance area at 0.7203-0.7138.
Areas of consideration:
Should the unit test 0.72 and hold by way of a H4 bearish candlestick pattern (or any confirmation method of your choosing – entry/risk levels to be determined according to this structure), the odds of a selloff emerging from here are high. The ultimate downside target from 0.72 falls in around 0.71 (note April and March’s opening levels here at 0.7106/0.7101), but do bear in mind the unit could, in theory, reach as far south as 0.7042: the 2019 yearly opening level mentioned above on the weekly timeframe.
Today’s data points: Chinese GDP q/y; Chinese Fixed Asset Investment ytd/y; Chinese Industrial Production y/y FOMC Member Bullard Speaks.
USD/JPY:
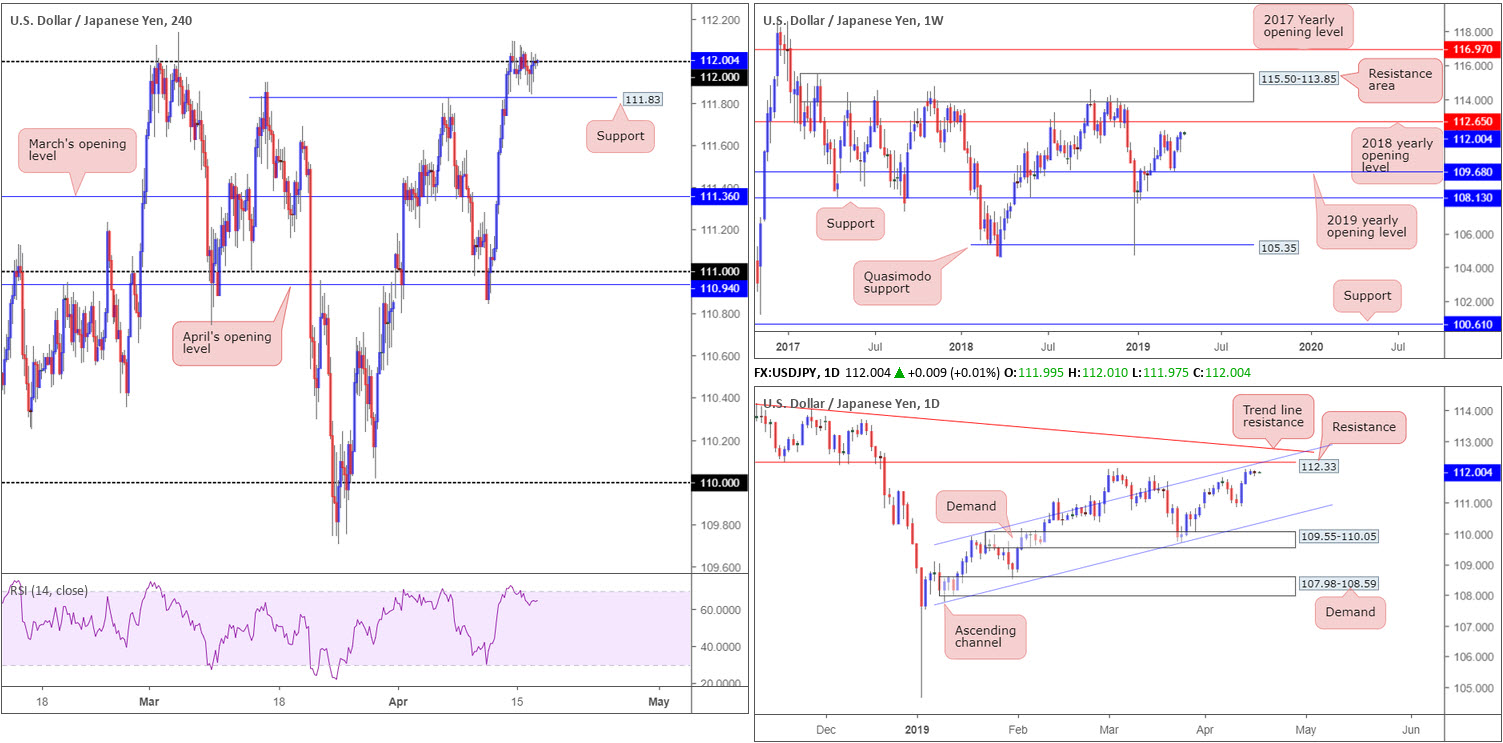
Since the beginning of the week, the USD/JPY has struggled to find direction. The H4 candles, as you can see, continue to flip between gains/losses around 112. Support is positioned nearby at 111.83: a Quasimodo resistance-turned support, whereas to the upside, traders’ crosshairs are likely fixed on daily resistance coming in at 112.33.
Crossing over to daily structure, the research team notes the 112.33 resistance level also fuses with a channel resistance (drawn from the high 109.88), and is closely positioned nearby a trend line resistance (etched from the high 114.54). Structure on the weekly timeframe has the candles facing the March 4 high at 112.13, shadowed closely by the 2018 yearly opening level priced in at 112.65.
Areas of consideration:
Daily resistance at 112.33 appears a prime location for shorts in this market, according to our technical reading, with stop-loss orders plotted beyond the daily trend line resistance highlighted above. The only caveat to this, aside from a reasonably strong trending market at the moment, is weekly price threatening to press as far north at 112.65. For that reason, before pulling the trigger to sell from 112.33, traders are recommended to wait for additional confirmation. This could be anything from a moving average crossover, a H4 bearish candlestick signal or even drilling down to the lower timeframes and trading local structure.
Today’s data points: FOMC Member Bullard Speaks.
USD/CAD:
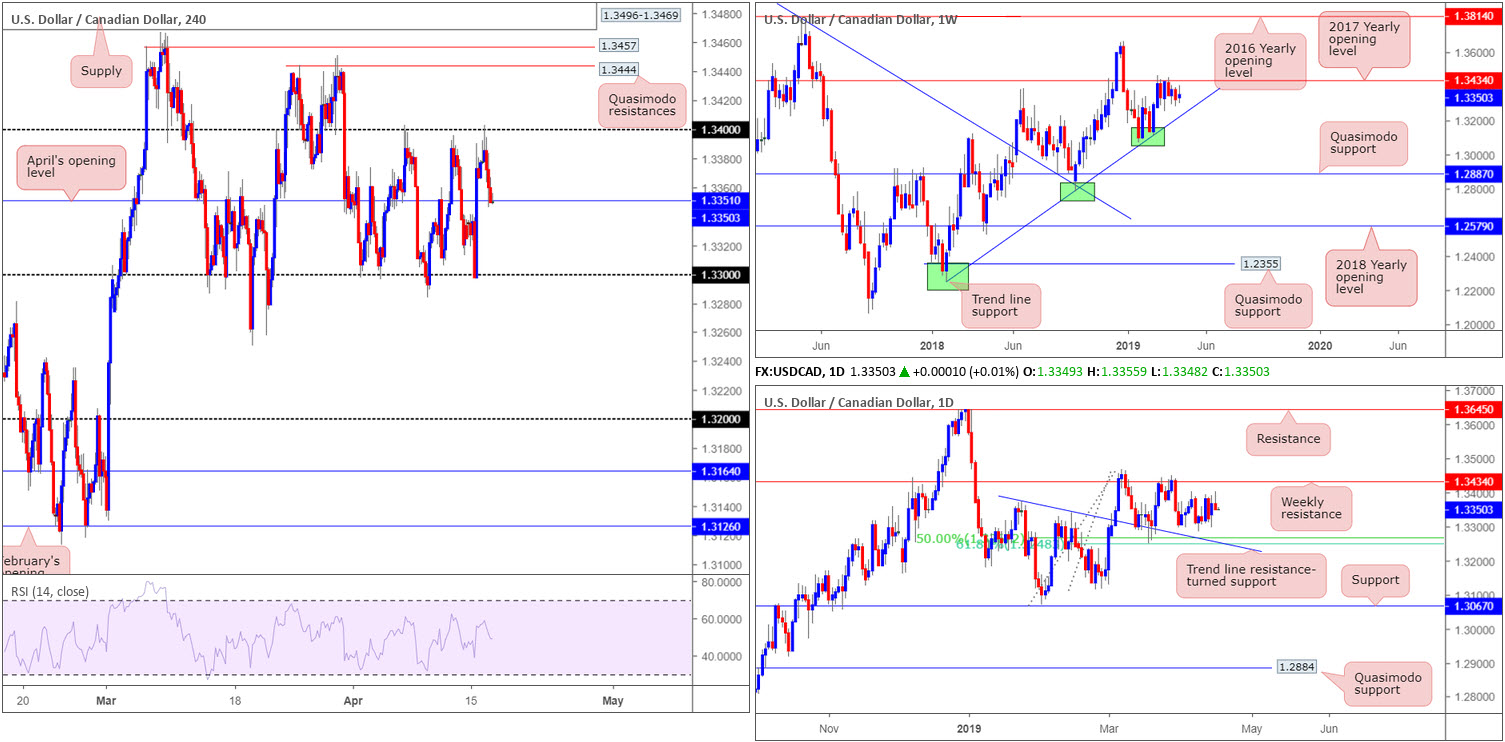
The commodity-sensitive Canadian dollar gained ground vs. its US counterpart Tuesday, amid WTI prices reclaiming $64.00 to the upside. Technically, 1.34 on the H4 timeframe held firm and pressured the candles towards April’s opening level at 1.3351 into the close. Structure on the H4 scale has 1.33 as the next layer of support – note this barrier held price action higher on a number of occasions – whereas beyond 1.34 we have two layers of Quasimodo resistance at 1.3457/1.3444 visible, trailed closely by a supply zone at 1.3496-1.3469.
Against the backdrop of medium-term flows, daily action’s focus has shifted to weekly resistance at 1.3434: the 2017 yearly opening level. In the event we turn lower from current price, nonetheless, a 50.0% support is seen at 1.3267. Note this barrier also happens to merge closely with a 61.8% Fibonacci support at 1.3248 and a trend line resistance-turned support (extended from the high 1.3375). It might also be worth noting a weekly trend line support (etched from the low 1.2247) merges with the aforementioned daily supports.
Areas of consideration:
It’s painfully obvious to any technician the H4 timeframe is entrenched within a consolidation between 1.34 and 1.33 at the moment. Trading the outer limits of this range and targeting the opposing edge is, therefore, an option going forward. The problem with this is the threat of price action printing a fakeout beyond these range extremes to either weekly resistance at 1.3434 or 1.3267: the daily 50.0% support. Therefore, it might be worth waiting and seeing if H4 action chalks up a notable candlestick signal before pulling the trigger. Not only will this help avoid being taken out on a fakeout, it’d provide strict entry and risk levels.
Today’s data points: FOMC Member Bullard Speaks; Canadian CPI m/m; Canadian Trade Balance; Canadian Common CPI y/y; Canadian Median CPI y/y; Canadian Trimmed CPI y/y; Crude Oil Inventories.
USD/CHF:
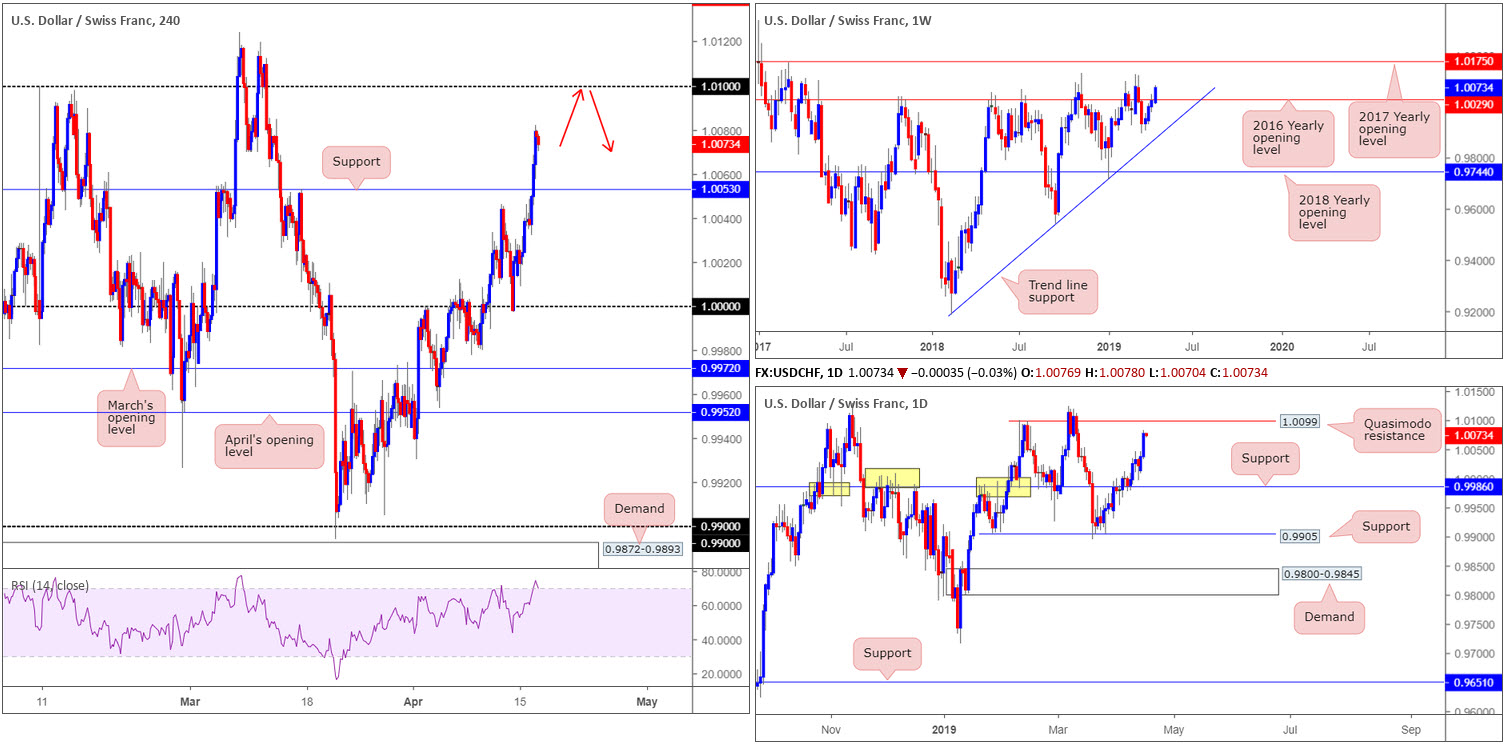
Demand for the USD continued Tuesday, up 0.38% against its Swiss counterpart. The market’s landscape on the weekly timeframe now has the unit trading beyond its 2016 yearly opening level at 1.0029, with the possibility of further extension towards the 2017 yearly opening level at 1.0175. Although this may come across as bullish, traders might want to note the pair has crossed above 1.0029 on two separate occasions already and each time traded lower.
Daily movement, thanks to yesterday’s buying, is positioned ahead of a Quasimodo resistance at 1.0099. Of particular interest here is the convergence of the 1.01 handle applied to the H4 timeframe and also the H4 RSI indicator testing overbought waters.
Areas of consideration:
On account of the above, the 1.01 level on the H4 timeframe is a high-probability location to sell. While the base boasts additional resistance from a daily Quasimodo (see above), waiting for additional confirmation to form before pulling the trigger is advised (entry/risk levels can be determined according to the confirming technique selected). This is simply due to the threat of a fakeout taking shape beyond 1.01, which is common viewing.
Today’s data points: FOMC Member Bullard Speaks.
Dow Jones Industrial Average:
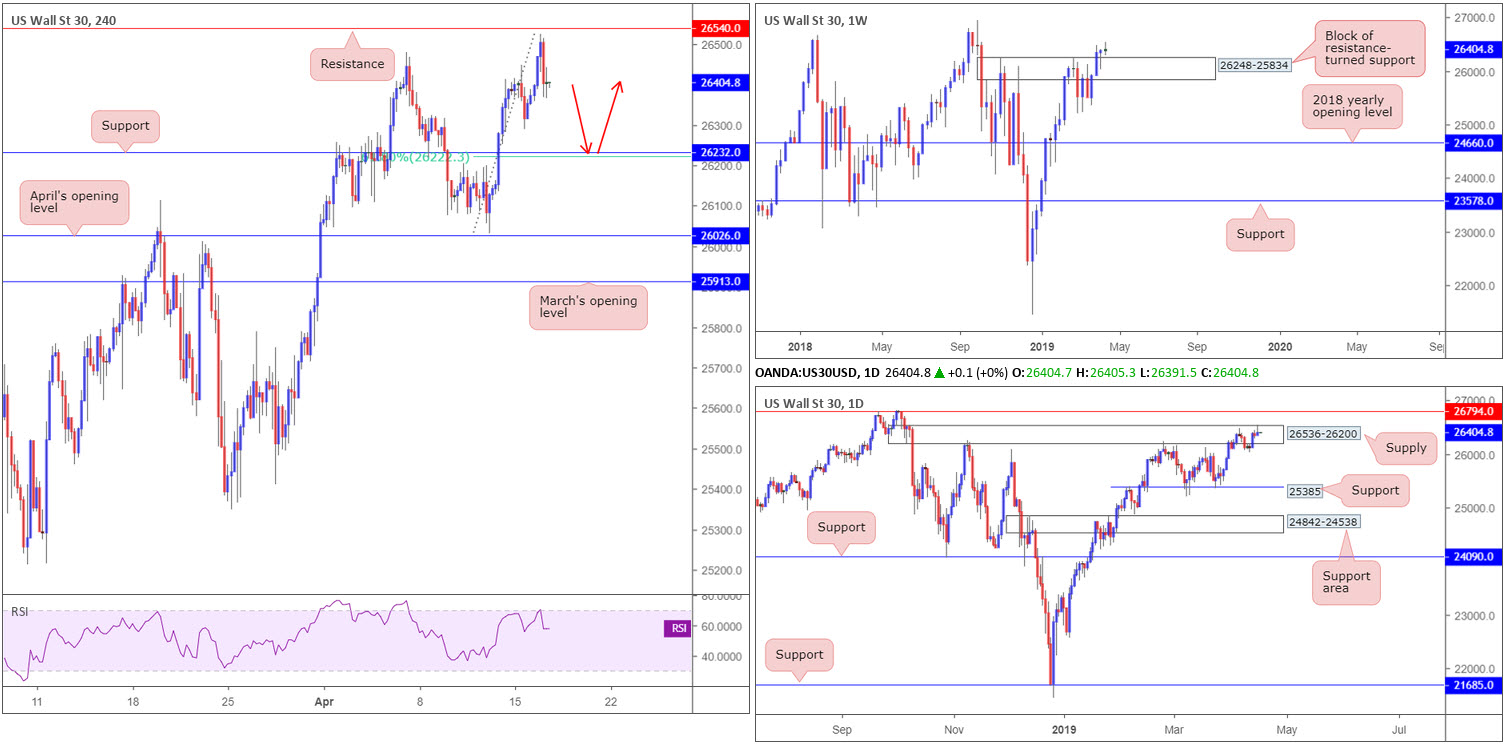
Markets witnessed strong gains materialise in early London Tuesday, though failed to reach H4 resistance plotted at 26540 before turning lower into the close. With a fresh higher peak formed (breaking the 26478 April 19 high) at 26525 and the said resistance unopposed, H4 support plotted at 26232 and merging H4 61.8% Fibonacci support at 26222 provides a solid floor to consider buying from in the event we pullback this far today.
A retest of 26232 is further supported on the weekly timeframe, which, as you can see, recently produced a firm bullish pin-bar formation out of a resistance-turned support area at 26248-25834. Daily flow, on the other hand, positions the unit within the walls of supply drawn from 26536-26200 that’s sited just south of a Quasimodo resistance at 26794.
Areas of consideration:
Should H4 action drop lower to challenge support at 26232 (and the closely positioned 61.8% Fibonacci support at 26222) in the shape of a bullish candlestick signal (either H1 or H4 – entry and risk levels can be determined according to the candlestick’s structure), a long could be a consideration. In terms of take-profit targets, it’s a little too early to decide as the approach to the buy zone has yet to be completed.
Today’s data points: FOMC Member Bullard Speaks.
XAU/USD (GOLD):
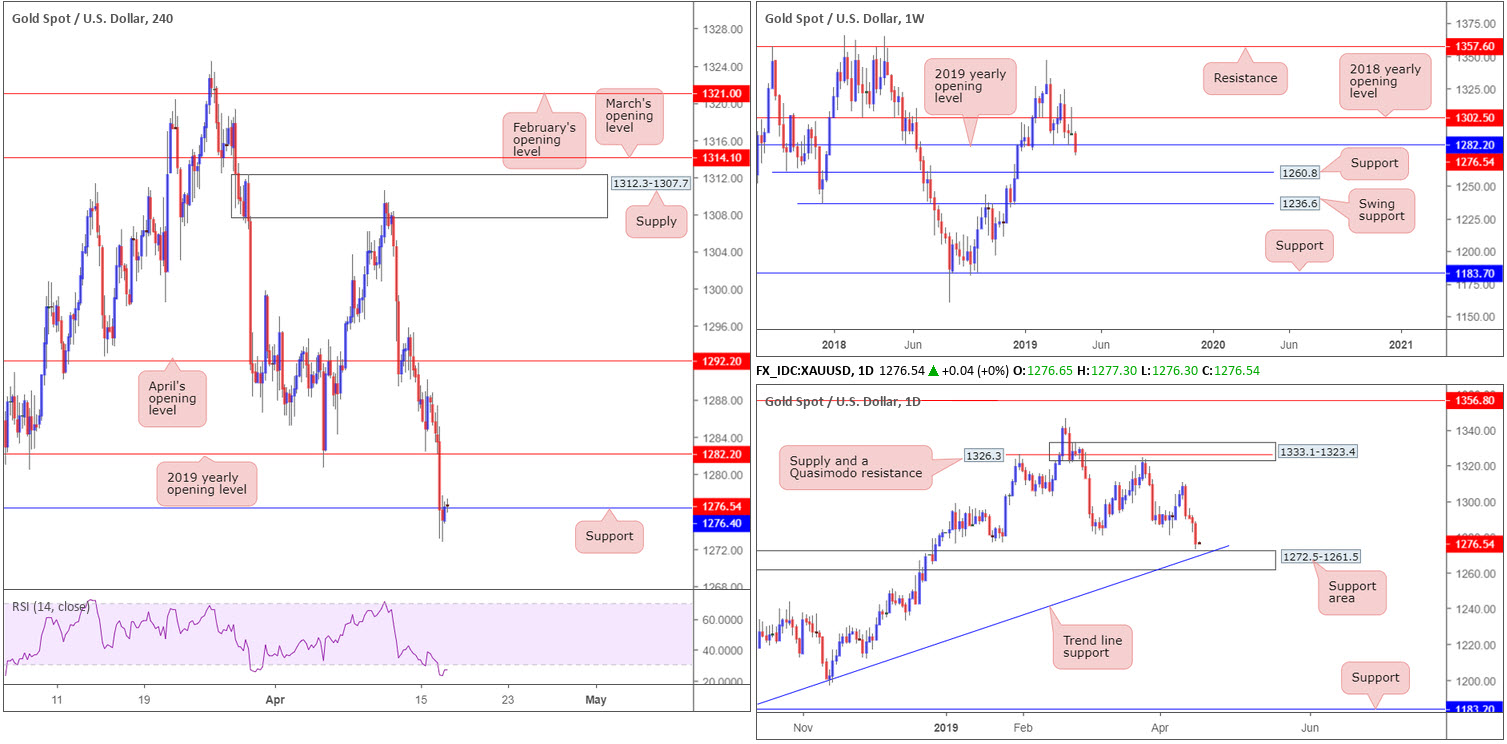
Bullion fell sharply Tuesday, refreshing 2019 yearly lows at 1273.0. A string of robust economic data boosted demand for riskier assets like equities while bullion was further weighed down by gains in the greenback.
In terms of the technical picture, the current weekly candle is testing waters beneath its 2019 yearly opening level at 1282.2, potentially exposing ground towards another layer of support priced in at 1260.8. In the way of further selling, however, is a daily support area coming in at 1272.5-1261.5, which happens to merge with a trend line support (etched from the low 1160.3). Given its confluence, this base is likely to hold active buyers within.
A closer reading of price action on the H4 timeframe witnessed support at 1276.4, a level with reasonably strong history, enter the mix yesterday. Although the barrier suffered a breach, it appears buyers are trying to reclaim this level and possibly retest the underside of the 2019 yearly opening level on the weekly timeframe at 1282.2.
Areas of consideration:
Ultimately, buying this market, particularly after viewing weekly price overthrow 1282.2, is precarious at current prices. A better route would be for daily price to test its support area at 1272.5-1261.5 and produce a H4 bullish candlestick formation (entry and risk levels can be drawn from this structure).
The accuracy, completeness and timeliness of the information contained on this site cannot be guaranteed. IC Markets does not warranty, guarantee or make any representations, or assume any liability with regard to financial results based on the use of the information in the site.
News, views, opinions, recommendations and other information obtained from sources outside of www.icmarkets.com.au, used in this site are believed to be reliable, but we cannot guarantee their accuracy or completeness. All such information is subject to change at any time without notice. IC Markets assumes no responsibility for the content of any linked site. The fact that such links may exist does not indicate approval or endorsement of any material contained on any linked site.
IC Markets is not liable for any harm caused by the transmission, through accessing the services or information on this site, of a computer virus, or other computer code or programming device that might be used to access, delete, damage, disable, disrupt or otherwise impede in any manner, the operation of the site or of any user’s software, hardware, data or property.