
EUR/USD:
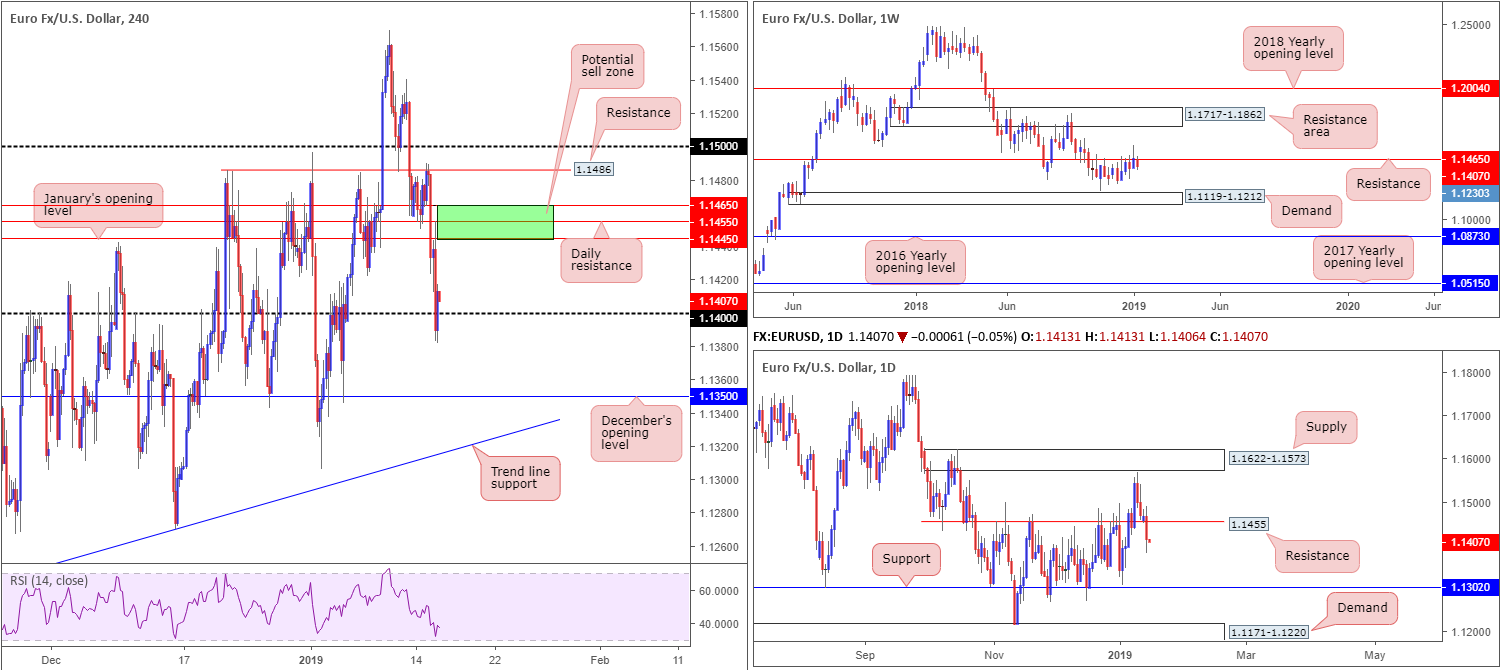
A combination of broad-based USD bidding and ECB President Draghi highlighting recent economic developments have been weaker than forecasts, weighed on the single currency Tuesday. Down 0.48% on the day, the EUR/USD’s H4 candles broke through and retested January’s opening level at 1.1445 as resistance, and eventually whipsawed through 1.14 into the close.
The move to lows of 1.1382 likely tripped a truckload of stop-loss orders from traders attempting to fade 1.14, potentially clearing the path south towards December’s opening level plotted at 1.1350.
The H4 timeframe’s bearish vibe is also echoed higher up on the curve. Weekly resistance at 1.1465 remains defensive, opening up the possibility of further selling towards weekly demand at 1.1119-1.1212. In conjunction with weekly flow, daily action also recently crossed under support at 1.1455 (now acting resistance), consequently exposing support priced in at 1.1302.
Areas of consideration:
In the event buyers regain a foothold above 1.14, the research team notes possible shorting opportunities between 1.1465/1.1445 (green – comprised of the weekly and daily resistance levels as well as January’s opening level). The first downside target from this area is set around 1.14, though further selling beyond this number is high probability.
Should the H4 candles continue exploring lower ground from current price and retake 1.14 to the downside, however, traders are then free to look for shorting opportunities (preferably on the retest of 1.14 as resistance) towards December’s opening level mentioned above at 1.1350 as an initial take-profit target.
Today’s data points: Limited.
GBP/USD:
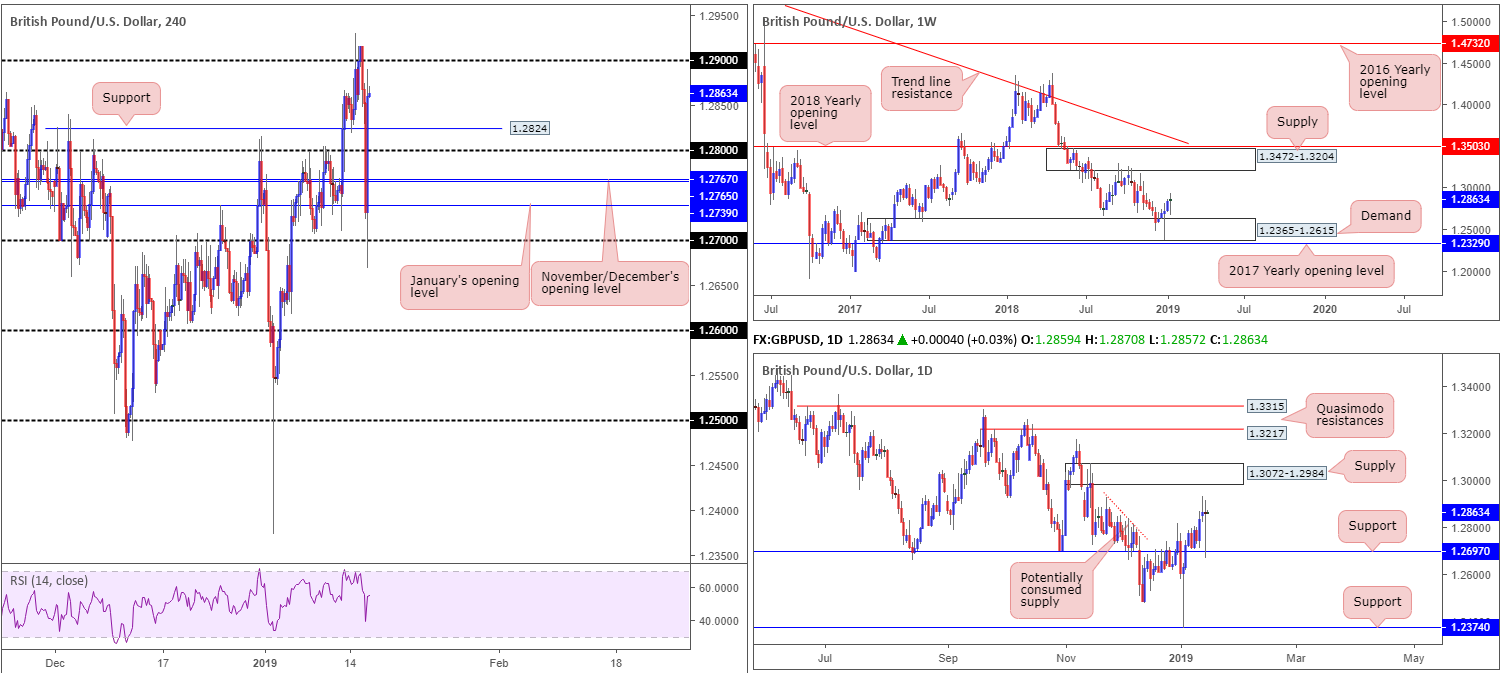
British lawmakers rejected Prime Minister Theresa May’s Brexit deal by a wide margin Tuesday. GBP fell against its US counterpart to lows of 1.2668 in a knee jerk reaction, though swiftly pared back losses to move towards flat for the day, as traders reasoned the rejection of May’s deal along with a Parliament committed to leaving the EU with a deal lessens the chance of a no-deal Brexit. Labour opposition, however, proposed a no-confidence vote on PM May that will take place today at 19:00 GMT.
Despite recent volatility, the technical picture remains unchanged.
Coming in from the top this morning, we can observe weekly price holding reasonably firm north of demand at 1.2365-1.2615, with a run towards supply at 1.3472-1.3204 still in the mix as a possibility. A closer reading on the daily timeframe witnessed yesterday’s candle reconnect with support at 1.2697 and strongly rebound north. Continued buying from this point could lead to a test of supply at 1.3072-1.2984, according to our technical studies. Above 1.2697, limited supply is visible, with a major portion likely consumed as price declined lower in late November of 2018 (see red descending line).
Areas of consideration:
Although the technical structure on the bigger picture points to higher prices, 1.29 on the H4 timeframe could hamper movement as it did on November 22, 2018 and more recently on Monday this week.
Despite this, the research team has labelled this a flat market, given further volatility is expected. Trading technical formations in an environment such as this, as you probably found it yesterday, is incredibly precarious and challenging.
Today’s data points: BoE Gov. Carney Speaks; UK CPI y/y; UK PPI Input m/m; UK RPI y/y.
AUD/USD:
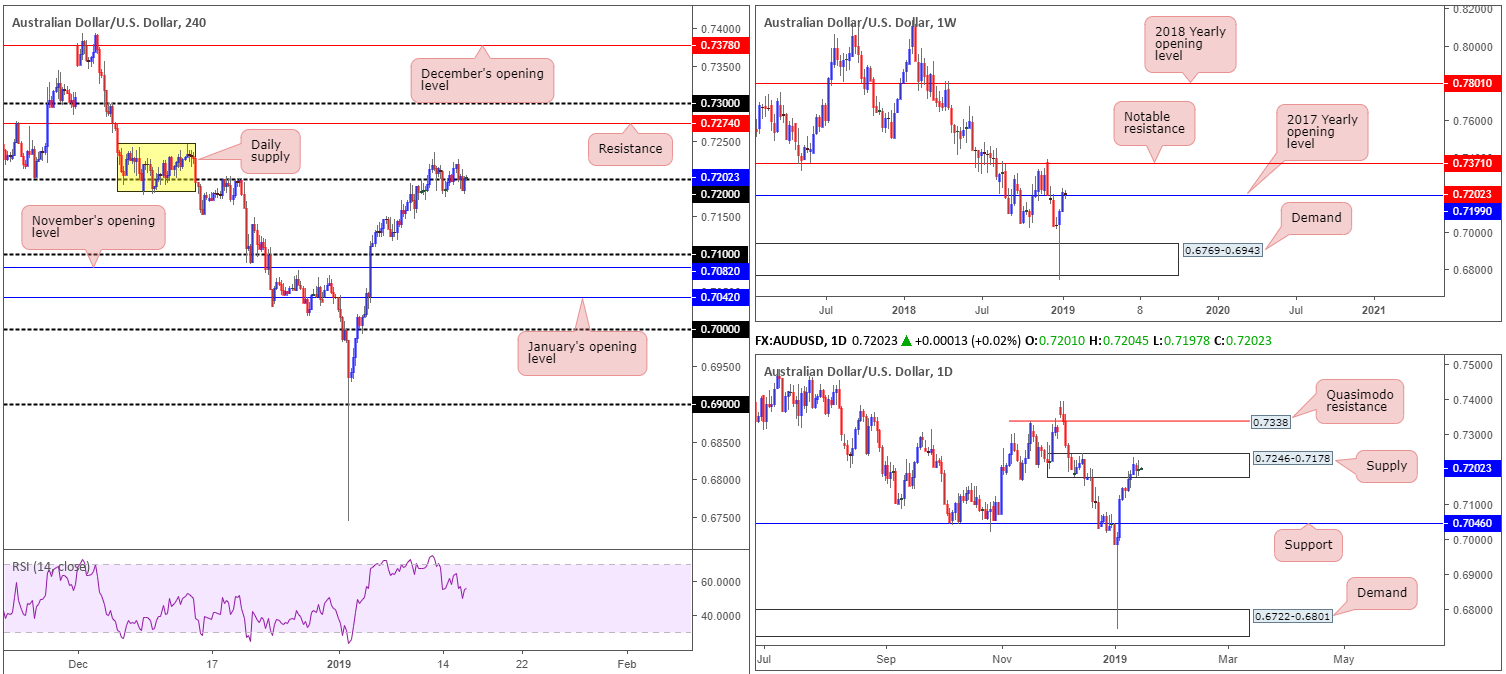
AUD/USD prices concluded Tuesday’s segment unmoved for a second consecutive day, flipping between gains/losses around the 0.72 handle on the H4 timeframe. As a result of this, much of the following piece will echo similar thoughts put forward in previous briefings.
From the top of the pile, we can see weekly flow engaging with its 2017 yearly opening level at 0.7199 after experiencing a marginal breach to the upside last week. Should buyers remain in the driving seat here this week, notable resistance at 0.7371 is in range.
Contrary to weekly structure, daily supply at 0.7246-0.7178 is still in the picture, currently hindering upside. Failure to hold ground, however, not only confirms bullish strength above the 2017 yearly opening level at 0.7199 on the weekly timeframe, it also frees upside in the direction of a daily Quasimodo resistance at 0.7338.
Areas of consideration:
In view of recent movement, the research team is still cautious in this market.
Before considering a long (based on where we’re trading from on the weekly timeframe), waiting for a H4 close above the aforementioned daily supply is recommended. This, in theory, likely clears sellers from within the zone and opens up the path north for further buying. A H4 close above daily supply, followed up with a retreat to 0.72 offers traders the chance to buy, according to our reading, targeting H4 resistance at 0.7274. Still, it is worth noting that round numbers (0.72) are typically prone to fakeouts, therefore entering long on the retest of this number using additional candlestick confirmation is recommended (entry/stop parameters can be defined according to this pattern).
Today’s data points: Limited.
USD/JPY:
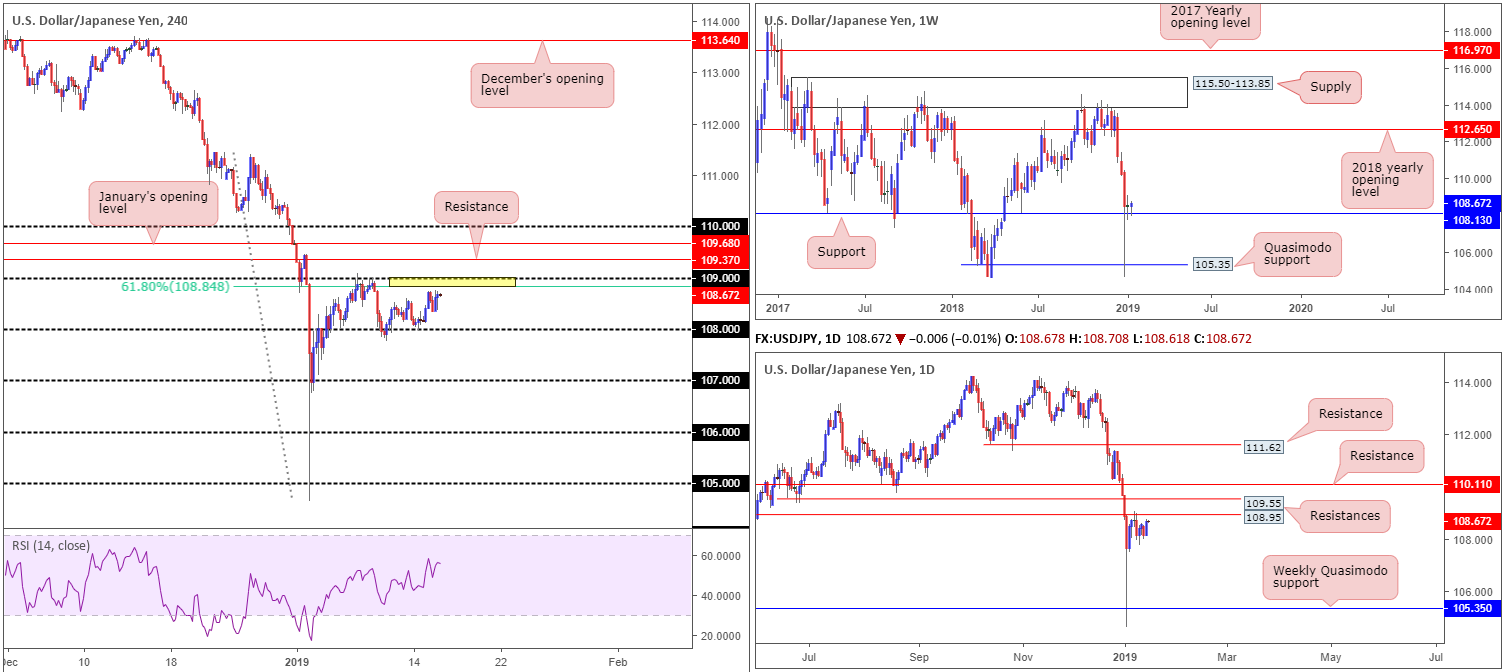
In lockstep with a robust US dollar index and continued buying observed in US equities, the USD/JPY maintained a bullish stance Tuesday.
According to the H4 timeframe, this has positioned the candles just south of a rather interesting area of resistance between 109 and 108.84 (yellow).The 109 handle remains in the firing range as a viable upside target for a large portion of intraday traders this morning, which happens to merge closely with a 61.8% H4 Fibonacci resistance value at 108.84 and a daily resistance at 108.95 (a Quasimodo support-turned resistance). In addition to this, traders may also want to pencil in another layer of daily resistance (also a Quasimodo support-turned resistance) seen directly above at 109.55.
While 109/108.84 appears strong resistance, it is somewhat marred by weekly traders defending support at 108.13.
Areas of consideration:
On account of the above, structure in this market seems to be caught between a rock and a hard place at the moment. Irrespective of the direction one selects here, traders have to contend with strong opposition.
Should your methodology agree with shorting the 109 area today, waiting for additional candlestick confirmation to take shape may be an idea to help avoid an unnecessary loss.
Today’s data points: Limited.
USD/CAD:
Outlook unchanged
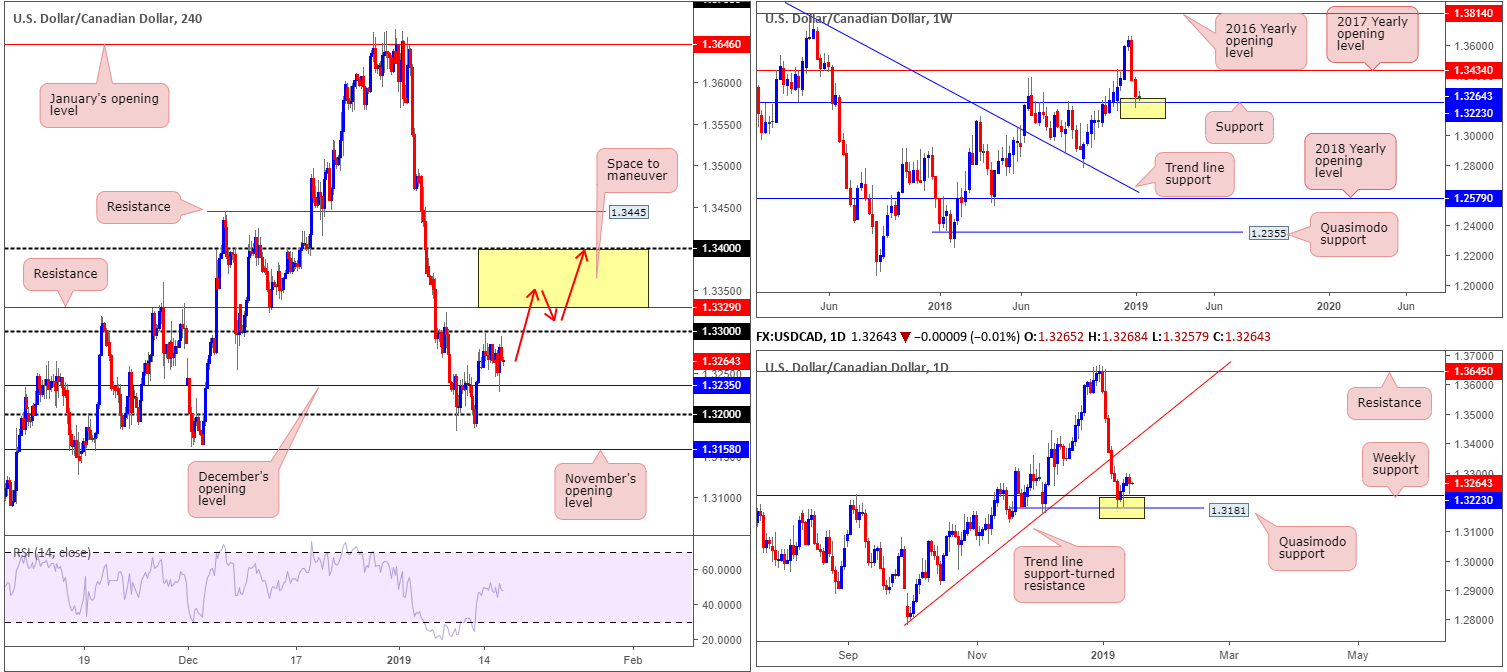
Breaking a three-day bullish phase, Tuesday’s movement recoiled from just south of the 1.33 handle and shook hands with December’s opening level on the H4 timeframe at 1.3235. WTI rebounded strongly yesterday to highs of $52.28, consequently reinforcing the Canadian dollar and weighing on its US counterpart.
In spite of yesterday’s retreat, though, the technical landscape remains optimistic, according to our studies.
For weekly traders, support at 1.3223 is currently offering a floor to base potential longs from. The next upside objective from this point falls in at 1.3434: the 2017 yearly opening level. Closer analysis of this market on the daily timeframe reveals the unit shook hands with a daily Quasimodo support at 1.3181 last week. This level, as you can see, is situated just south of the current weekly support level. As long as the buyers continue to defend the said supports, the next port of call to the upside from here falls in around trend line support-turned resistance (extended from the low 1.2782).
Areas of consideration:
Although both weekly and daily structure suggest buyers govern movement at the moment, entering long on the H4 timeframe is, as highlighted in Tuesday’s briefing, precarious. Not only do we have to contend with nearby resistance at the 1.33 handle, there’s also another layer of resistance positioned directly overhead at 1.3329.
With the above in mind, the research team feels waiting for a H4 close to form above 1.3329 before looking to buy this market is a logical path to explore. This would not only confirm bullish intent on the bigger picture, it’d also clear upside on the H4 scale towards 1.34ish which aligns nicely with the daily trend line support-turned resistance highlighted above.
Aggressive traders will likely enter on the close of a H4 breakout candle above 1.3329 and locate stops beneath the candlestick’s tail. Conservative traders, on the other hand, may opt to wait and see if a retest of 1.3329/1.33 takes shape (red arrows) before pulling the trigger (stop-loss orders can be positioned below the rejecting candle’s tail or beneath 1.33).
Today’s data points: Limited.
USD/CHF:
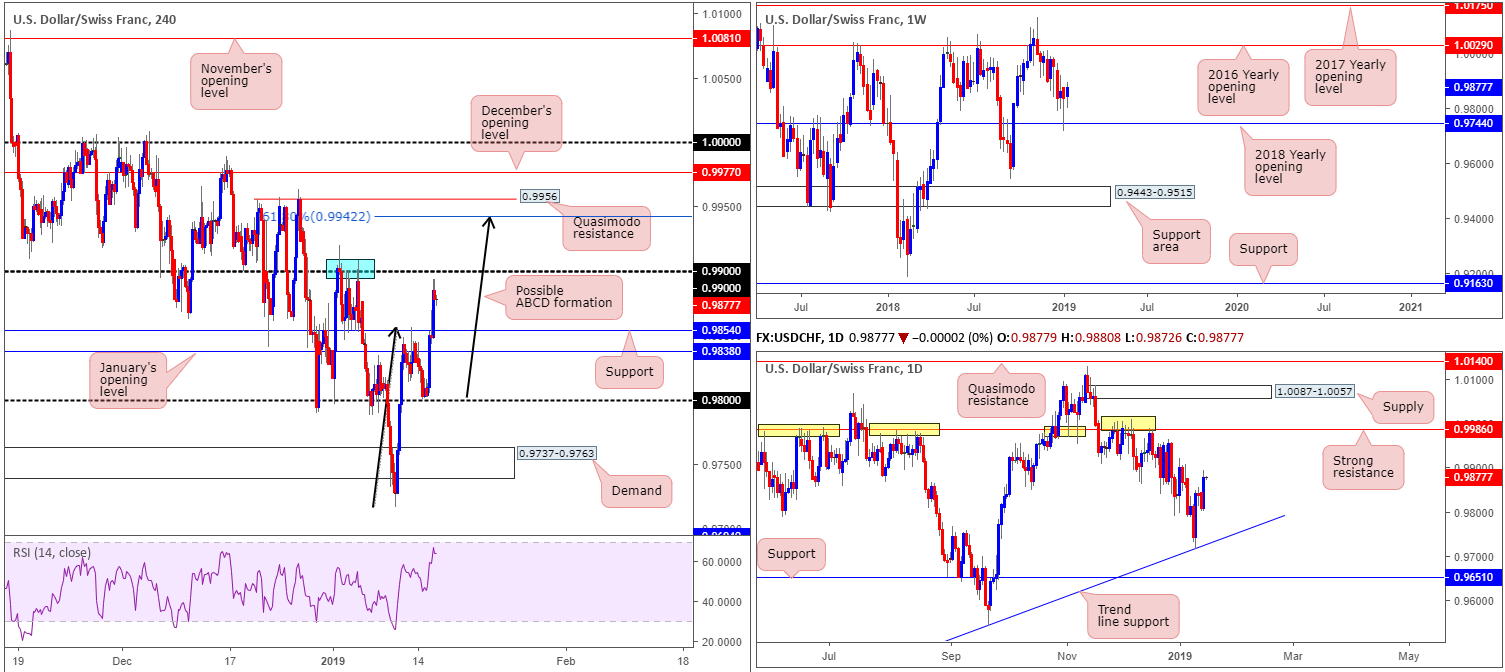
Improved market sentiment and a robust US dollar across the board bolstered the USD/CHF amid trade Tuesday. Leaving the 0.98 handle unchallenged on the H4 timeframe, the pair rotated northbound and reclaimed both January’s opening level at 0.9838 and resistance at 0.9854 (now acting support) to the upside. The next area of resistance falls in at its 0.99 handle, which, as you can see, served the market well at the beginning of the year (blue). Beyond 0.99, on the other hand, a possible ABCD (black arrows) 161.8% formation completes just south of a Quasimodo resistance (0.9956) at 0.9942.
Our technical reading on the weekly timeframe, however, reveals price tested its 2018 yearly opening level at 0.9744 in the shape of a bullish pin-bar formation last week and recovered in robust fashion. From this point, we see little stopping the unit from climbing to 1.0029: the 2016 yearly opening level. In terms of where we stand on the daily timeframe, the candles display room to advance as far north as resistance priced in at 0.9986, which happens to boast strong historical significance.
Areas of consideration:
Having noted both weekly and daily charts show scope for further upside, entering short from 0.99 on the H4 timeframe is a precarious move. The same could be said for the H4 Quasimodo resistance level at 0.9956, despite being complemented by an ABCD approach just beneath it at 0.9942.
Intraday longs above 0.99 are an option given what we’re drawing from the higher timeframes, though do take into account the noted H4 Quasimodo resistance level could very well hamper upside.
Should your trading methodology point to shorts around the noted H4 Quasimodo resistance level, waiting for additional bearish candlestick confirmation to form is an option. This will provide traders entry and stop levels and also display whether or not active sellers reside around the area before pulling the trigger.
Today’s data points: Limited.
Dow Jones Industrial Average:
Outlook unchanged
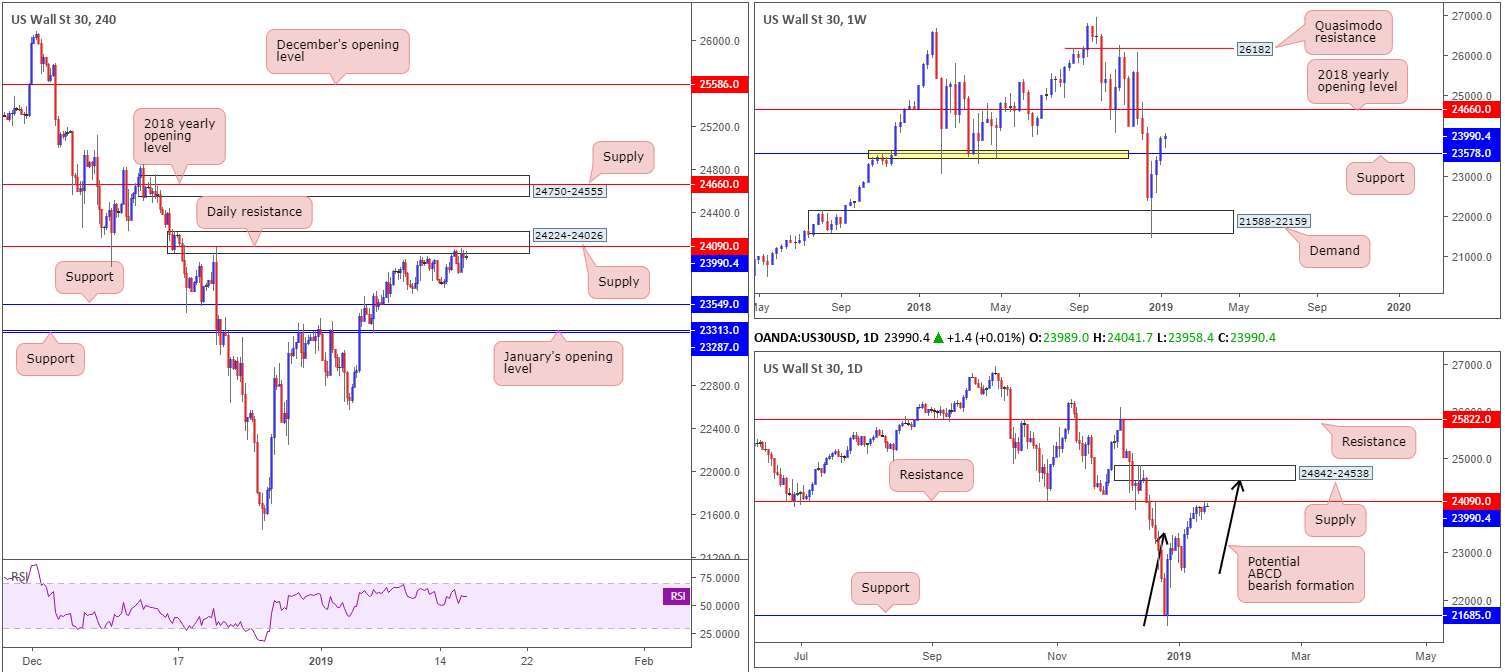
US equity indexes concluded Tuesday in positive territory despite poor fourth-quarter earnings figures reported by Wells Fargo and JPMorgan. The H4 candles, however, remained capped by supply drawn from 24224-24026. What’s interesting about this area from a technical perspective, as underlined in Tuesday’s briefing, is it engages with daily resistance coming in at 24090. As a result, the index could still observe a pullback take shape from this area.
An alternative to the aforementioned H4 supply is another layer of H4 supply seen at 24750-24555. This area houses the 2018 yearly opening level on the weekly timeframe at 24660, and is firmly positioned within the walls of a daily supply zone at 24842-24538. In addition to this, the daily supply has the added bonus of being accompanied by a daily ABCD approach (black arrows).
Areas of consideration:
On account of the above, there are two clear supply areas worthy of attention for potential shorts: 24224-24026 and 24750-24555. As emphasized above, both zones display higher-timeframe convergence, though the upper area at 24750-24555 has the edge in terms of confluence, according to our technical drawings. That does not mean to say the lower H4 supply at 24224-24026 will not force price to lower levels, though. To help avoid an unnecessary loss, however, it might be worth considering entering on the back of bearish candlestick confirmation. This not only offers traders a defined entry and exit point, it also shows whether or not sellers are active.
The first take-profit target from 24224-24026 falls in around H4 support at 23549.
Today’s data points: Limited.
XAU/USD (Gold):
Outlook unchanged
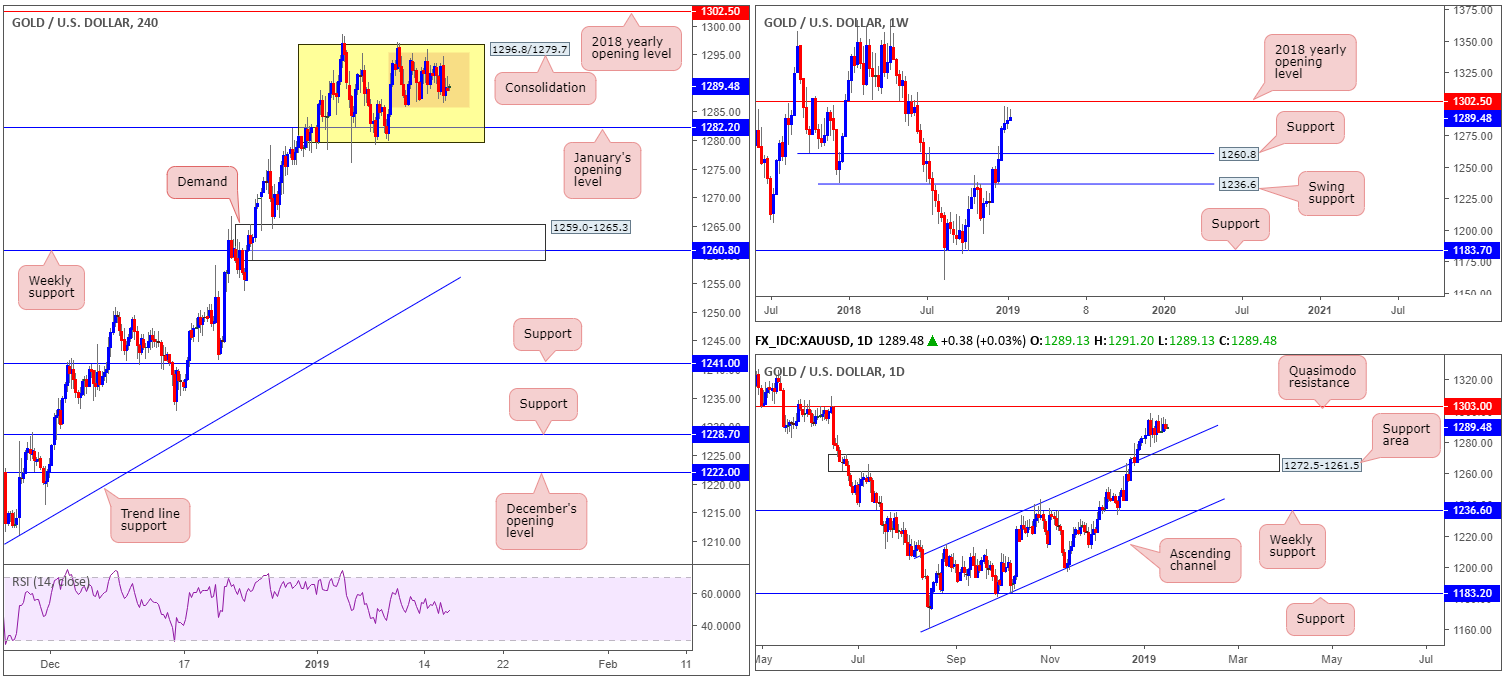
Bullion, once again, offered little to shout about Tuesday, ranging between 1295.4/1285.8: a small H4 consolidation (brown) that begun forming Thursday last week. Traders may also want to acknowledge the surrounding landscape, molded in the shape of larger consolidation (yellow) seen at 1296.8/1279.7. Inside the lower limits of this range, it’s also worth keeping an eye on January’s opening level at 1282.2 as this number could serve as support at a point over the coming week.
Beneath 1296.8/1279.7, space for the sellers to stretch their legs towards H4 demand plotted at 1259.0-1265.3 is visible, which happens to fuse nicely with weekly support at 1260.8. Note this H4 demand is also sited within the lower limits of the daily support area coming in at 1272.5-1261.5. It might also be worth mentioning before we reach the aforementioned H4 demand, daily buyers may try to defend the channel resistance-turned support (etched from the high 1214.3) that’s positioned just north of the said daily support area.
Above the current H4 range, however, we have the 2018 yearly opening level positioned nearby at 1302.5 (weekly timeframe), shadowed closely by a daily Quasimodo resistance at 1303.0.
Areas of consideration:
Over the past week, the yellow metal has served well as a range trader’s sanctuary on the H4 scale. Given the recent strength of gold over the past couple of weeks, however, a break of this range to the upside is possible this week. Should this come to fruition, traders’ crosshairs will likely be fixed on the 2018 yearly opening level mentioned above at 1302.5/daily Quasimodo resistance for medium/long-term short positions. Irrespective of this forecast, though, range traders will likely continue taking advantage of gold’s medium-term position until the extremes of the H4 range (yellow) are violated.
For those interested in trading the current H4 ranging motion, the research team recommends waiting for additional confirmation to form before pulling the trigger. A bullish/bearish candlestick signal would suffice. This not only offers traders a defined entry and exit point, it also shows whether or not buyers/sellers are active.
The use of the site is agreement that the site is for informational and educational purposes only and does not constitute advice in any form in the furtherance of any trade or trading decisions.
The accuracy, completeness and timeliness of the information contained on this site cannot be guaranteed. IC Markets does not warranty, guarantee or make any representations, or assume any liability with regard to financial results based on the use of the information in the site.
News, views, opinions, recommendations and other information obtained from sources outside of www.icmarkets.com.au, used in this site are believed to be reliable, but we cannot guarantee their accuracy or completeness. All such information is subject to change at any time without notice. IC Markets assumes no responsibility for the content of any linked site. The fact that such links may exist does not indicate approval or endorsement of any material contained on any linked site.
IC Markets is not liable for any harm caused by the transmission, through accessing the services or information on this site, of a computer virus, or other computer code or programming device that might be used to access, delete, damage, disable, disrupt or otherwise impede in any manner, the operation of the site or of any user’s software, hardware, data or property.


