
Key risk events today:
Eurozone, UK and US Flash Manufacturing and Services PMIs; OPEC-JMMC Meetings; Canada CPI m/m; US Core Retail Sales m/m and Retail Sales m/m; FOMC Economic Projections; FOMC Statement, Federal Funds Rate and Press Conference; New Zealand GDP q/q.
(Previous analysis as well as outside sources – italics).
EUR/USD:
The soft tone surrounding the USD observed a modest EUR/USD bid Tuesday though remained south of YTD tops.
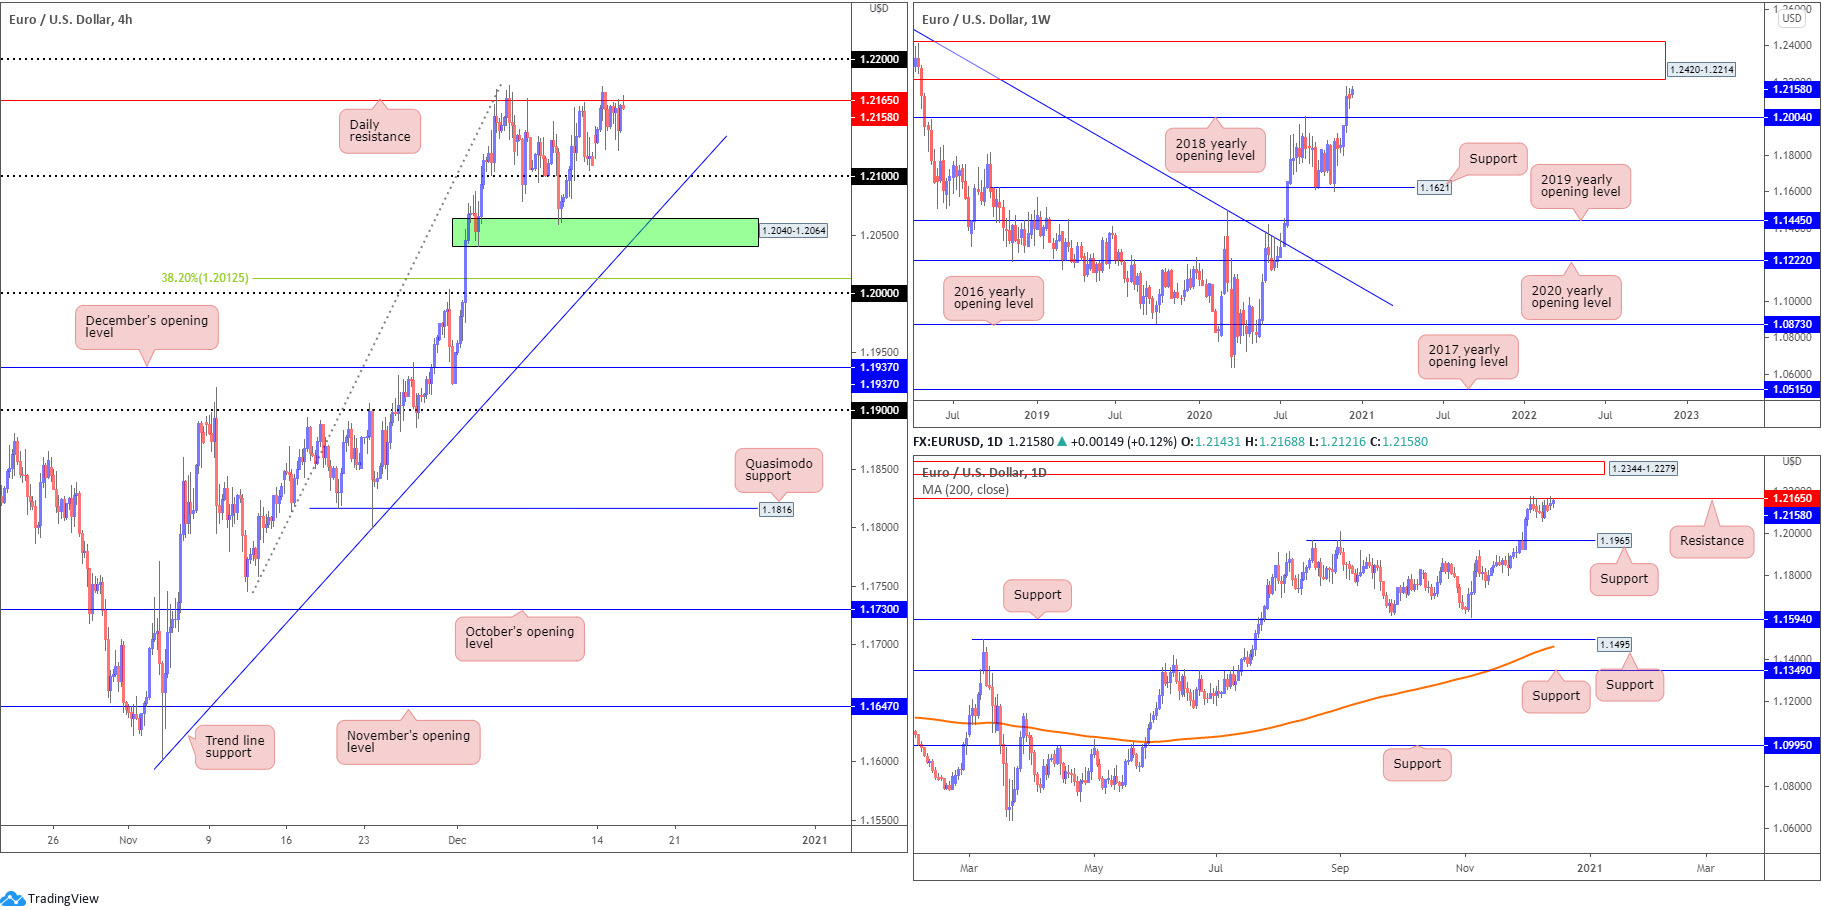
In similar fashion to Tuesday’s technical briefing, H4 is seen clinging to daily resistance at 1.2165, a level that made an appearance at the beginning of December.
North of the aforementioned daily resistance, fresh YTD peaks and the 1.22 handle calls for attention on the H4 scale. Lower, 1.21 is seen, followed by demand plotted at 1.2040-1.2064 and trend line support, extended from the low 1.1602.
The technical picture on the weekly chart reveals EUR/USD recently overwhelmed the 2018 yearly opening value at 1.2004, drawing out supply at 1.2420-1.2214. In terms of trend, it seems upside remains favoured, more so if price overthrows the 1.2555 February 12 high (2018). The above implies buyers could remain at the wheel until testing the aforementioned supply zone.
Before reaching weekly supply, however, buyers must contend with daily resistance mentioned above at 1.2165. A solid rejection here shines the spotlight on support at 1.1965, a previous Quasimodo resistance. A 1.2165 break, on the other hand, swings the pendulum in favour of a run to supply drawn from 1.2344-1.2279 (sited within the parapets of current weekly supply).
Areas of consideration:
Outlook unchanged due to lacklustre movement on Tuesday.
- The uptrend remains healthy, seen clearly from both the weekly and daily timeframes.
- Daily resistance at 1.2165 offers an immediate level to work with – important due to the number of times buyers failed to overthrow the barrier.
- H4 demand at 2040-1.2064, in addition to trend line support, is an interesting zone to be mindful of. Though pushing beyond these areas shines the spotlight on 1.20 and nearby 38.2% H4 Fibonacci level at 1.2012.
- 1 22 is also a significant ceiling to watch, one which could entice sellers. A mild fakeout above the level, a whipsaw that not only taps into any buy-stops above 1.22 but also tests the underside of weekly supply at 1.2214 (potentially strong offers), unlocks the possibility of fresh sellers making an appearance.
GBP/USD:
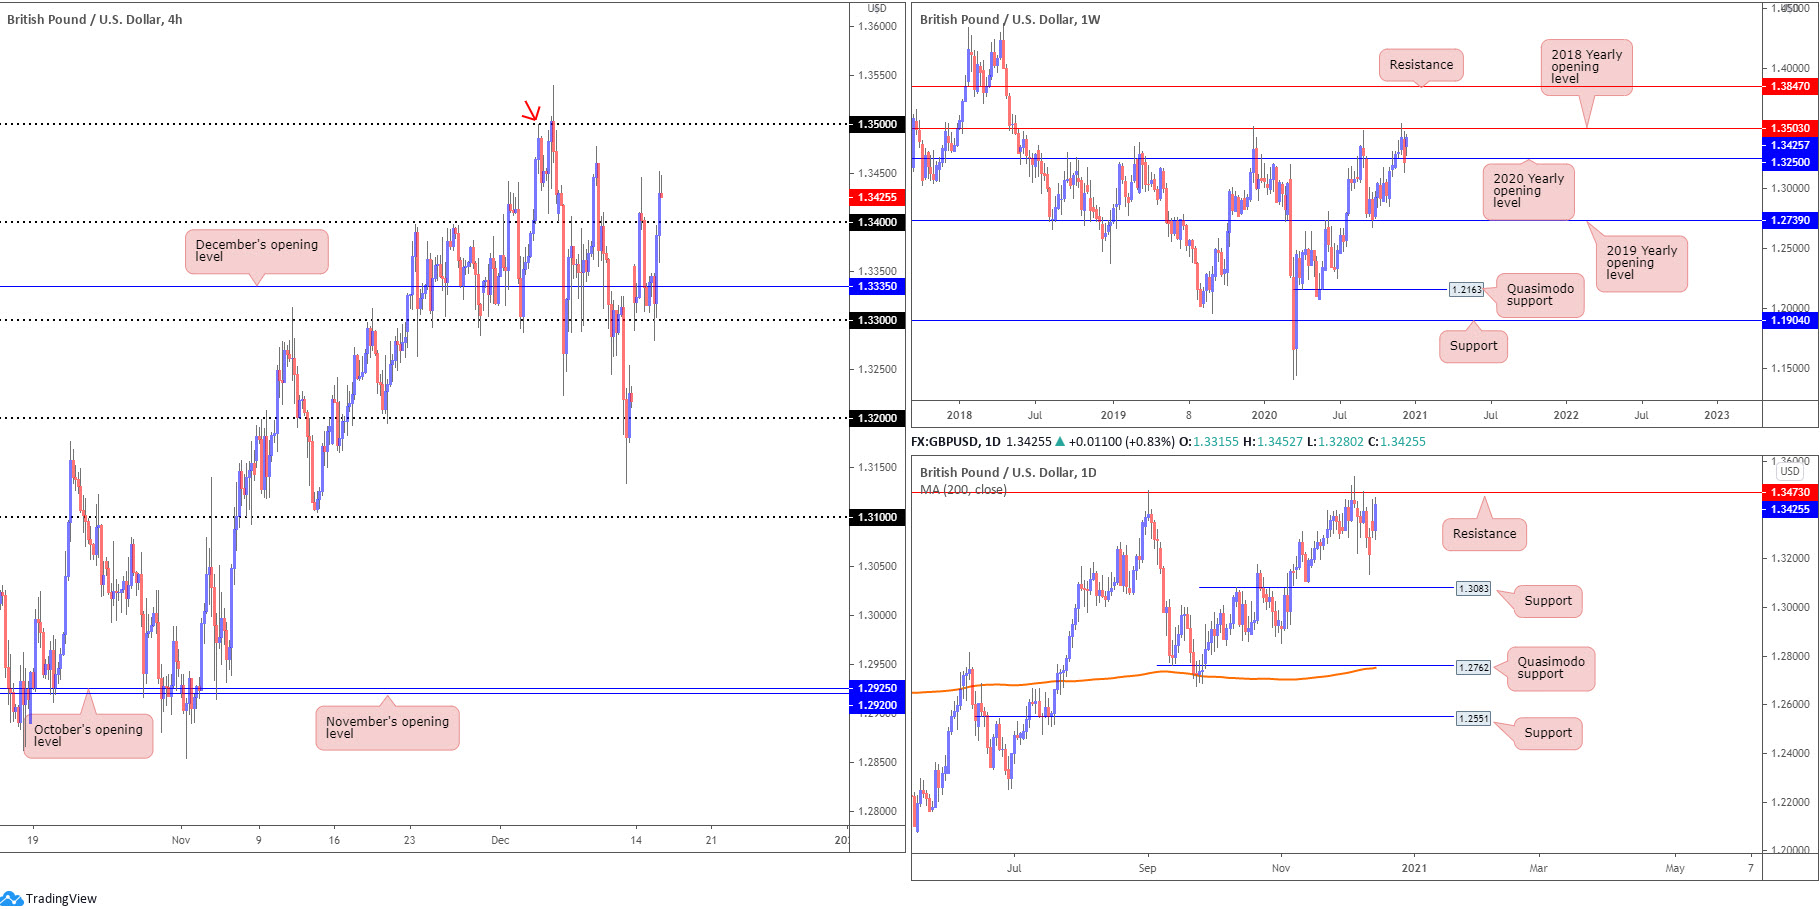
Headlines inferring UK and EU negotiators close in on a trade deal elevated GBP/USD Tuesday. Following a rebound off the 1.33 handle, the pair overthrew December’s opening value at 1.3335 on the H4 and also the 1.34 border. Clearing 1.34 shines the spotlight on last Wednesday’s high at 1.3477, closely followed by the 1.35 level, a round number merging with a H4 Quasimodo resistance (red arrow) and weekly resistance at 1.3503 (the 2018 yearly opening value). From the weekly timeframe, we can also see buyers have clearly governed direction since early 2020.
Before stretching for the 1.35 neighbourhood on the H4, however, buyers must contend with daily resistance pegged at 1.3473.
Areas of consideration:
- Retesting the 1.34 handle on the H4 today could have buyers make an appearance, targeting daily resistance at 1.3473, followed by 1.35 (weekly resistance).
- The 1.35 region is interesting resistance, merging closely with H4 Quasimodo resistance, weekly resistance at 1.3503 and daily resistance found at 1.3473.
AUD/USD:
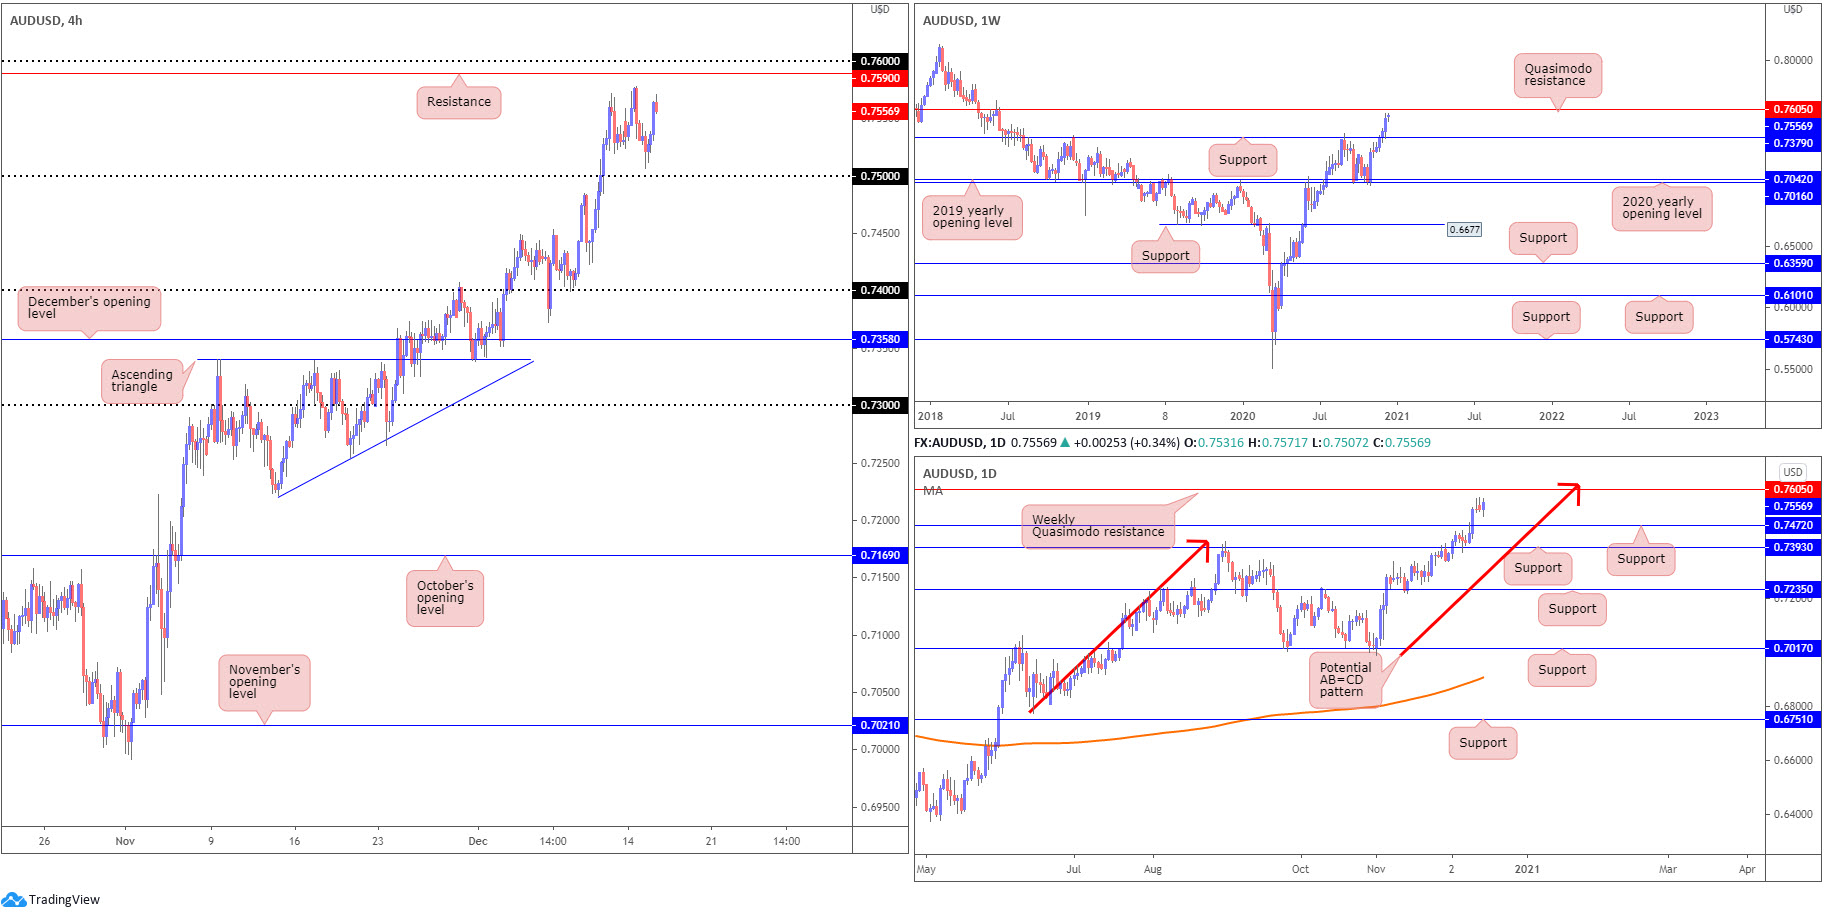
Upbeat risk sentiment, along with the US dollar index combing lower territory, boosted demand for AUD/USD Tuesday. Technically, the pair discovered fresh legs north of the 0.75 handle on the H4 scale and is on course to challenge YTD peaks. Further buying throws the 0.7590 point in the mix as possible resistance, closely shadowed by 0.76.
Higher timeframe structure unchanged (italics):
From the weekly timeframe, last week’s action decorated the weekly chart with another cheerful candle. Following a retest of support at 0.7379, the pair recorded a fourth consecutive weekly advance. In view of this market trending higher since early 2020, buyers may be eyeballing Quasimodo resistance parked at 0.7605.
Despite two back-to-back shooting star candle patterns, formed off YTD highs, sellers have yet to show signs of committing. Should sellers gain consciousness, this could prompt mild downside, possibly driving a retest at support drawn from 0.7472. North of price, weekly Quasimodo resistance mentioned above at 0.7605 is seen, accompanied by a daily AB=CD approach (red arrows) at 0.7624.
Areas of consideration:
Outlook unchanged due to lacklustre movement on Tuesday.
- The combination of daily support at 0.7472 and the 0.75 handle on the H4 represents possible support, in the event another retreat develops.
- 76 on the H4 echoes robust resistance, placed nearby H4 resistance at 0.7590 and weekly Quasimodo resistance at 0.7605.
USD/JPY:
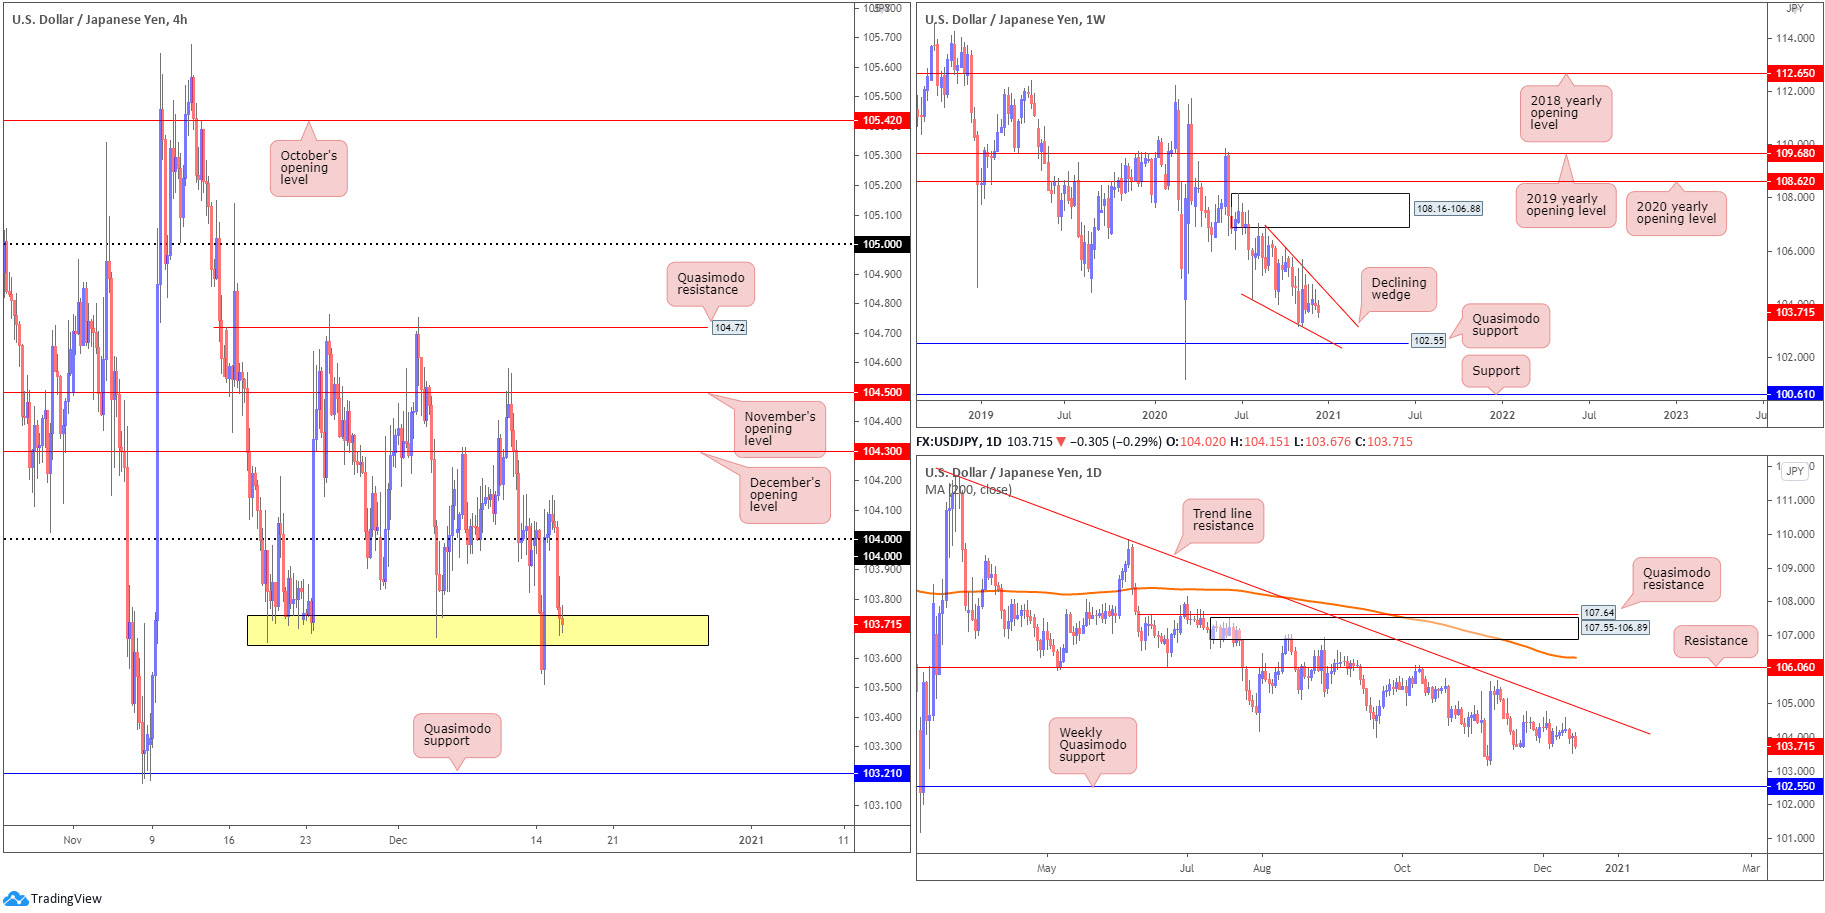
Despite Monday’s impressive recovery, movement that secured a H4 close north of the 104 handle, bids were unable to hold back selling Tuesday. Reclaiming 104 to the downside, the H4 candles are now shaking hands with support around the 103.70 region (yellow). In view of Monday’s whipsaw through 103.70 potentially clearing out bids, its unlikely buyers will be keen here. A H4 close south of 103.70, therefore, could prompt a bearish scenario towards Quasimodo support priced in at 103.21.
Based on the weekly timeframe, limited change is seen:
Since connecting with the underside of weekly supply at 108.16-106.88 in August, price has gradually shifted lower and developed a weekly declining wedge (106.94/104.18). Quasimodo support at 102.55 is also in the picture, with a break revealing support plotted at 100.61. A strong bounce from 102.55, however, may provide enough impetus for buyers to attempt a breakout above the current declining wedge.
From the daily timeframe, the technical landscape reveals possible support lurking around the 103.17 November 6 low (set just under H4 Quasimodo support at 103.21), followed by the noted weekly Quasimodo support at 102.55.
Areas of consideration:
- With buyers squeezed around H4 support at 103.70, a move beneath 104 today may provoke fresh selling to H4 Quasimodo support at 103.21. Conservative sellers will also likely welcome a retest to the underside of the 103.70 region.
USD/CAD:
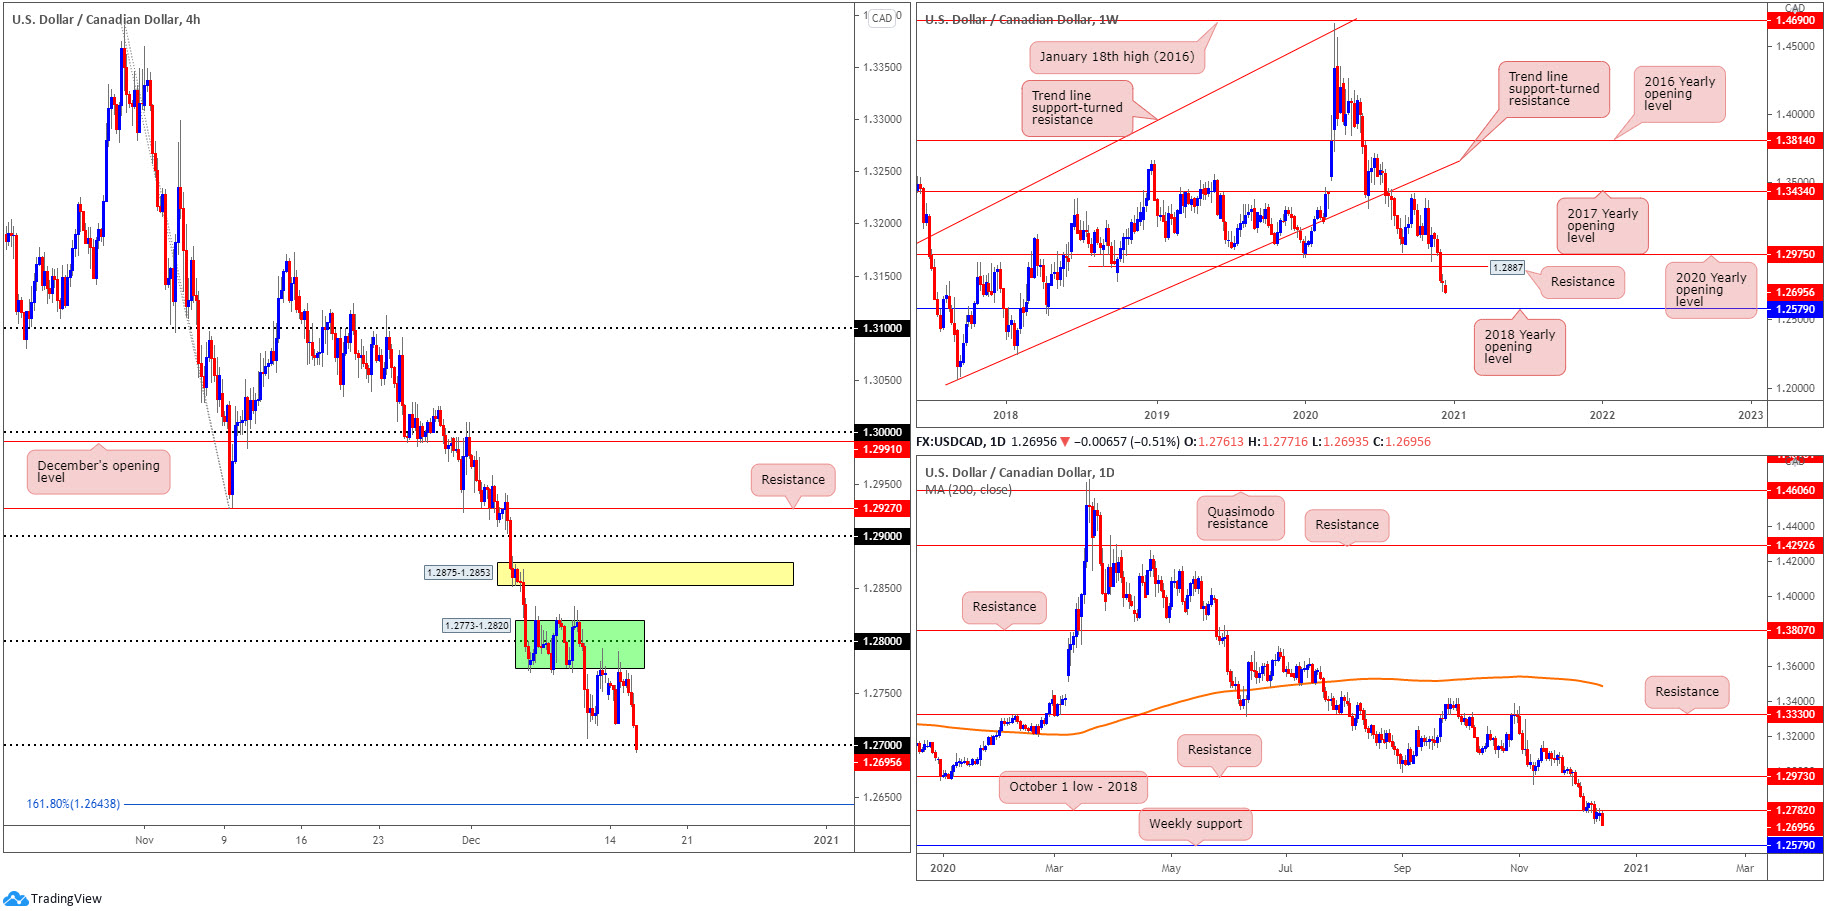
Kicking things off from the top this morning, recent weeks witnessed weekly price elbow through the 2020 yearly opening value at 1.2975 and Quasimodo support coming in at 1.2887. With both 1.2975 and 1.2887 depicting resistance, sustained downside places the 2018 yearly opening value at 1.2579 in the firing line. Also important to note is that long-term flow has been pointing lower since topping in March.
In conjunction with the weekly timeframe, last week’s selling set aside bids at daily support from 1.2782 (October’s low, 2018), consequently enhancing the weekly timeframe’s bearish stance towards the 2018 yearly opening value.
In recent hours, H4 is seen attempting to derail any bids off the 1.27 handle, following Monday’s retest at the underside of the H4 range at 1.2773. A break of 1.27, as you can probably see, exposes the 161.8% Fibonacci projection point at 1.2643.
Areas of consideration:
- Should H4 secure position south of the 1.27 handle, this will likely have sellers change gears and push for at least the 161.8% Fibonacci projection point at 1.2643 on the H4 scale today. Follow-through selling beyond 1.2643 is also possible, according to the higher timeframes, suggesting 1.26 could be on the table, followed by weekly support at 1.2579 (the 2018 yearly opening value).
USD/CHF:
Although USD/CHF edged lower Tuesday, volatility was uninspiring. For that reason, much of the following analysis will echo thoughts aired in Tuesday’s technical briefing.
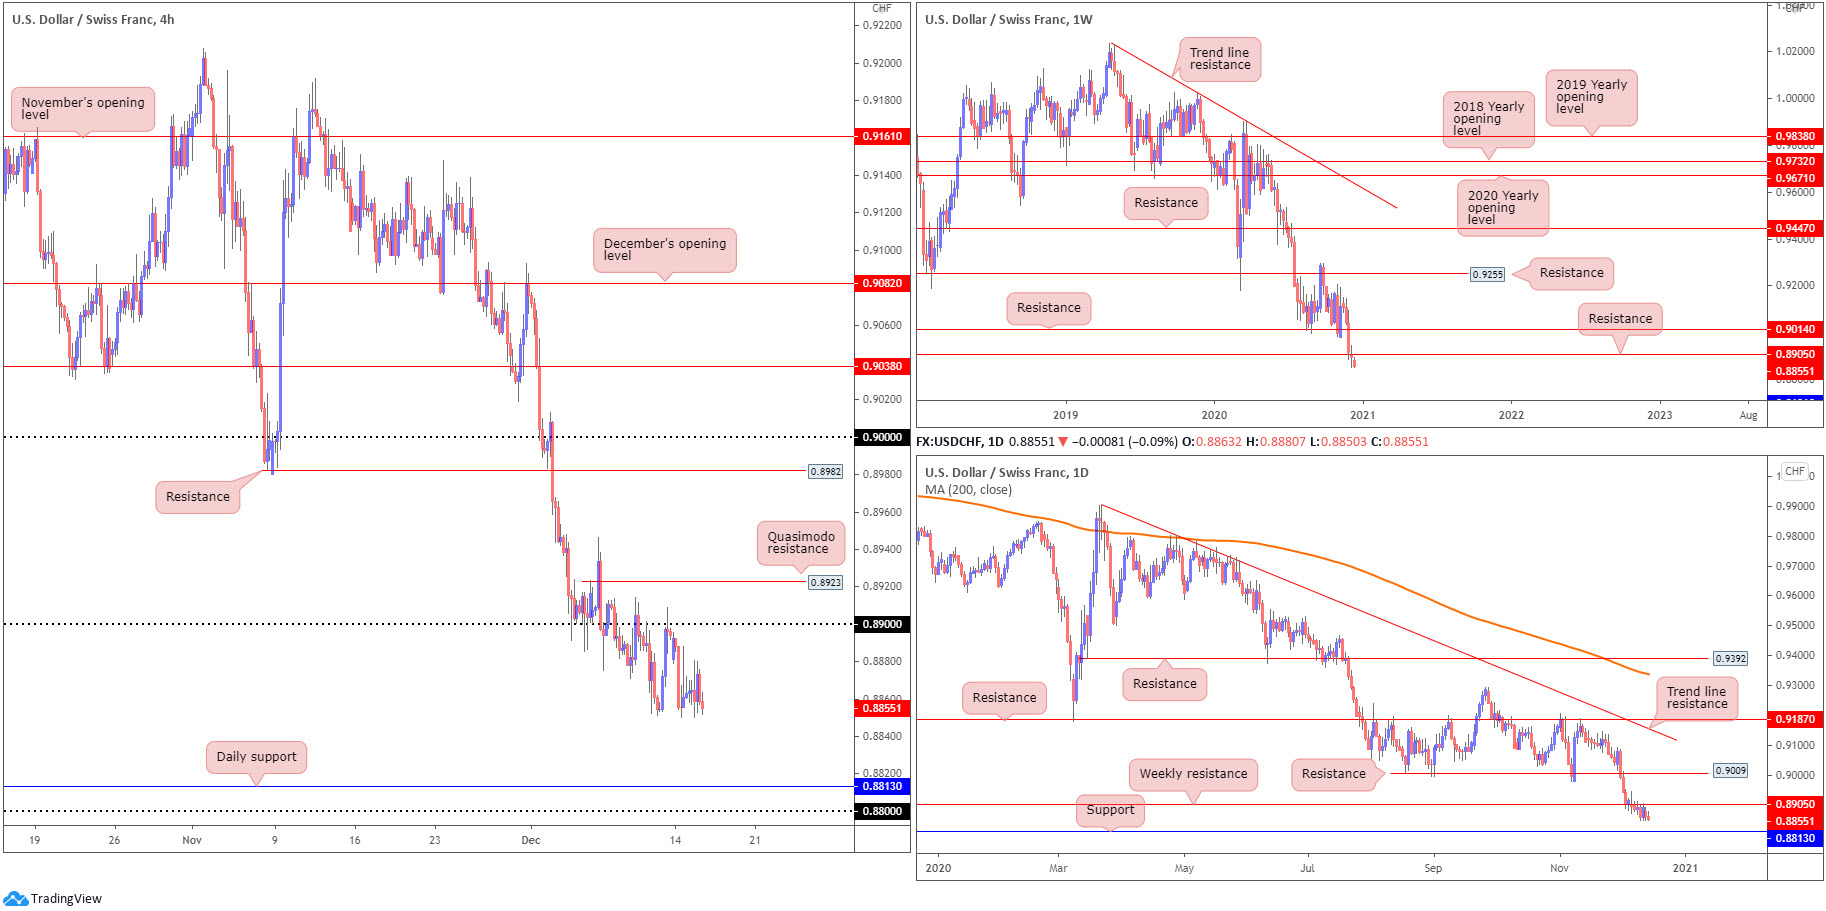
As evident from the H4 chart, sellers remain circling YTD troughs around 0.8850. Violating this region today will have bearish eyes perhaps hone in on daily support at 0.8813, and the 0.88 handle based on the H4.
The technical landscape on the weekly timeframe shows price drifting around the underside of resistance from 0.8905. While buyers could still attempt a recovery, traders are urged to pencil in the possibility of refreshing multi-year lows and shining the limelight on support at 0.8696. Interestingly, the trend in this market has been lower since early 2019.
The framework on the daily timeframe reveals candle action languishing under weekly resistance at 0.8905. Below 0.8905 on the daily scale, however, support is seen at 0.8813.
Areas of consideration:
Outlook unchanged due to lacklustre movement on Tuesday.
- All three timeframes indicate thin buy-side liquidity until reaching 0.88ish, therefore bearish strategies could potentially form south of the 0.8850 point, targeting 0.88.
Dow Jones Industrial Average:
Optimism surrounding stimulus talks led US equity benchmarks higher on Tuesday, with the Nasdaq concluding at a record peak. The Dow Jones Industrial Average added 337.76 points, or 1.13%; the S&P 500 advanced 47.13 points, or 1.29% and the Nasdaq rallied 155.02 points, or 1.25%.
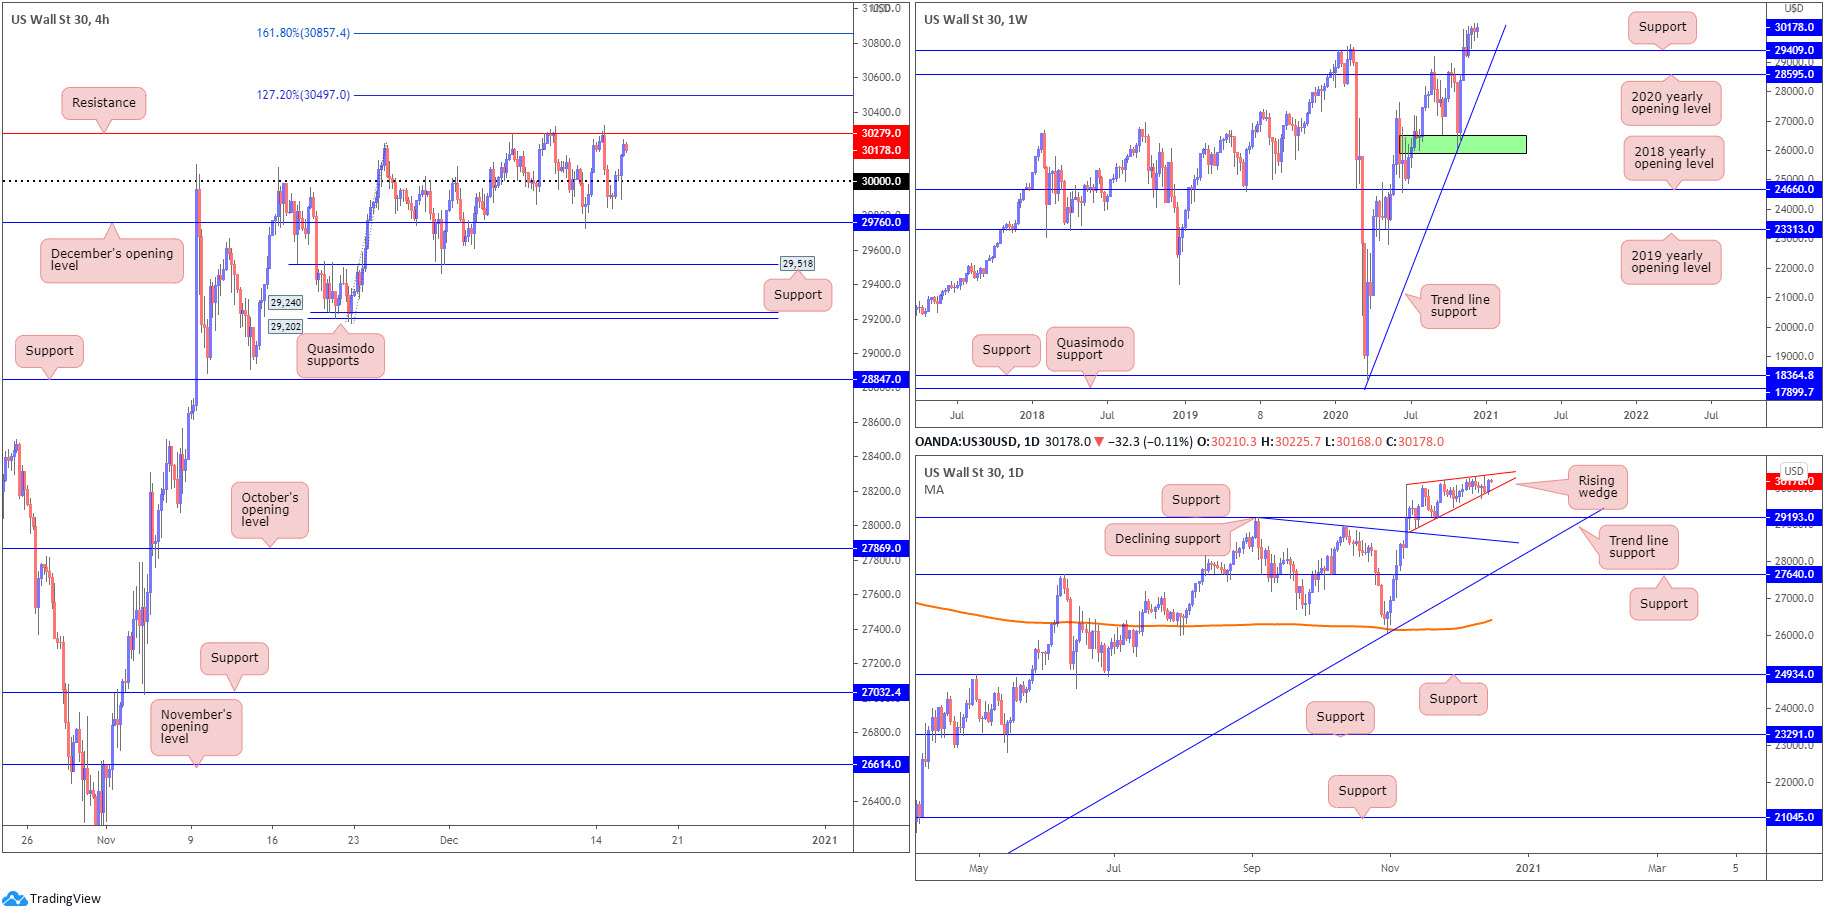
Ahead of December’s opening value at 29,760 H4 made its way back above the 30,000 figure in recent trading, with price poised to test resistance at 30,279. Clearing the latter not only calls for fresh all-time highs, it also shines the spotlight on the 127.2% and 161.8% Fibonacci projection points at 30,497 and 30,857, respectively.
Further out on the weekly timeframe, we can see that should the unit correct, support at 29,409 (prior Quasimodo resistance) could be an area dip-buyers find interest in. The 2020 yearly opening value from 28,595 is also in the frame, tied together with trend line support, taken from the low 18,213. According to the daily timeframe, support is seen at 29,193. Pattern traders may also acknowledge the rising wedge forming between 28,940/30,097.
Areas of consideration:
- Retesting 30,000 may draw buyer interest to take on H4 resistance at 30,279, followed by 30,497 and 30,857.
- A close below the daily rising wedge pattern could see sellers force a retest at daily support from 29,193. This would take H4 through supports at 29,760 and 29,518 to test Quasimodo supports at 29,202 and 29,240.
XAU/USD (GOLD):
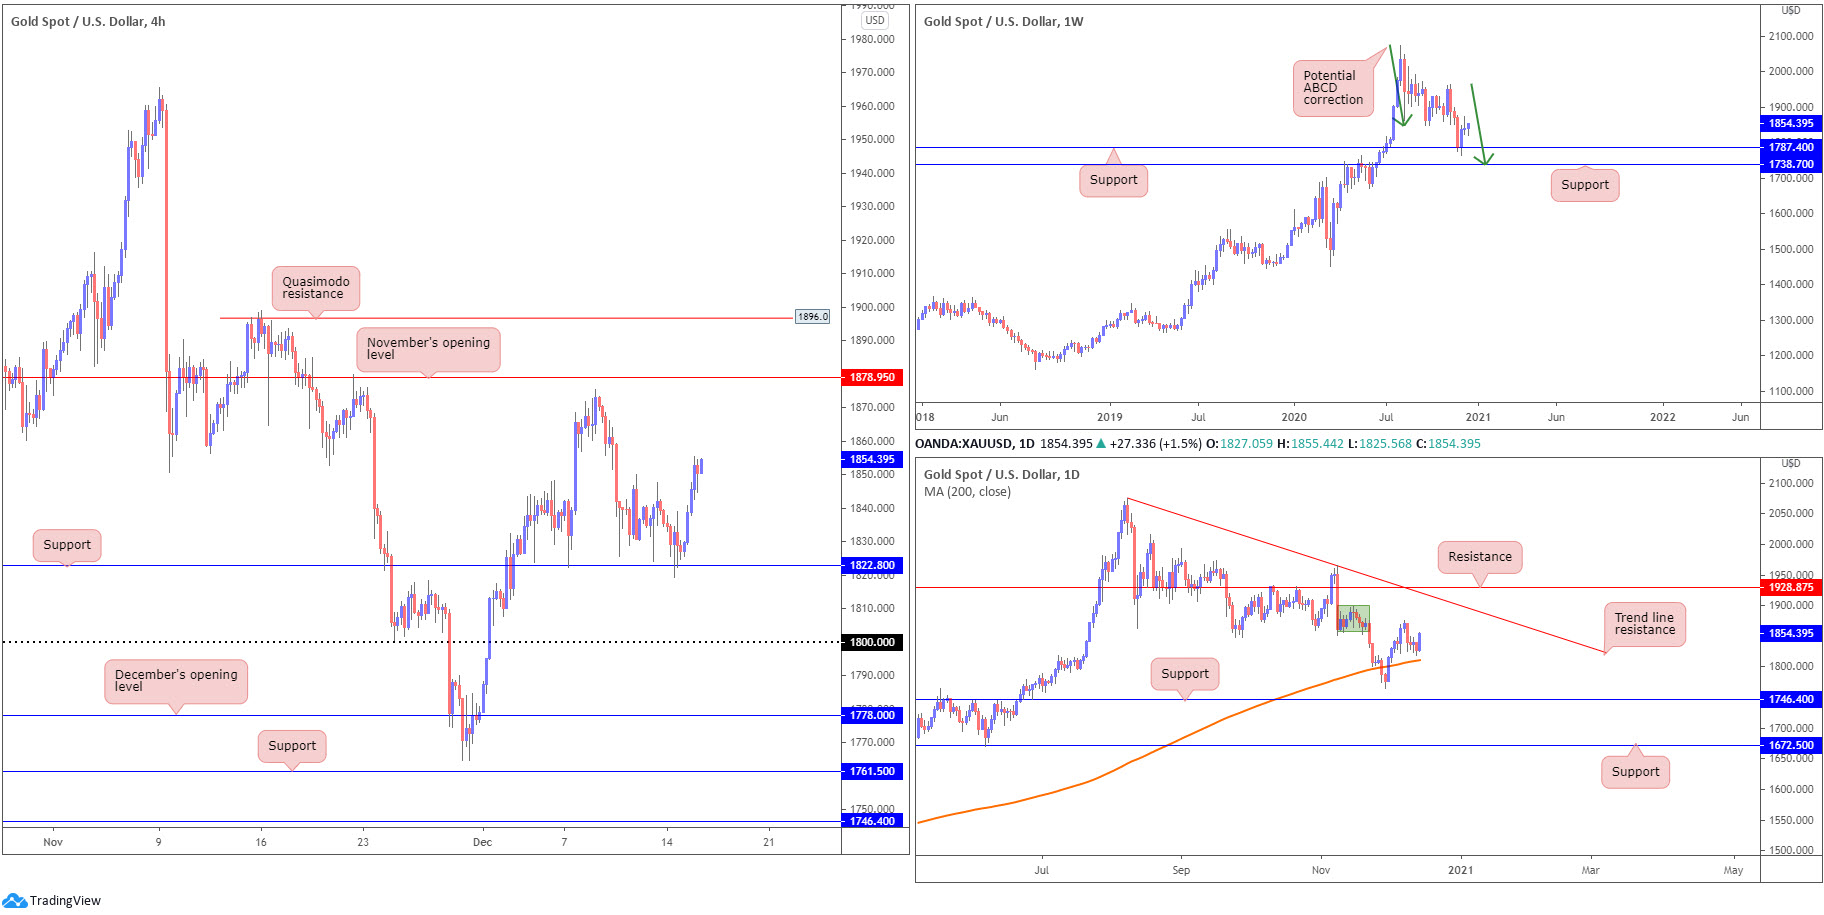
USD weakness assisted the precious metal on Tuesday, advancing nearly 1.5% on the session. Technical H4 support surfaced on Monday at $1,822, likely adding some influence to recent upside. Further buying today throws the $1,875 December 8th peak in the mix, closely shadowed by November’s opening value priced in at $1,878.
Higher up on the curve, despite last week’s action finishing significantly off best levels, weekly price is seen holding off support at $1,787 (sited ahead of another support at $1,738 and a potential ABCD correction [green arrows]). The fact the yellow metal has been decisively trending higher since the beginning of 2016 adds to the bullish narrative off $1,787.
Meanwhile, on the daily chart, yesterday’s robust bullish candle is set to challenge supply around $1,870ish (green zone), an area that contained upside last week. Below current price, traders may also acknowledge dynamic support rests close by at the 200-day SMA (orange – $1,812).
Areas of consideration:
For those who read Tuesday’s technical briefing you may recall the following (italics):
The retest at H4 support from $1,822 could entice buyers, targeting November’s opening value at $1,878. However, a $1,822 breach could lead to a test of the 200-day SMA as possible support ($1,810), hovering ahead of $1,800.
- With H4 support at $1,822 proving effective, buyers end Tuesday on a strong footing, perhaps eyeing the $1,878 region today. As stated in the weekly technical briefing released Monday, buying could potentially stretch beyond $1,822, according to the current uptrend and weekly support at $1,787 recently making an appearance.
The accuracy, completeness and timeliness of the information contained on this site cannot be guaranteed. IC Markets does not warranty, guarantee or make any representations, or assume any liability regarding financial results based on the use of the information in the site.
News, views, opinions, recommendations and other information obtained from sources outside of www.icmarkets.com.au, used in this site are believed to be reliable, but we cannot guarantee their accuracy or completeness. All such information is subject to change at any time without notice. IC Markets assumes no responsibility for the content of any linked site.
The fact that such links may exist does not indicate approval or endorsement of any material contained on any linked site. IC Markets is not liable for any harm caused by the transmission, through accessing the services or information on this site, of a computer virus, or other computer code or programming device that might be used to access, delete, damage, disable, disrupt or otherwise impede in any manner, the operation of the site or of any user’s software, hardware, data or property


