
Key risk events today:
MPC Member Saunders Speaks; UK CPI y/y; UK PPI Input m/m; US Core PPI m/m and PPI m/m; Crude Oil Inventories; FOMC Members Harker and Kaplan Speak.
(Italics represents previous analysis)
EUR/USD:
Although ranging more than 40 points on the session between 1.1144/1.1104, Tuesday concluded pretty much sideways. Intraday, a dip to lows just north of the 1.11 handle occurred, though price action swiftly recovered and traded to 1.1120+ amid US hours.
On the data front, the Consumer Price Index for All Urban Consumers (CPI-U) rose 0.2 percent in December on a seasonally adjusted basis after rising 0.3 percent in November, according to the US Bureau of Labour Statistics. The index for all items less food and energy rose 0.1 percent in December after increasing 0.2 percent in November.
The core metric reported a less-than-expected figure.
Traders who read Friday’s analysis may recall the following:
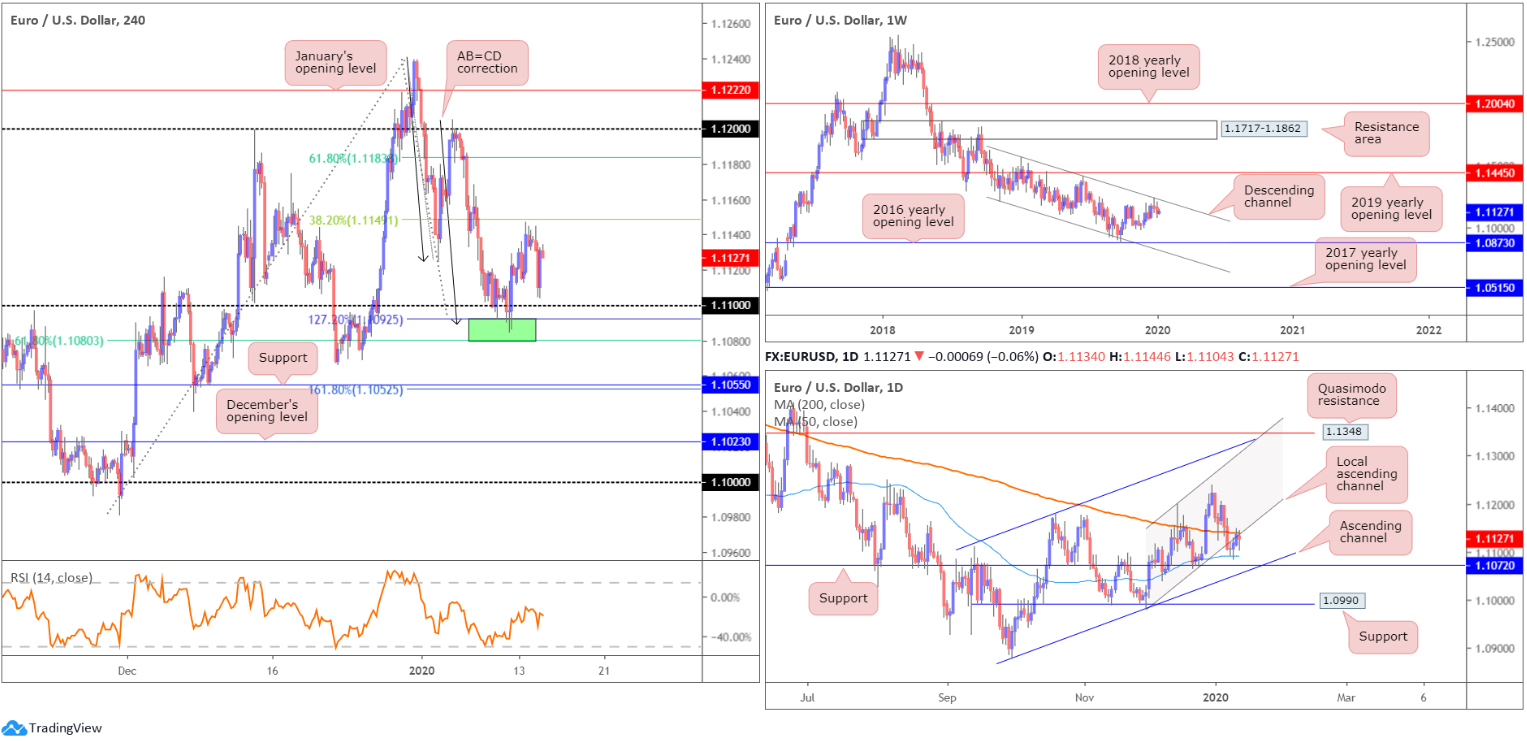
As of current price, buyers and sellers are squaring off a touch below the 1.11 handle on the H4 timeframe. As a result, a portion of sell stops beneath this psychological barrier have likely been tripped. Interestingly, though, the area between 1.1080/1.1092 (green), a 61.8% H4 Fibonacci retracement and a 127.2% AB=CD bullish correction, is likely to hamper downside. This, particularly for shorter-term traders, is an appealing reversal zone, given the liquidity generated from the filled sell stops. In addition to this, the setup boasts RSI (relative strength index) confirmation in the form of an oversold signal (pink).
The combination of stop-taking beneath 1.11, the H4 AB=CD reversal zone at 1.1080/1.1092, RSI confirmation and the 50-day SMA (on the daily timeframe) is likely sufficient to tempt buyers into the market today, at least for an intraday bounce higher.
Traditional AB=CD take-profit targets favour the 38.2%/61.8% Fibonacci retracements set from legs A-D, at 1.1149 and 1.1183. Traders, however, are urged to also pencil in the 1.1125 January 3rd low as possible resistance.
As evident from the H4 chart, the 38.2% Fibonacci retracement ratio at 1.1149 came within striking distance in recent hours, likely prompting longs out of 1.11 to reduce risk to breakeven and maybe even liquidate a portion of the position. Note this level converges with the 200-day SMA (orange – 1.1139) and a local daily channel support-turned resistance, extended from the low 1.0981.
As a reminder of where we stand on the weekly timeframe, here’s what Monday’s technical briefing had to say:
Technical research has weekly movement extending losses south of long-standing channel resistance, drawn from the high 1.1569. Visible downside objectives on this timeframe fall in at the 2016 yearly opening level at 1.0873 and channel support, taken from the low 1.1109. To the upside, assuming a break of the said channel resistance, price has the 2019 yearly opening level at 1.1445 to target.
In terms of the primary trend, price has been trading lower since topping in early 2018, at 1.2555.
Areas of consideration:
Outlook unchanged due to lacklustre close.
Should the market push beyond the 38.2% H4 Fibonacci retracement ratio at 1.1149, longs will likely have eyes on the 61.8% H4 Fibonacci retracement ratio at 1.1183 for (AB=CD pattern) completion.
In the event we drive beneath the 1.11 region this week, daily support resides at 1.1072, closely trailed by H4 support at 1.1055/161.8% Fibonacci extension point at 1.1052. Therefore, navigating lower ground is problematic, with limited room to manoeuvre regarding short positions unless you drill down to the lower timeframes.
GBP/USD:
Pound sterling clawed back a portion of Vlieghe-led losses Tuesday, reclaiming 1.30+ status and adding more than 30 points, or 0.25%.
Traders who read Friday’s report may recall the following piece:
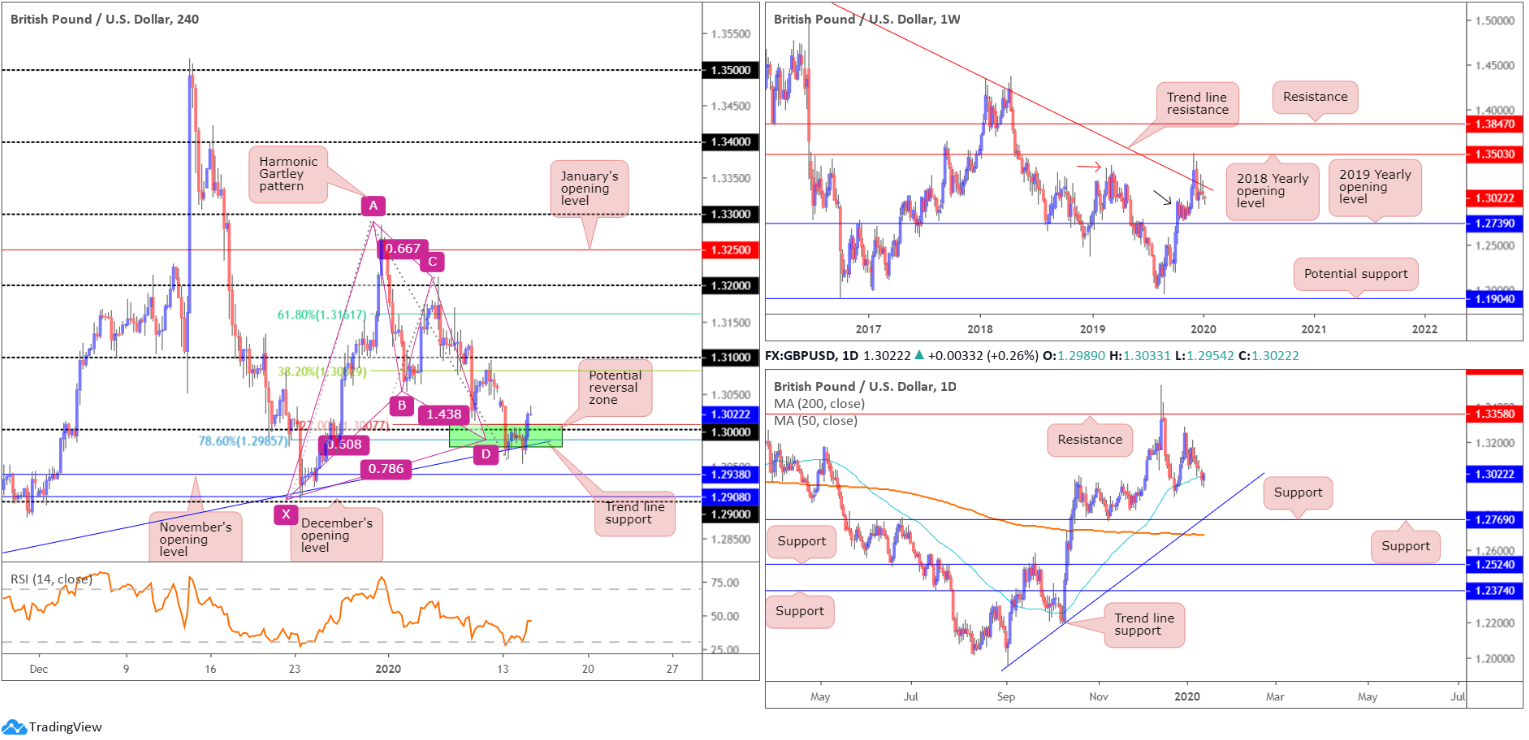
Thursday dethroned the 1.31 handle in strong fashion and bottomed a few points north of the key figure 1.30. Note (green) this level also forms together with a potential H4 harmonic Gartley pattern, boasting an AB=CD equivalent formation and a 78.6% XA retracement at 1.2985 as well as a 127.2% BC projection at 1.3007. Additionally, there’s H4 trend line support, extended from the low 1.2768.
As evident from the H4 timeframe, the harmonic Gartley pattern is holding, with price testing highs of 1.3033, as we write.
As for the weekly timeframe, little change has been seen since Monday’s report:
Sellers, by way of back-to-back shooting star bearish candlestick patterns, continued to strengthen their grip off long-standing trend line resistance last week, pencilled in from the high 1.5930. This follows a somewhat dominant whipsaw to the 2018 yearly opening level drawn from 1.3503 four weeks ago. Buyers are attempting to defend nearby demand around the 1.2939 region (black arrow), seduced by the recent break of the notable high at 1.3380 (red arrow). The fact we’re holding the current trend line, though, implies we might see a push lower to the 2019 yearly opening level at 1.2739, consequently tripping sell stops from any traders long the aforementioned demand zone.
A closer reading on the daily timeframe shows the 50-day SMA (blue – 1.3009) remains in the frame. Recent movement witnessed a minor breach of the dynamic value to lows of 1.2954, though price is currently attempting to elbow its way north. Another layer of support that may eventually enter the fight on the daily chart is 1.2769, which happens to merge closely with trend line support, pencilled in from the low 1.1958 and the 200-day SMA (orange – 1.2687). With respect to resistance, the only level of interest right now sits at the 1.3284 December 31st high and 1.3358, which capped upside since mid-June 2019.
Areas of consideration:
The H4 Gartley pattern highlighted above had an entry point around the 1.30ish region, preferably the 78.6% Fibonacci retracement at 1.2985, with stop-loss order placement set beneath the X point – the 1.29 handle. In terms of take-profit targets, traders generally favour the 38.2%/61.8% (1.3082/1.3161) Fibonacci retracements of legs A-D; reduce risk to breakeven at 38.2% and take-profit at 61.8%. However, price could extend far beyond these levels, so its always an idea to leave a portion of the position running in order to catch any excess move.
AUD/USD:
Early hours Tuesday observed a modest bid, following upbeat China trade figures for December. Overall, though, the session wrapped up unmoved, clinging to November’s opening level at 0.6892 and the 0.69 handle on the H4 timeframe.
However, as we move into today’s trade deal announcements – US and China trade representatives will end years of intense bilateral negotiations with a phase one deal today that promises billions of dollars’ worth of agricultural purchases and the beginning of reforms to China’s longstanding practice of forced technology transfer (CNBC) – market volatility is expected to increase.
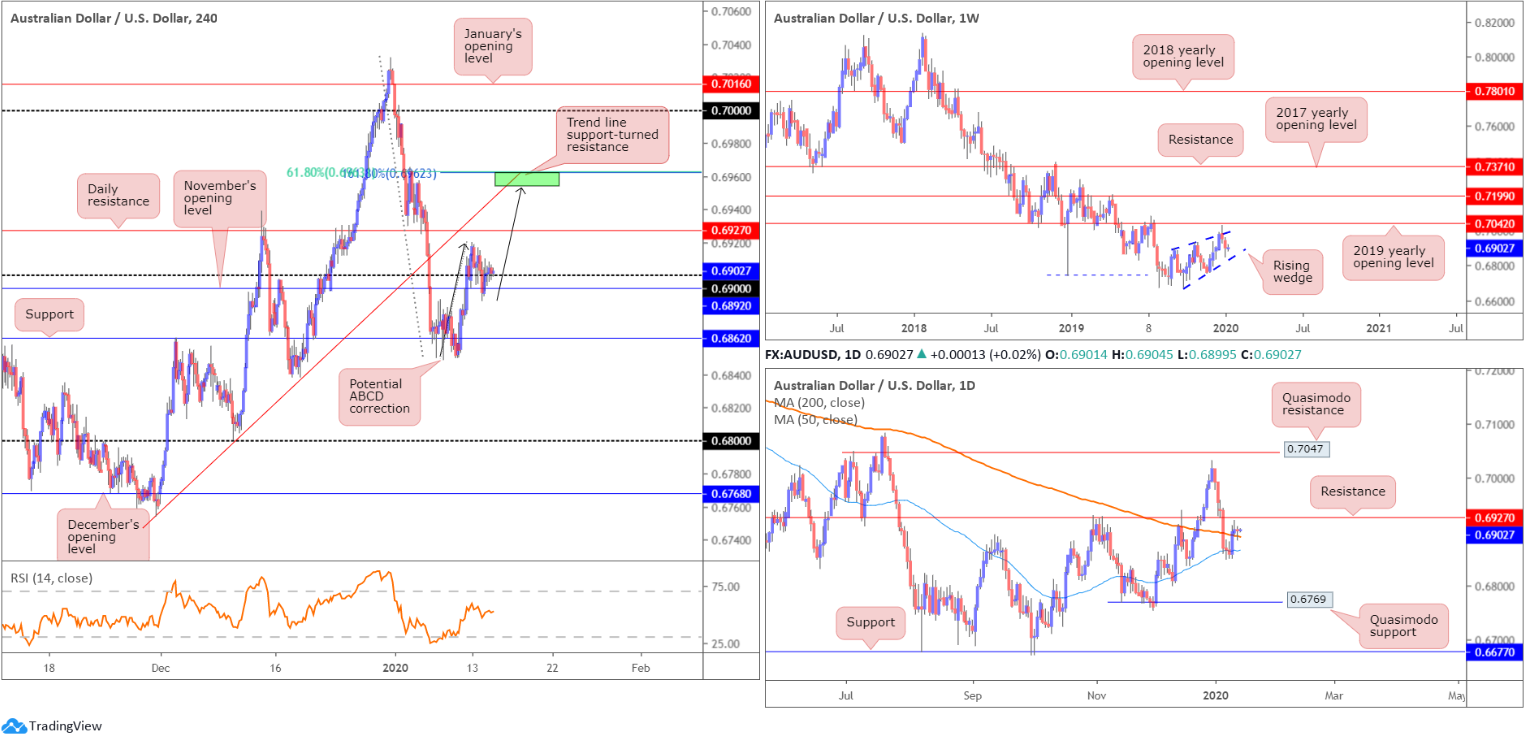
Technically speaking, 0.69 offers support on the H4 timeframe, though resistance resides nearby in the form of a daily level at 0.6927, along with a H4 trend line support-turned resistance positioned nearby, extended from the low 0.6754. Retaking November’s opening level from current price could lead to support at 0.6862 entering the fight this week.
Another point of interest on the H4 timeframe is a potential ABCD (black arrows) 161.8% correction at 0.6962 and a 61.8% Fibonacci retracement at 0.6963. Note these levels line up nicely with the said H4 trend line resistance.
The situation on the weekly and daily timeframes remains unchanged:
Since registering a bottom in late September at 0.6670, AUD/USD has been busy carving out what appears to be a rising wedge formation, typically considered a continuation pattern. Recent selling witnessed price decline back into the rising wedge, with a break lower possible given the primary downtrend in this market has faced a southerly bearing since early 2018.
Withstanding a number of downside attempts, the 50-day SMA (blue – 0.6865) on the daily timeframe remained supportive last week, driving price marginally through the 200-day SMA (orange – 0.6890), which is now holding as support. Resistance lies close by at 0.6927, with a break of this level exposing the 0.7031 December 31 high and Quasimodo resistance at 0.7047. Beyond the aforementioned 50-day SMA, however, active demand seems limited until reaching Quasimodo support coming in at 0.6769.
Areas of consideration:
In a nutshell, chart studies suggest further selling on the weekly timeframe, with a break of the rising wedge pattern potentially on the menu. Daily resistance at 0.6927, given its history, is likely to hold firm, causing longs off the 200-day SMA some problems.
Shorter-term movement boasts a nice-looking area of resistance around the 0.6960ish region (see above in bold). However, in order to get to this point, a move above the current daily resistance is required.
Against the backdrop of the technical picture, all eyes are on the phase one trade deal proceedings today. Traders can expect possibly muscular moves in AUD/USD, therefore trade with caution.
USD/JPY:
The US dollar finished a shade higher against the Japanese yen Tuesday, extending Monday’s 0.46% gain. Movement, nevertheless, lacks impetus north of the 110 region, despite clocking highs at 110.21.
As highlighted in previous reports, the pair exhibits scope to push higher from 110, specifically on the higher timeframes.
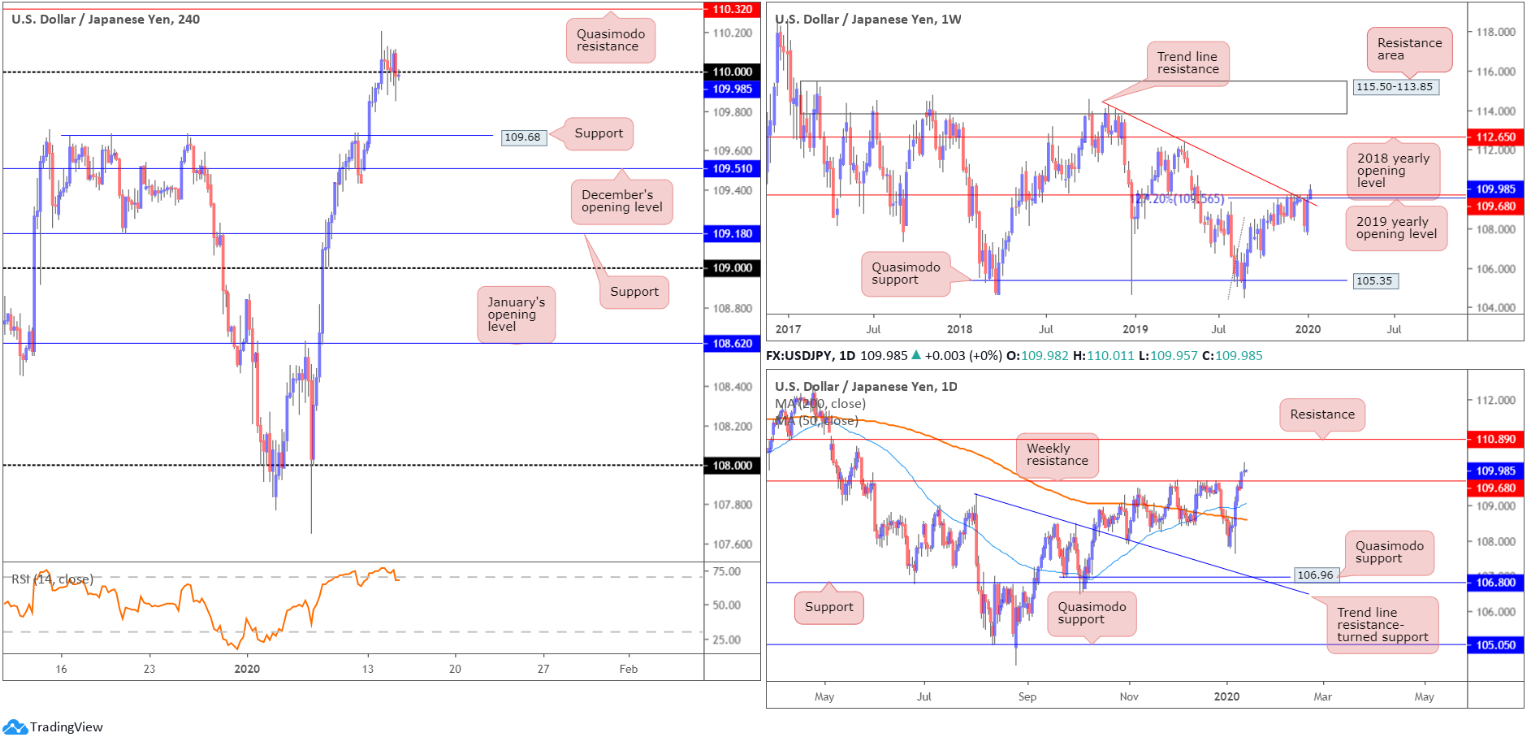
Weekly resistances (comprised of a 127.2% Fibonacci extension at 109.56 [taken from the low 104.44], the 2019 yearly opening level at 109.68 and trend line resistance, extended from the high 114.23) gave way in recent trading, perhaps setting the long-term stage for a run to the 2018 yearly opening level at 112.65.
A closer reading of price action on the daily timeframe shows price crossed weekly resistance in the shape of a near-full-bodied bullish candle Monday. This potentially clears the river north towards resistance at 110.89.
Above 110 on the H4 timeframe, Quasimodo resistance rests nearby at 110.32, whereas a downside move could land the candles back at support around 109.68. Also of note is the relative strength index (RSI) challenging overbought levels, and December’s opening level at 109.51 potentially offering support in the event 109.68 fails.
Areas of consideration:
The US/China trade deal is the next major catalyst in this market, depending on the details of the agreement.
Technically, the break above 110 will be viewed as a bullish indicator by most. The fact we’ve failed to uphold a bullish presence, though, may cause concern.
Although a violation of 110 offers around 30 points to play with till we reach H4 Quasimodo resistance, traders are more likely fixed on higher-timeframe targets at 110.89 and 112.65.
Traders who read Tuesday’s piece may recall the following:
Traders have the option of entering long on the close of the H4 breakout candle above 110, and positioning stop-loss orders accordingly. Should an entry long have been initiated based on this approach yesterday, dependent on stop-loss placement, a loss may have occurred.
An alternative to this, considered a more conservative approach, is to wait for a retest to develop, preferably by way of a H4 bullish candlestick formation (entry and risk levels can be determined according to this structure), following the breakout higher. Given price failed to sustain gains north of 110, this is likely the favoured approach should we reclaim 110 once more.
USD/CAD:
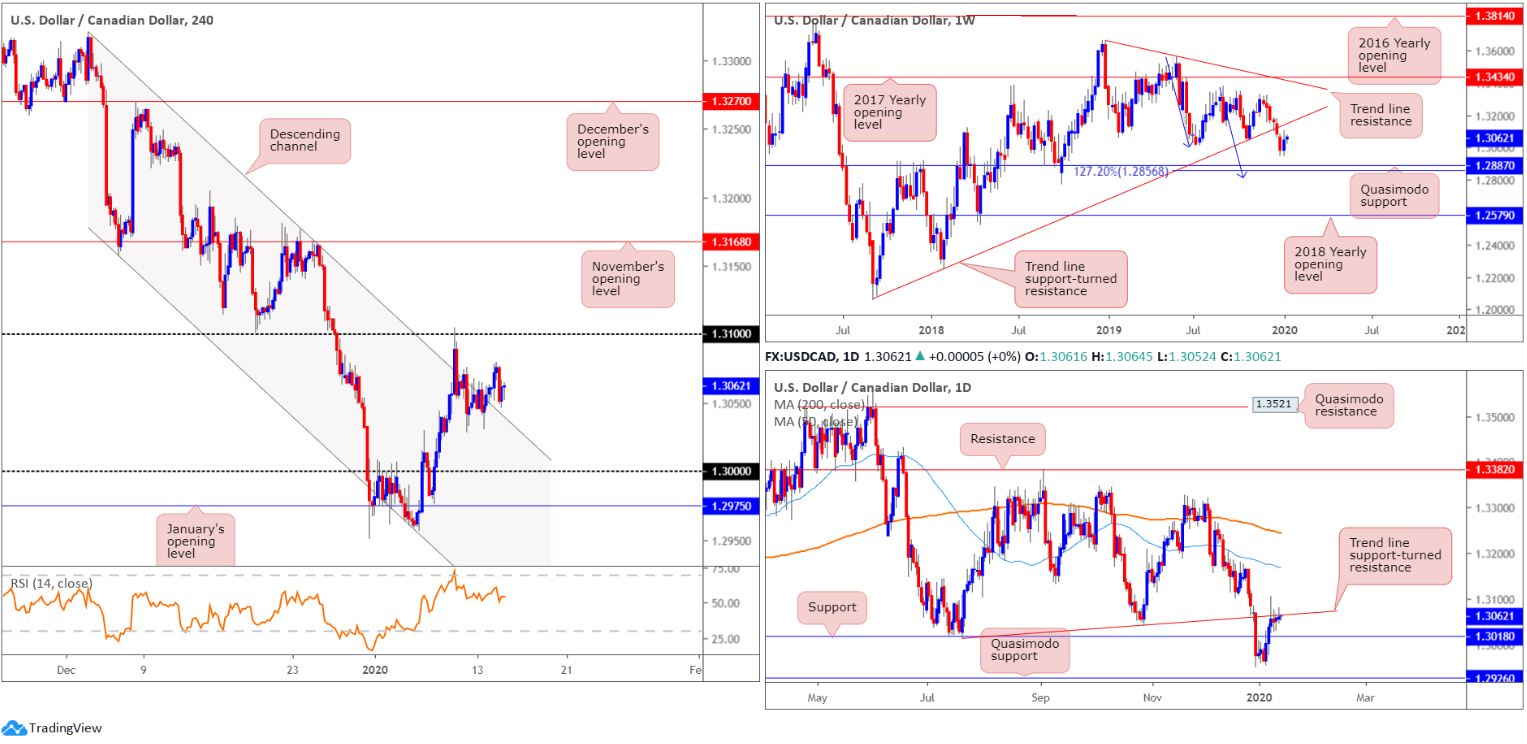
USD/CAD prices remain unmoved for a third successive session, fluctuating a few points north of the 1.3050 mark. H4 channel resistance, extended from the high 1.3320, ceded ground in recent trade, underlining the possibility of a revisit back to 1.31. Beyond this psychological point, a run to November’s opening level at 1.3168 could be on the cards.
Technical structure on the weekly timeframe:
Despite the recent upturn, snapping a six-week long losing streak, USD/CAD continues to reflect a bearish position. After engulfing trend line support, taken from the low 1.2061, the pair exhibits scope to test Quasimodo support at 1.2887, positioned close by a 127.2% AB=CD bullish correction (blue arrows) at 1.2856. As such, 1.2856/1.2887 is likely a base active buyers reside. The immediate trend has faced north since bottoming in September 2017; however, this move could also be considered a deep pullback in a larger downtrend from the 1.4689 peak in early January 2016.
The story on the daily timeframe has price action chewing on the underside of a trend line support-turned resistance, taken from the low 1.3015. In terms of support on this scale, we have 1.3018 in sight.
Areas of consideration:
As we write, weekly price could drive either way over the coming weeks. Daily price, on the other hand, suggests a move lower is in store, while H4 action portends a move higher to the 1.31 region.
Irrespective of the direction selected, opposition is present. For that reason, according to the chart studies presented above, neither a long nor short position is attractive. Sometimes the best trade is NO trade.
USD/CHF:
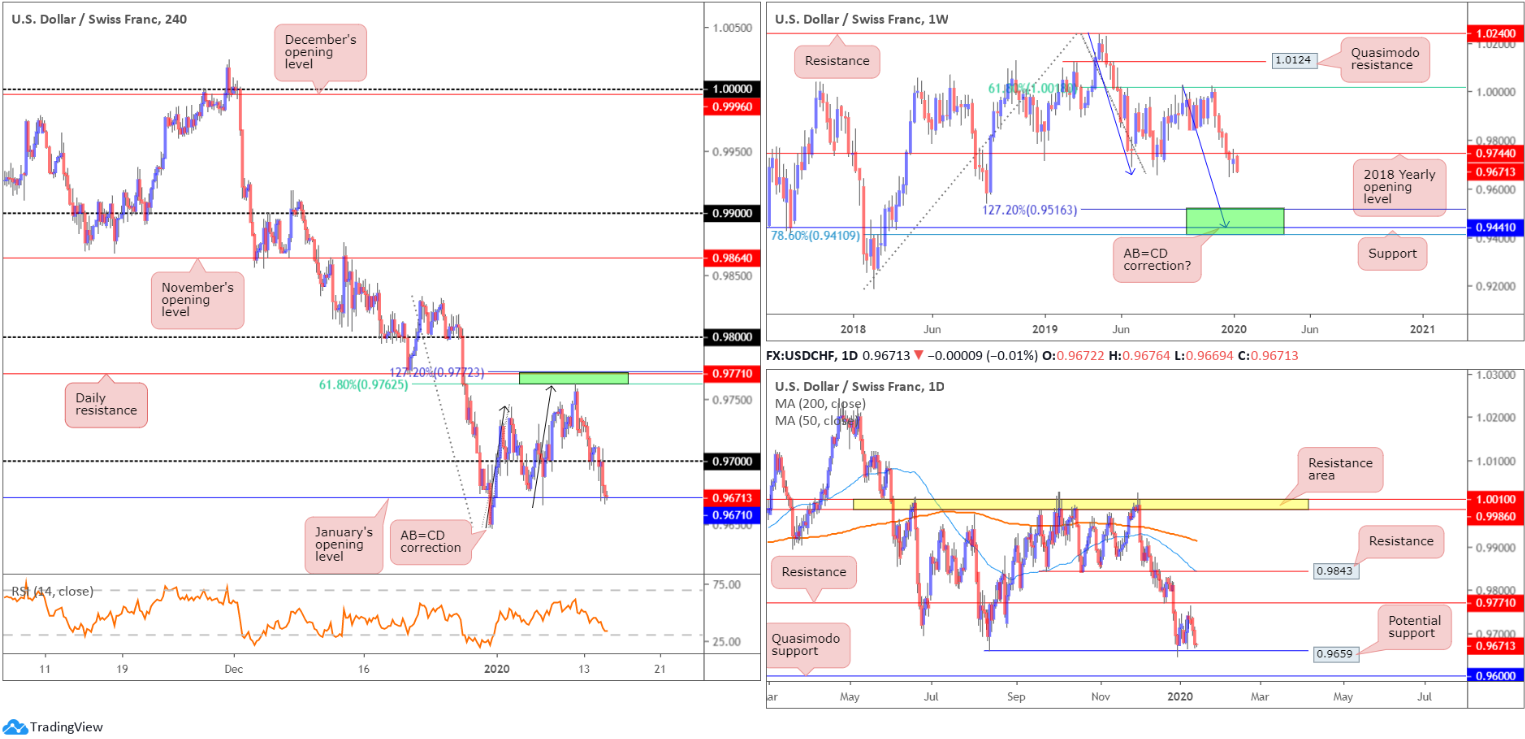
USD/CHF recorded its third successive loss Tuesday, erasing more than 30 points, or 0.35%.
Shedding nearly half-a-percent on the week so far, 0.97 on the H4 scale gave way in recent trading, unlocking the door to January’s opening level at 0.9671.
For those who read recent analysis you may recall the following piece:
Daily resistance at 0.9771. Note this level merges closely with a 127.2% H4 AB=CD bearish correction (black arrows) at 0.9772 and a 61.8% H4 Fibonacci resistance at 0.9762 (green). Also notable is the weekly timeframe: the 2018 yearly opening level at 0.9744 is currently in motion.
Well done to any readers who managed to jump aboard this shorting opportunity that presented itself on Friday.
Based on higher-timeframe structure, additional selling could still be on the cards until we reach 0.6959, or Quasimodo support at 0.9600 on the daily timeframe. However, according to the weekly timeframe, the next downside target sits in the range of 0.9410/0.9516 (comprised of a 78.6% Fibonacci retracement at 0.9410, support at 0.9441 and a 127.2% AB=CD bullish correction [black arrows] at 0.9516 – green]). Therefore, holding a portion of the position open remains an option.
Areas of consideration:
Traders short from 0.9772/0.9762 have likely reduced risk to breakeven and took partial profits in view of 0.97 entering the fold and, more recently, January’s opening level at 0.9671.
As highlighted above, the next downside targets are seen at 0.9659, 0.9600 and 0.9410-0.9516.
Dow Jones Industrial Average:
A day ahead of the planned signing of a phase one US/China trade deal, US stocks closed mixed. The Dow Jones Industrial Average edged higher Tuesday as big banks kicked off fourth-quarter earnings season with mostly strong results (WSJ). The Dow added 32.62 points, or 0.11%; the S&P 500 dropped 4.98 points, or 0.15% and the tech-heavy Nasdaq 100 lost 37.23 points, or 0.41%.
Technical research on the weekly timeframe enters Wednesday unchanged:
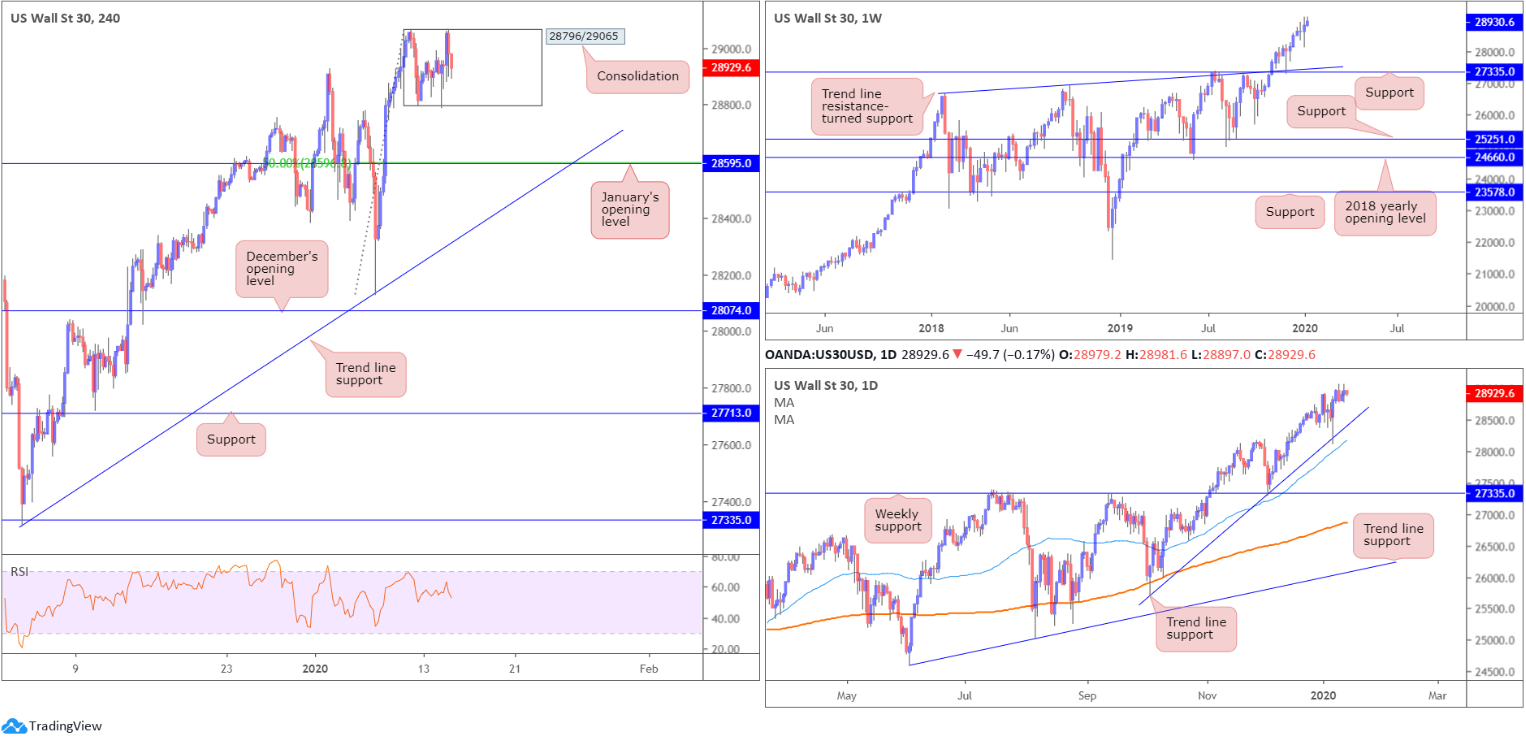
Following a weekly hammer candlestick pattern (considered a buy signal at troughs), formed six weeks back at the retest of support drawn from 27335, along with trend line support etched from the high 26670, the index continued to advance higher, testing fresh record peaks of 29065 last week.
Candlestick traders may also wish to note last week ended in the form of a bullish outside pattern, eclipsing three weeks’ worth of previous action.
The daily timeframe also displays unchanged analysis:
Trend line support, extended from the low 25710, entered the fray, bolstered by additional support located nearby from the 50-day SMA (blue – 28147).
H4 perspective:
Since Friday clocked an all-time high of 29065, the H4 candles have been busy carving a consolidation between the said high and 28796. Given the primary trend faces north, a break to the upside is expected. However, in the event we turn lower, January’s opening level at 28595 rests as the next support, which happens to align with a 50.0% retracement ratio.
Areas of consideration:
With the uptrend remaining strong, and daily price recently shaking hands with trend line support, traders likely have eyes on a breakout forming above the current H4 consolidation. This will trigger breakout buy stops and likely pull prices higher. For those not comfortable buying based on the breakout candle’s close, the alternative is to wait and see if a retest occurs before committing funds. A turn lower has January’s opening level from 28595 to target which may serve as a platform for buyers seeking a buy-the-dip scenario.
Conservative traders wishing to add a little more confirmation to the mix may wait and see if a H4 bullish candlestick pattern forms before committing (confirmation techniques will, of course, be trader dependent). This helps recognise intent to take things higher and provides structured entry and risk levels to work with, making risk/reward calculations easier.
XAU/USD (GOLD):
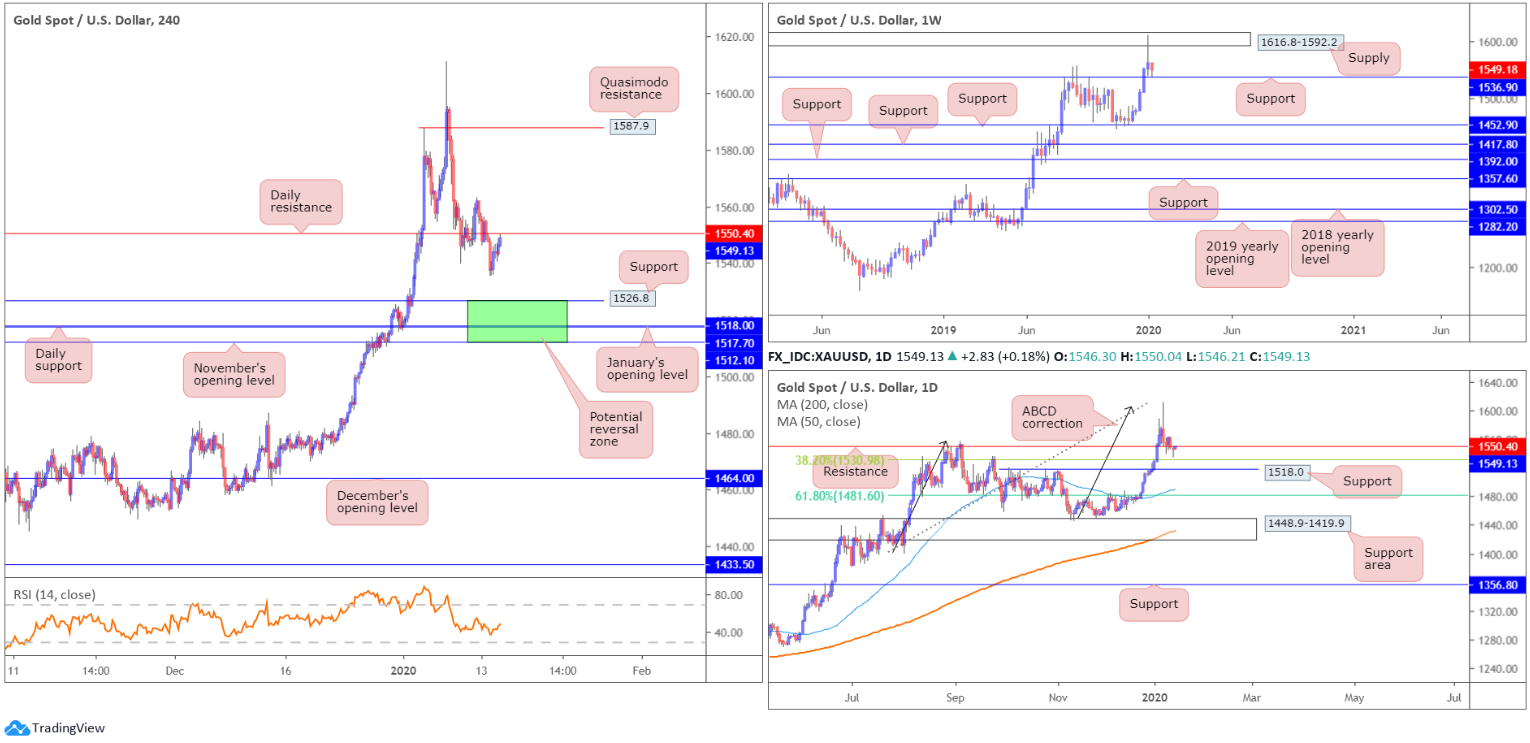
Kicking things off with a look at the weekly timeframe, technical research has price action testing support at 1536.9, following a dominant rejection out of supply at 1616.8-1592.2. A violation of the said support could prompt additional selling towards another layer of support residing at 1452.9.
Although the current weekly support may prompt buying, daily resistance plotted at 1550.4 could hamper upside. A potential point of support also worth bearing in mind on the daily timeframe is the 38.2% Fibonacci retracement at 1530.9 (of legs A-D), closely followed by 1518.0. The latter may form the initial take-profit target for traders short the recently produced ABCD bearish correction (black arrows) at 1608.0.
Though daily resistance is in motion at 1550.4, H4 structure displays an area of support (green) between November’s opening level at 1512.1 and support at 1526.8 (daily support at 1518.0 and January’s opening level at 1517.7 seen within).
Areas of consideration:
While selling beneath daily resistance at 1550.4 is appealing on the H4 timeframe, the threat of buyers making an appearance off weekly support at 1536.9 is likely enough to deter selling.
1512.1/1526.8 on the H4 timeframe, therefore, may be a zone worth watching for signs of buyer intent. Not only does it boast a strong mix of confluence, the support zone forms in line with the primary trend. The first point of concern (resistance) from the said support area can be seen around the current daily resistance at 1550.4.
The accuracy, completeness and timeliness of the information contained on this site cannot be guaranteed. IC Markets does not warranty, guarantee or make any representations, or assume any liability regarding financial results based on the use of the information in the site.
News, views, opinions, recommendations and other information obtained from sources outside of www.icmarkets.com.au, used in this site are believed to be reliable, but we cannot guarantee their accuracy or completeness. All such information is subject to change at any time without notice. IC Markets assumes no responsibility for the content of any linked site.
The fact that such links may exist does not indicate approval or endorsement of any material contained on any linked site. IC Markets is not liable for any harm caused by the transmission, through accessing the services or information on this site, of a computer virus, or other computer code or programming device that might be used to access, delete, damage, disable, disrupt or otherwise impede in any manner, the operation of the site or of any user’s software, hardware, data or property.


