
Key risk events today:
US Core Retail Sales m/m and Retail Sales m/m; BoC Monetary Policy Report, Rate Statement, Overnight Rate and Press Conference.
(Previous analysis as well as outside sources – italics).
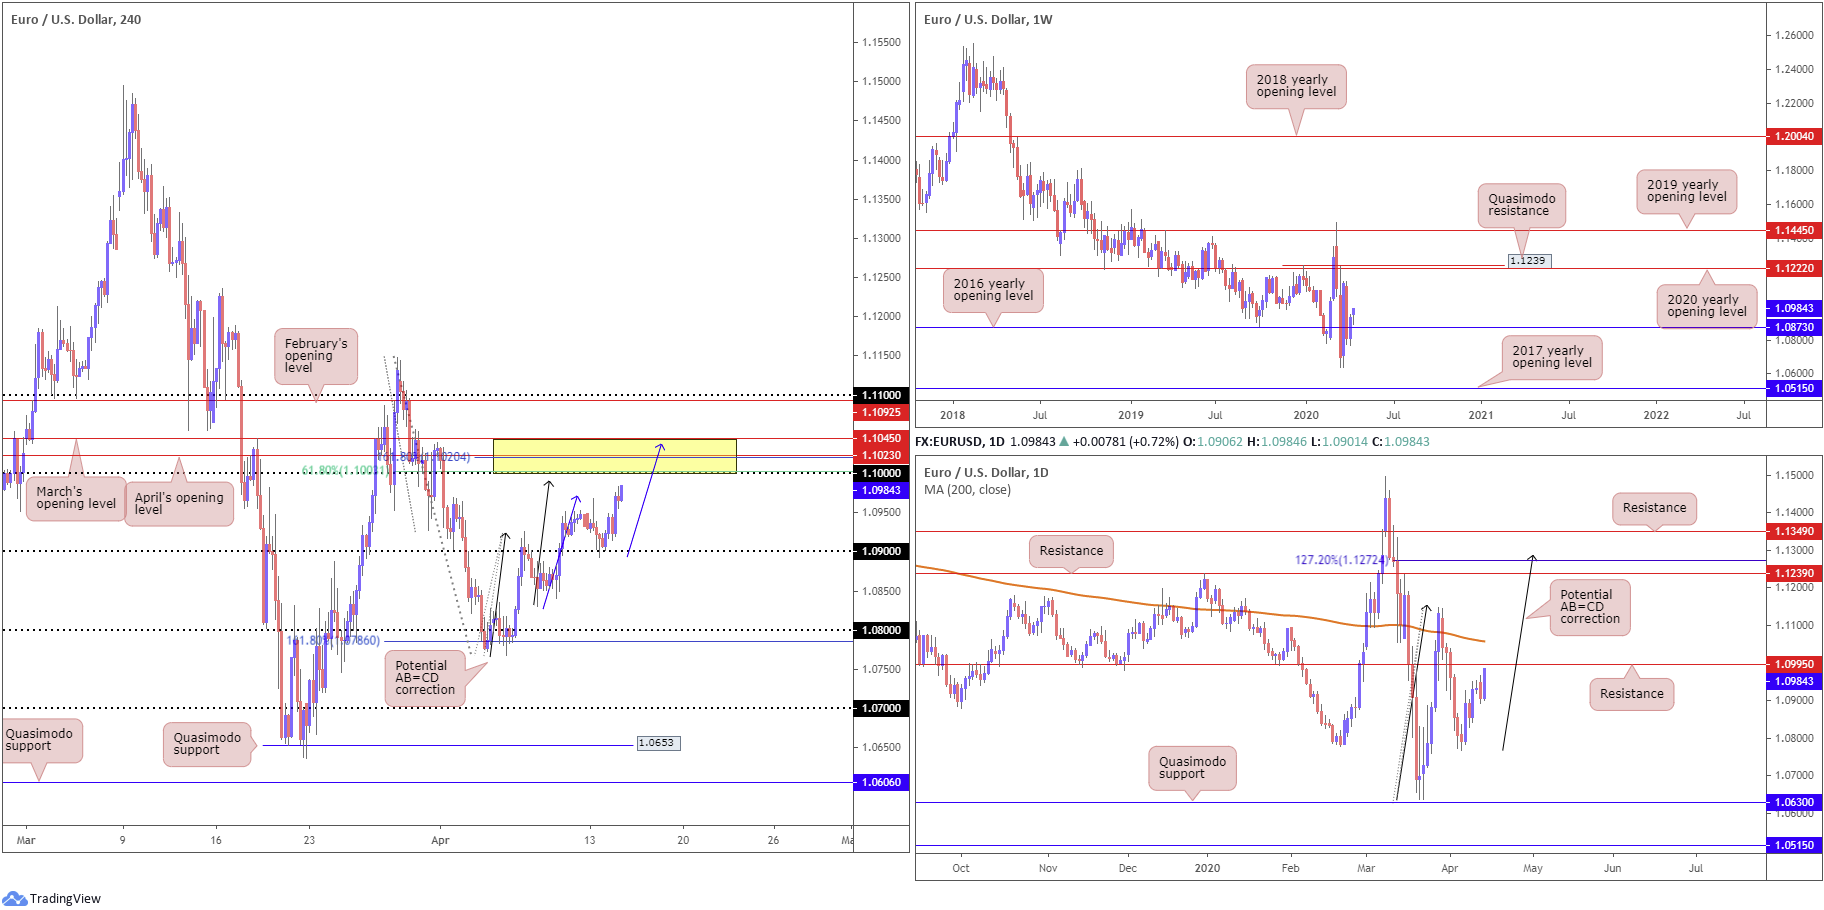
EUR/USD:
After knocking on 1.09’s door Monday by way of a H4 hammer candlestick pattern, EUR/USD bulls entered an offensive phase Tuesday, adding more than 60 points by London’s close. The US dollar index, or more commonly referred to as the ‘DXY’, lost grip of 99.00 amidst widespread dollar declines against G10 peers.
Follow-through buying off 1.09 positions 1.1045/1.10 (yellow) in sight on the H4 timeframe. 1.1045/1.10 is comprised of March and April’s opening levels at 1.1045 and 1.1023, a 161.8% Fibonacci extension point at 1.1020, a 61.8% Fibonacci retracement at 1.1003 and the key figure 1.10. What’s also notable is two possible H4 AB=CD corrections (black/blue arrows) at 1.0991 and 1.1038.
Further afield, weekly price recently conquered the 2016 yearly opening level at 1.0873. Skies beyond here are reasonably blue; a run to the 2020 yearly opening level at 1.1222, shadowed by a Quasimodo resistance at 1.1239.
From the daily timeframe, however, price action is seen fast approaching 1.0995, followed by the 200-day SMA (orange – 1.1059). Beyond the said structures, harmonic traders will also note a potential 127.2% AB=CD correction (black arrows) at 1.1272, sited a few points north of resistance priced in at 1.1239.
Areas of consideration:
For those who read Monday and Tuesday’s report you may recall the following pieces (italics):
Should we pullback from current prices, a retest at 1.09 is also feasible which could, owing to room seen on the higher timeframes to advance, provide a platform for buyers. Upside targets from this region are, logically speaking, likely set around the 1.10ish region.
The H4 hammer candlestick pattern formed off 1.09 may entice buyers into the market today.
Well done to any readers who managed to latch on to the bid formed from 1.09.
The H4 resistance at 1.1045/1.10, as highlighted above, is now a key base traders likely have eyes on. Not only does it offer buyers a take-profit target, sellers may consider this a location for shorts. In addition to its H4 confluence, daily resistance at 1.0995 converges close by, adding to its bearish presence.
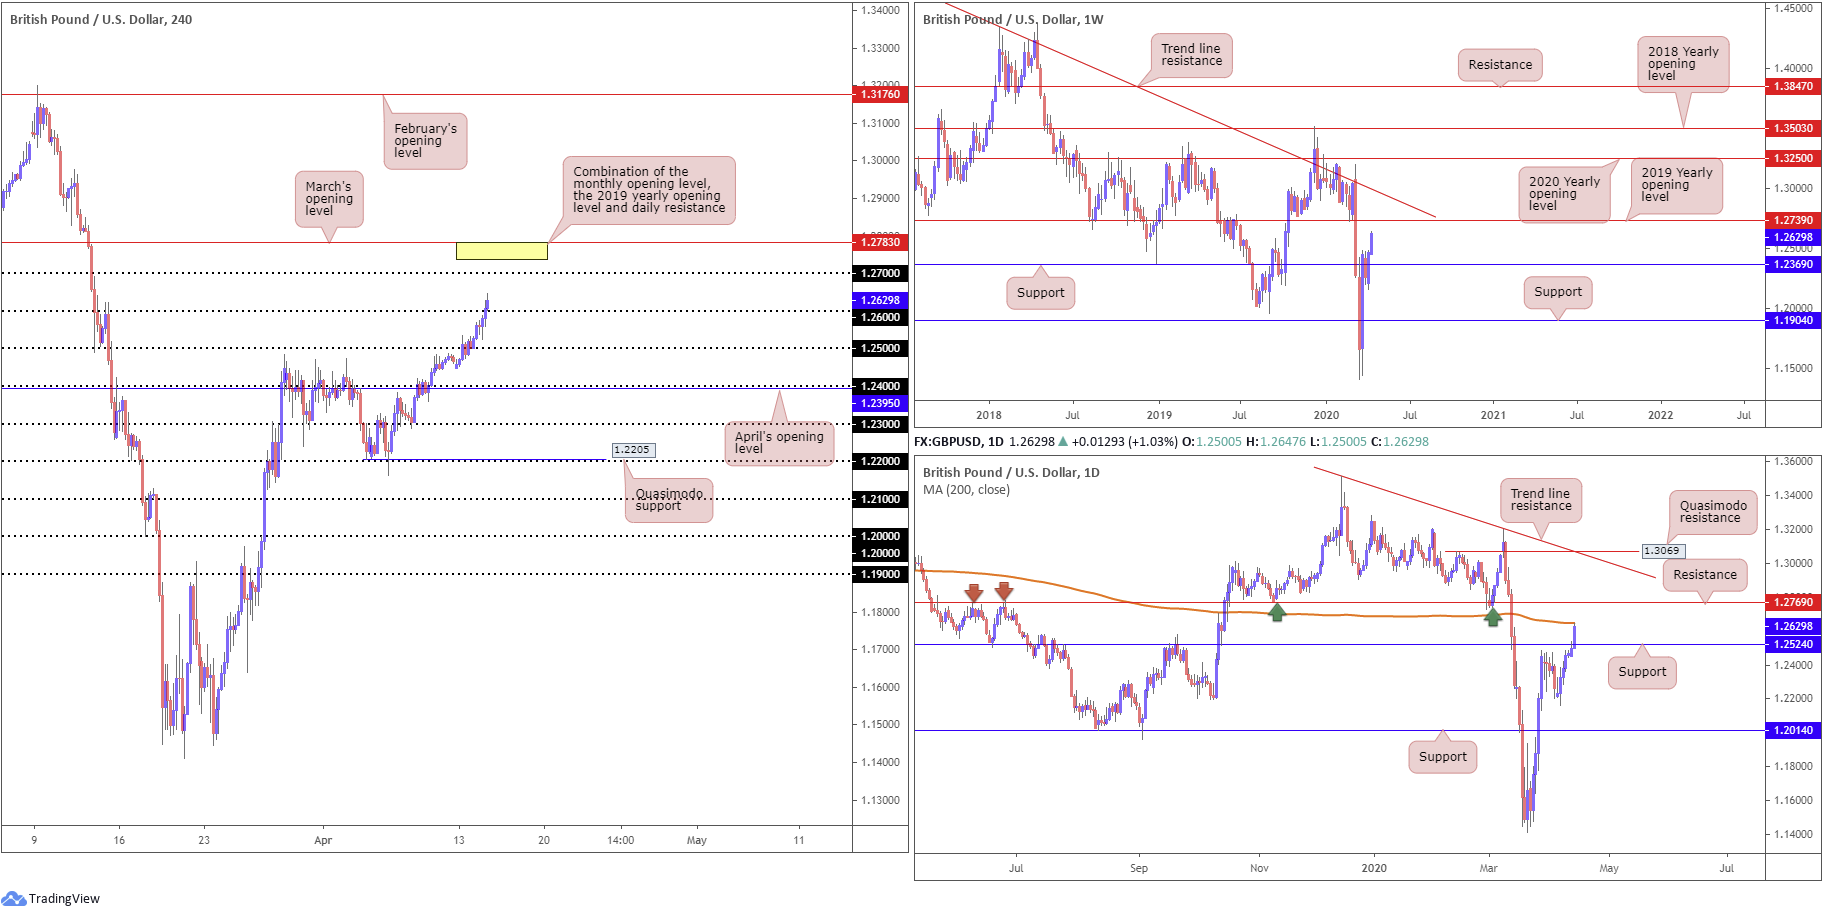
GBP/USD:
Sterling continued to navigate higher ground Tuesday, absorbing the 1.26 handle on the H4 timeframe and reaching highs at 1.2647 against the buck. Breakout buyers’ orders have likely been filled north of 1.26 as have sellers’ stop-loss orders. This could lead to 1.27 making a show today, with a break exposing March’s opening level at 1.2783.
Across the page on the daily timeframe, price action swarmed resistance at 1.2524 (now labelled a support level) and shook hands with the underside of the 200-day SMA (orange – 1.2647). Chart studies also indicate resistance lurking close by at 1.2769 – note the level boasts strong history (arrows). Another school of thought on the weekly timeframe, however, has price action tilting towards the 2019 yearly opening level at 1.2739. This is followed closely by long-term trend line resistance, taken from the high 1.5930.
Areas of consideration:
Although a response from the 200-day SMA is a possibility, weekly action points to higher prices. As a result, bullish themes north of 1.26 are an option. Conservative traders will likely seek a retest at 1.26 before pulling the trigger.
The yellow zone on the H4 timeframe between 1.2783/1.2739, made up of March’s opening level at 1.2783, daily resistance at 1.2769 and weekly resistance at 1.2739, is not only a logical target for any longs above 1.26, but also represents a potential resistance zone for sellers to make an appearance.
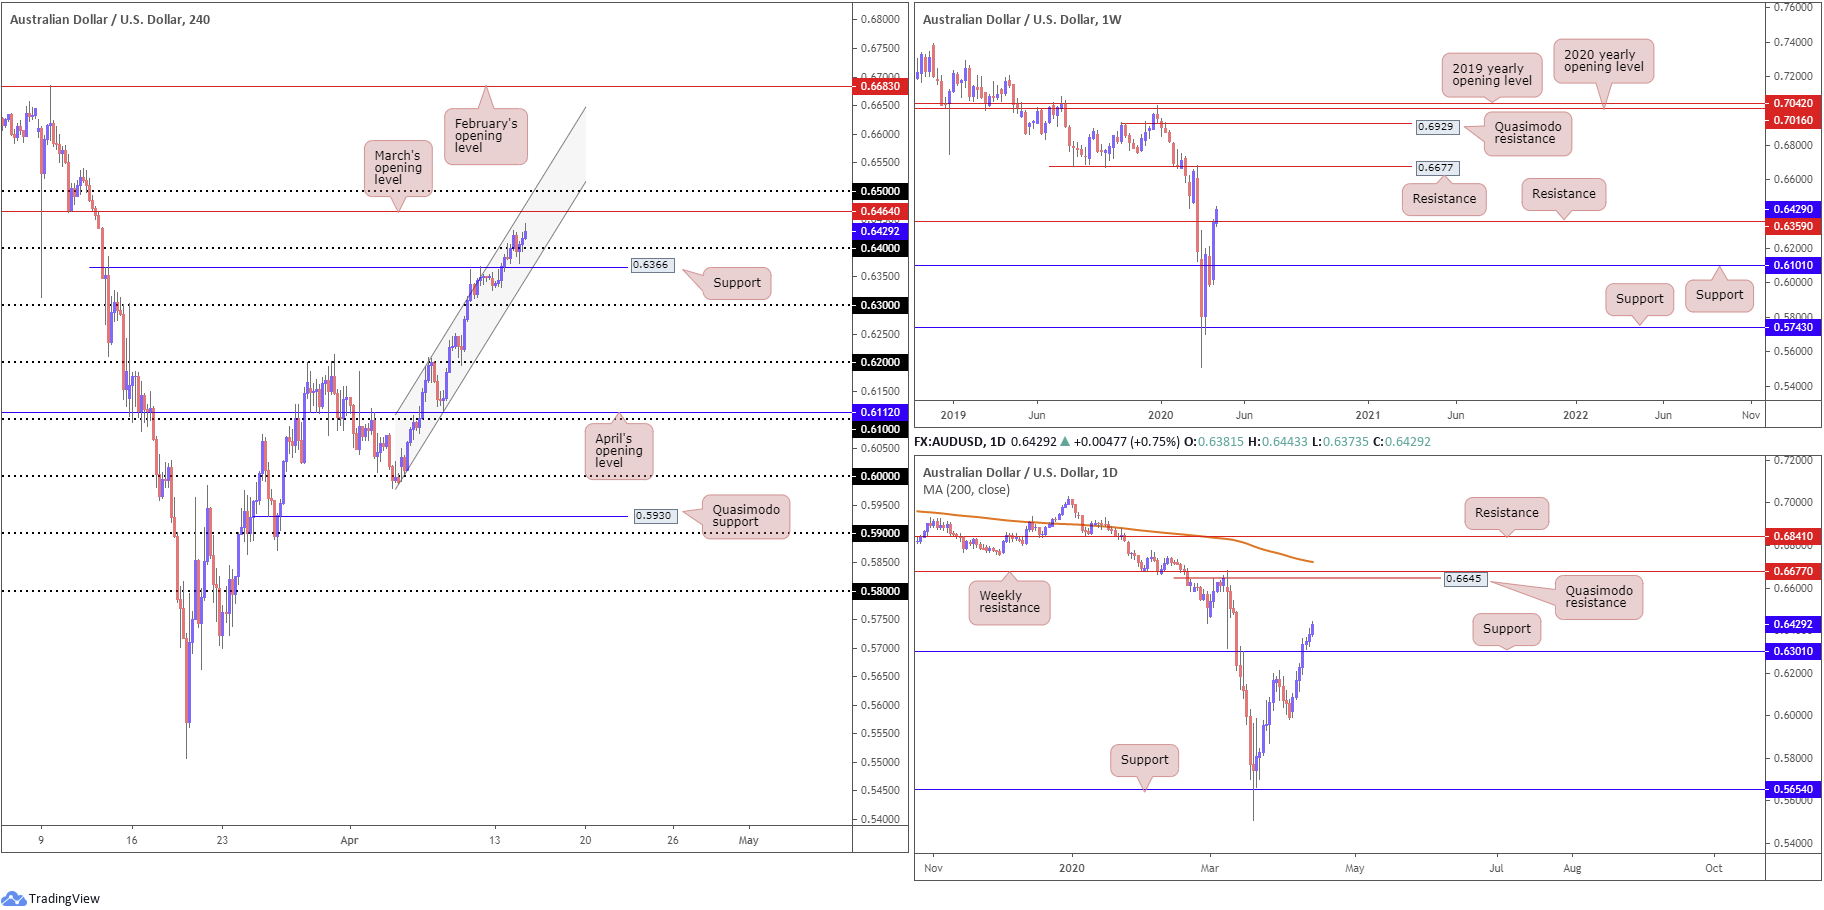
AUD/USD:
The Australian dollar ended higher vs. the greenback Tuesday, consequently chalking up its seventh consecutive daily gain.
Early trade this week has seen weekly price cross resistance at 0.6359, with history dating as far back as the year 2000. This potentially sets the stage for further upside towards resistance priced in at 0.6677.
The story on the daily timeframe, however, can see the bulls establishing a presence above support at 0.6301. This certainly places a question mark on the validity of weekly resistance at 0.6359. In fact, many may see this as the forerunner to moves towards weekly resistance at 0.6677.
Tuesday’s action, based on the H4 timeframe, remains entrenched within the walls of a narrow ascending channel formation derived from 0.5988/0.6208. 0.64, despite suffering a DEEP retest to lows of 0.6374, remains relevant, with the H4 candles eyeing March’s opening level at 0.6464, closely shadowed by 0.65.
Areas of consideration:
Breakout buying above 0.64 remains a logical approach, targeting March’s opening level at 0.6464 as an initial target. Conservative traders will likely position protective stop-loss orders beneath the H4 channel support. Trailing long positions above 0.65, in the event additional upside is observed, is also an idea, owing to weekly price suggesting we could be headed for 0.6677.
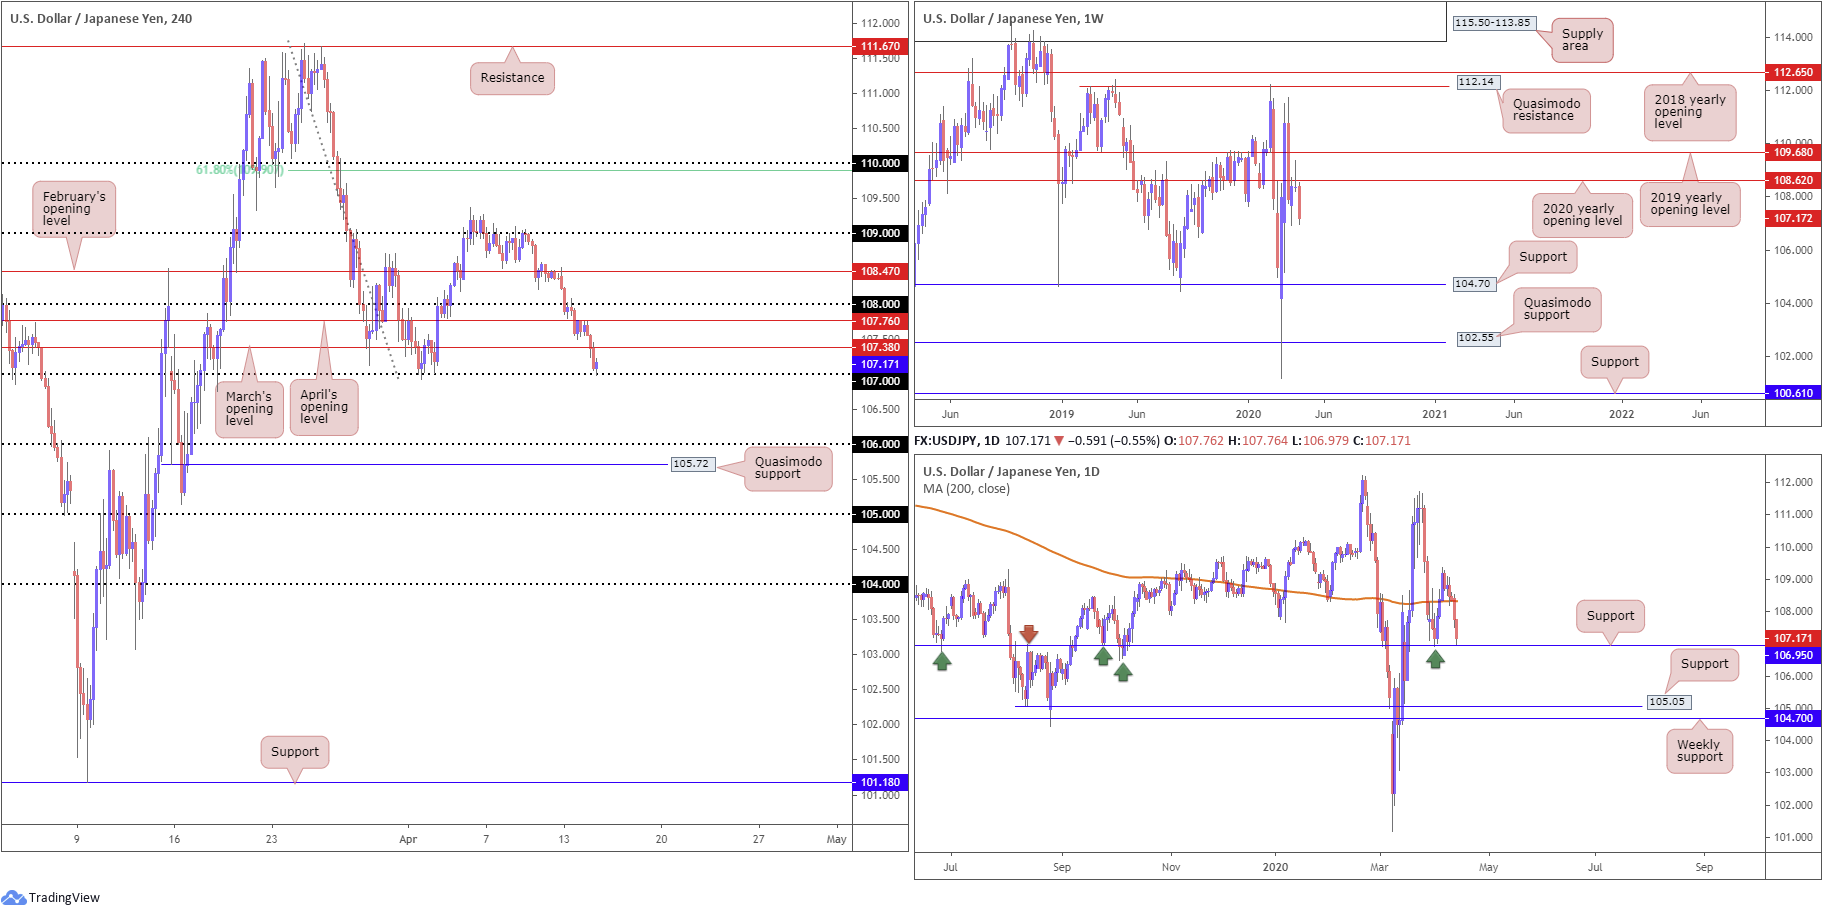
USD/JPY:
Broad-based USD selling kept the US dollar on the losing side of the table against the Japanese yen Tuesday. Down more than 100 points on the week, H4 price put in a retest at the underside of April’s opening level from 107.76 yesterday, brushing aside March’s opening level at 107.38 and crossing swords with the 107 handle.
107 is an interesting base. Not only has the figure held price action higher since mid-March, daily support can be found at 106.95, which brings with it strong historical significance (arrows). Despite this, the vibe on the weekly timeframe communicates a bearish tone – price action concluded last week by way of a clear-cut shooting star candlestick configuration off the 2020 yearly opening level at 108.62, with this week so far following through to the downside. The next support target is not seen until 104.70. Note this figure also represents the lower boundary of a multi-month range between Quasimodo resistance at 112.14.
Areas of consideration:
Weekly price suggesting lower levels certainly places a question mark on 107 as a support level today. This may see H4 price drive through bids and attack sell stops, perhaps re-opening the door for bearish scenarios to 106. Conservative traders are likely to seek a retest motion at the underside of the said round number prior to engaging. This may get you in at a worse level, though this is the price for additional confirmation.
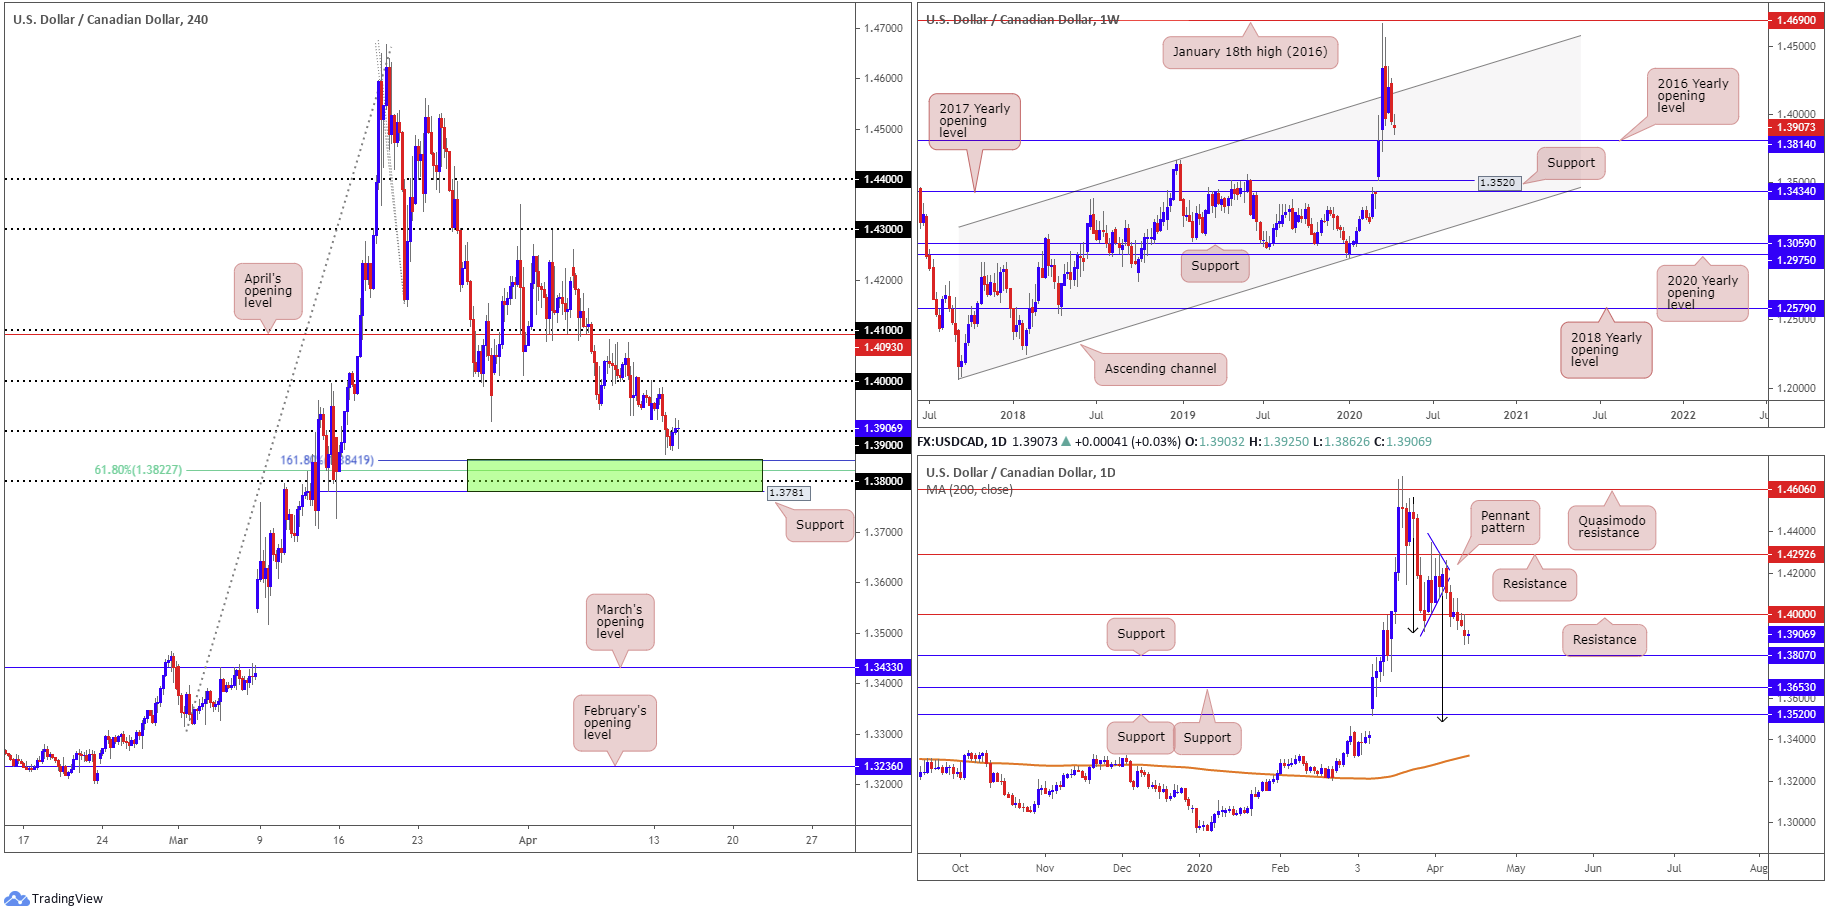
USD/CAD:
USD/CAD prices wrapped up pretty much unmoved on Tuesday, with the H4 candles latching onto the underside of 1.39. The US dollar index visited levels south of 99.00 while the price of oil struck lows of $20.00/bbl.
Technically speaking, given the somewhat lacklustre performance, much of the following piece will echo thoughts put forward in Tuesday’s technical briefing.
Last week’s session ended in the form of a weekly bearish engulfing candle. Technical studies also show space south of a channel resistance, extended from the high 1.3661, with the 2016 yearly opening level at 1.3814 noted as a possible downside target.
Pattern traders on the daily timeframe will recognise the recently formed bearish pennant formation (1.4349/1.4011) had its lower edge breached. With support at 1.4000 (now labelled resistance) cleared, support at 1.3807 is next in line. The take-profit target for the bearish pennant pattern, however, is set around 1.3482, measured by taking the preceding move prior to the pattern formation and adding this value to the breakout point (black arrows). This implies the support at 1.3807 and 1.3653 may give way.
With the H4 candles retesting 1.39, this has firmly placed a support zone at 1.3781-1.3841 in the limelight (comprised of a H4 support level at 1.3781, the 1.38 handle, a 61.8% Fibonacci retracement ratio at 1.3822 and a 161.8% Fibonacci extension point at 1.3841 [green zone]).
Areas of consideration:
Having seen daily price recently break out of a bearish pennant formation, with plenty of room to the downside until crossing swords with its take-profit target around 1.3482, traders may look for lower prices to materialise.
However, after breaking 1.39, weekly price is nearing 1.3814 (its next downside target). This, housed within the H4 support area highlighted above in bold, may be enough to hamper downside and provide buyers a platform to chalk up a recovery today. Owing to the threat of downside materialising on the daily timeframe, entries long out of 1.3781-1.3841 will only likely tempt buyers should a H4 bullish candlestick form or H4 price closes back above 1.39.
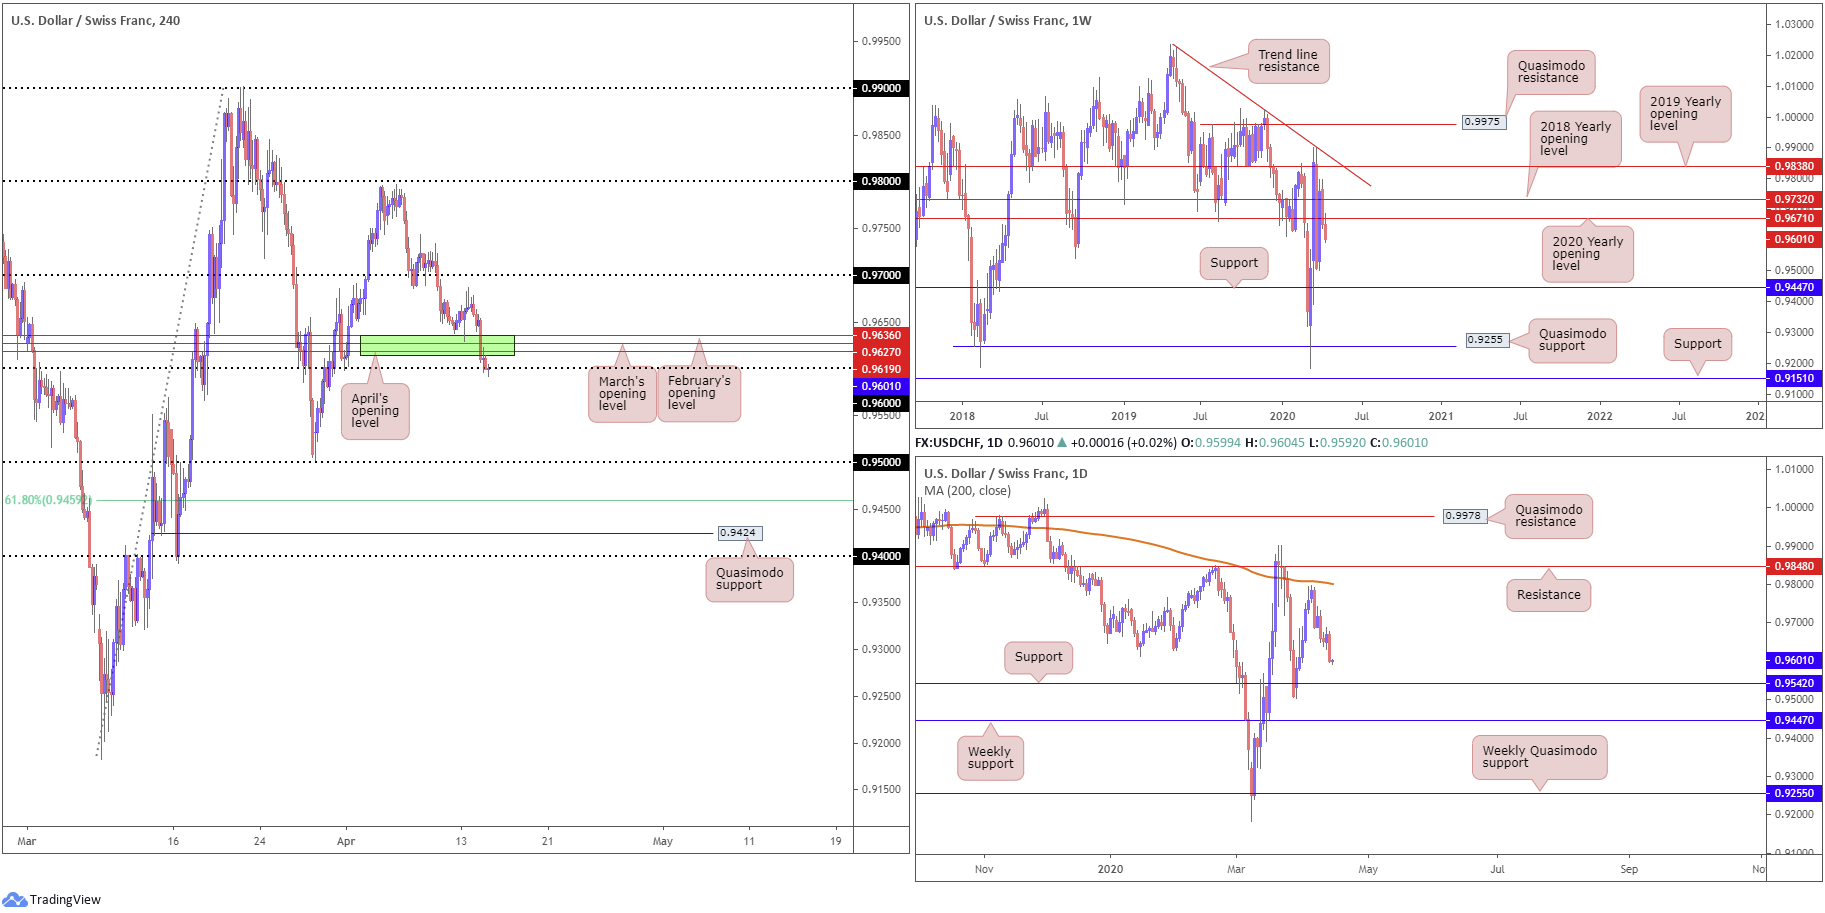
USD/CHF:
Broad-based USD selling took over USD/CHF Tuesday, consequently forming a near-full-bodied daily bearish candle and registering a near-70-point loss.
H4 support, comprised of monthly opening levels from April, March and February at 0.9619, 0.9627 and 0.9636 (0.9619/0.9636), gave way in recent movement, leading to an approach towards the 0.96 handle. As you can see, the psychological base is holding into Asia this morning, though struggling to pencil in anything of meaning. Upside attempts from here will also likely be capped by 0.9619/0.9636. A break beneath 0.96 could lead to 0.95 welcoming price action.
Higher up on the curve, weekly price is seen fading the 2020 yearly opening level at 0.9671, shadowed closely by the 2018 yearly opening level at 0.9732. The story on the daily timeframe has price action poised to approach support at 0.9542.
Areas of consideration:
Given both the weekly and daily timeframes suggest downside, at least until reaching daily support at 0.9542, bearish scenarios beneath 0.96 are likely in store today. Breakout sellers may seek entries on a H4 close south of 0.96, whereas other traders may prefer to see a retest at 0.96 before committing.
0.9542 (daily support) rests as the initial downside target, followed by the 0.95 handle.
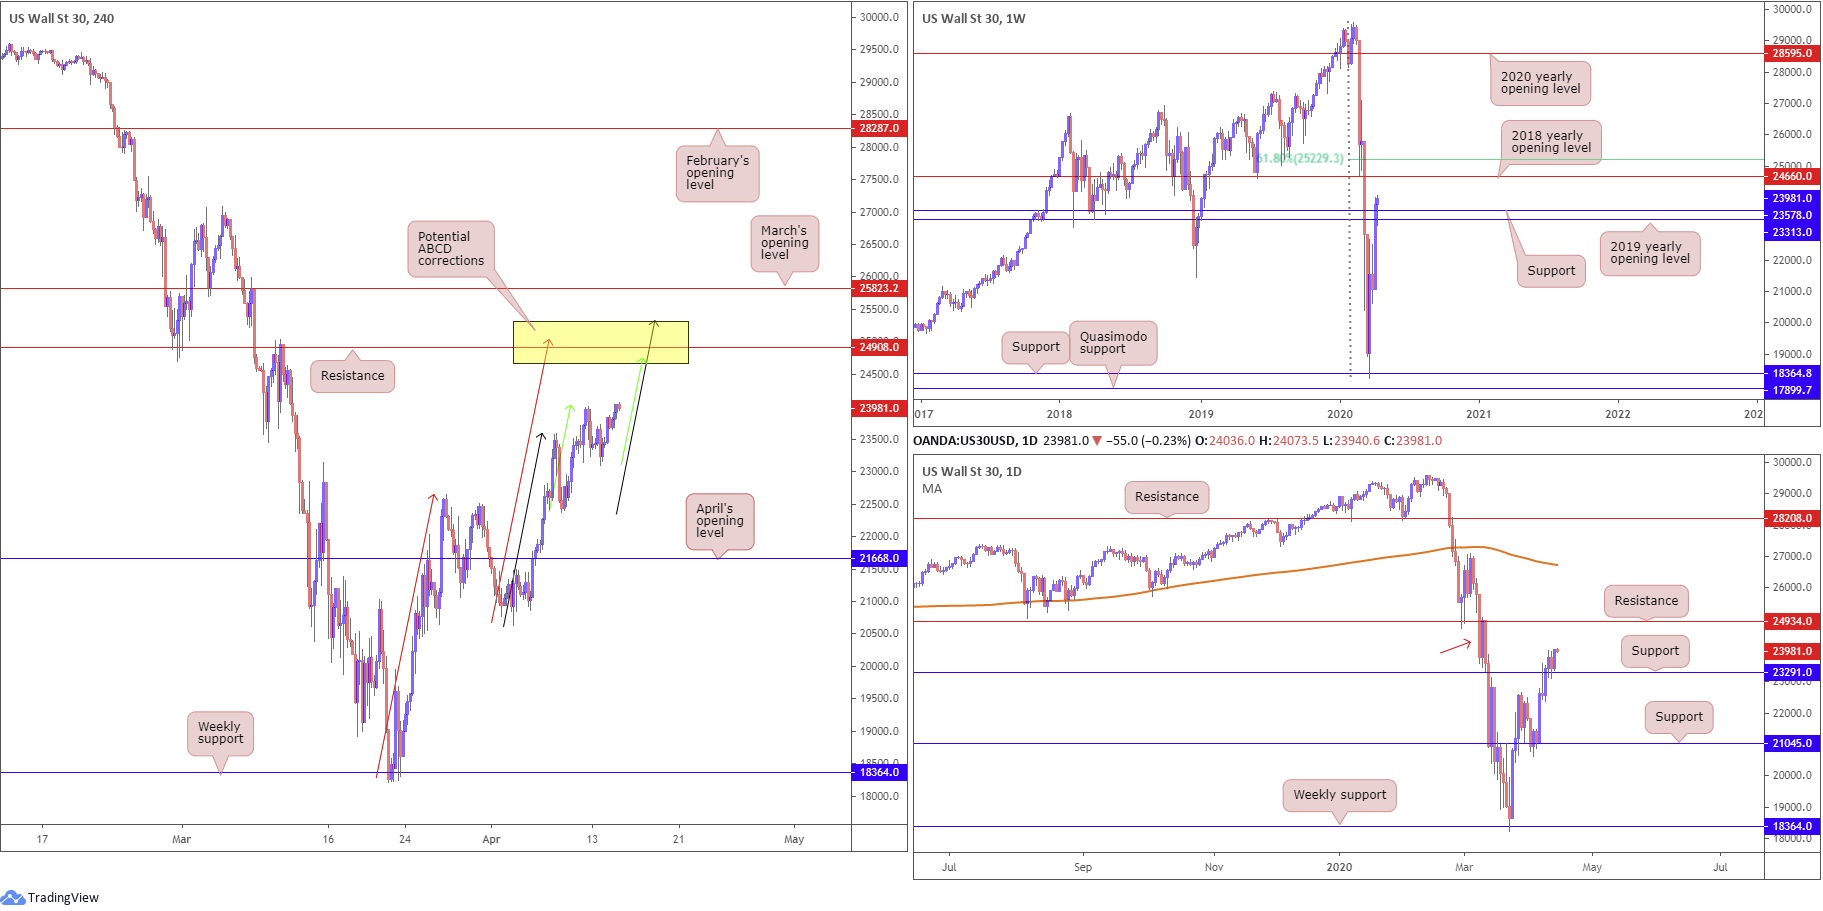
Dow Jones Industrial Average:
Major US benchmarks concluded higher across the board Tuesday, lifted on the back of rising prospects the worst of the human toll of the coronavirus pandemic may have passed. The Dow Jones Industrial Average gained 558.99 points, or 2.39%; the S&P 500 also added 84.43 points, or 3.06%, and the tech-heavy Nasdaq 100 concluded higher by 359.42 points, or 4.31%.
Technically, from the weekly timeframe, we are seeing price make headway above the 2019 yearly opening level at 23313 and a support level coming in at 23578.
A closer reading on the daily timeframe has price retesting 23291 as support. This potentially sets the stage for further upside to 24934, though buyers must contend with possible supply around 25000/23776, denoted by a red arrow.
On the H4 timeframe, price appears free to approach resistance coming in at 24908. Surrounding this area, however, we also have three potential ABCD completions at 25028 (red arrows), 25317 (black arrows) and 24759 (green arrows). Note the yellow area at 25317/24660 not only includes the said ABCD patterns, the base also houses daily resistance at 24934 and weekly resistance in the form of the 2018 yearly opening level at 24660.
Areas of consideration:
Given the number of technical levels converging within 25317/24660, this will likely garner interest. Not only is the area an ideal take-profit zone for longs off daily support at 23291, the zone also offers a base for potential bearish scenarios.
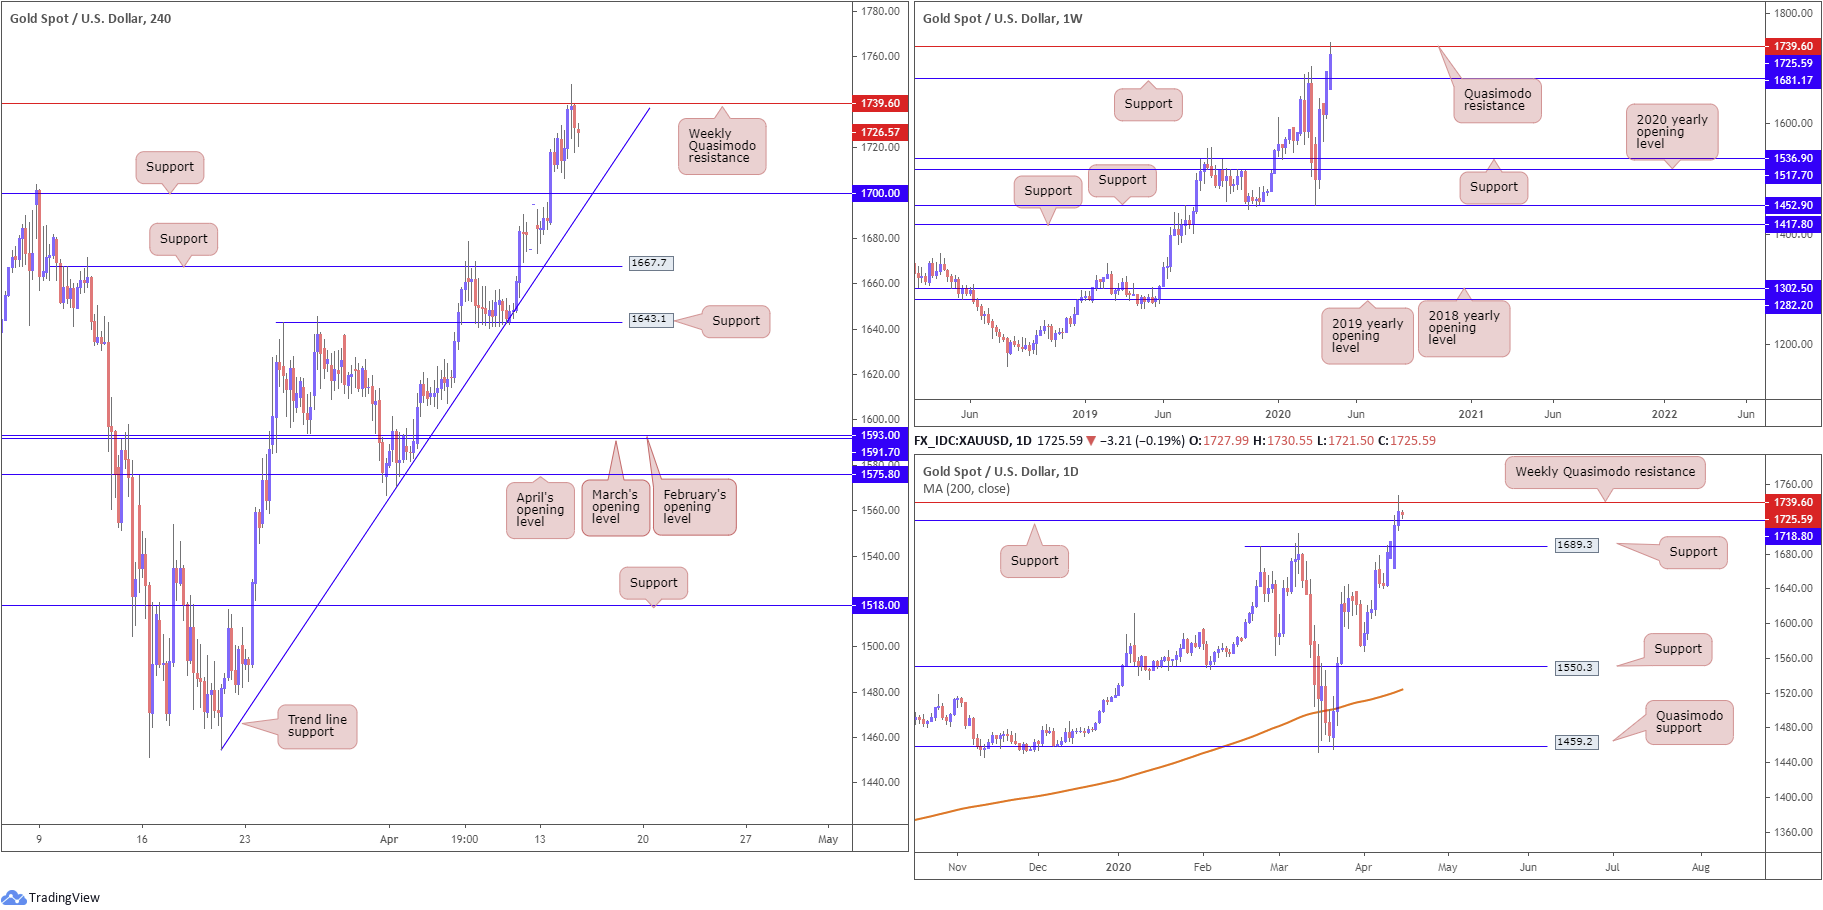
XAU/USD (GOLD):
From the top this morning, weekly price reveals we touched gloves with Quasimodo resistance at 1739.6, extended from late 2012. This follows a recent move through resistance at 1681.1 (now a serving support).
The reaction from weekly Quasimodo resistance mentioned above at 1739.6 formed a reasonably notable selling wick on the daily timeframe, though faces nearby support at 1718.8, followed by support priced in at 1689.3, both prior Quasimodo resistance levels.
A closer examination of price movement on the H4 timeframe has price threatening moves to support at 1700.0, combined with trend line support, taken from the low 1454.9.
Areas of consideration:
Having noted a weekly Quasimodo resistance recently entering the fold at 1739.6, sellers fading this base will seek ground south of daily support at 1718.0. However, given the strength of the trend right now, buyers are unlikely to go down without a fight.
Bullish themes above 1739.6 are, of course, an option should we make it past this level today.
H4 support at 1700.0, particularly at the point it merges with H4 trend line support, may develop a ‘floor’ in the event we dip lower. Though, this would entail overthrowing daily support at 1718.0.
The accuracy, completeness and timeliness of the information contained on this site cannot be guaranteed. IC Markets does not warranty, guarantee or make any representations, or assume any liability regarding financial results based on the use of the information in the site.
News, views, opinions, recommendations and other information obtained from sources outside of www.icmarkets.com.au, used in this site are believed to be reliable, but we cannot guarantee their accuracy or completeness. All such information is subject to change at any time without notice. IC Markets assumes no responsibility for the content of any linked site.
The fact that such links may exist does not indicate approval or endorsement of any material contained on any linked site. IC Markets is not liable for any harm caused by the transmission, through accessing the services or information on this site, of a computer virus, or other computer code or programming device that might be used to access, delete, damage, disable, disrupt or otherwise impede in any manner, the operation of the site or of any user’s software, hardware, data or property.


