
DXY:
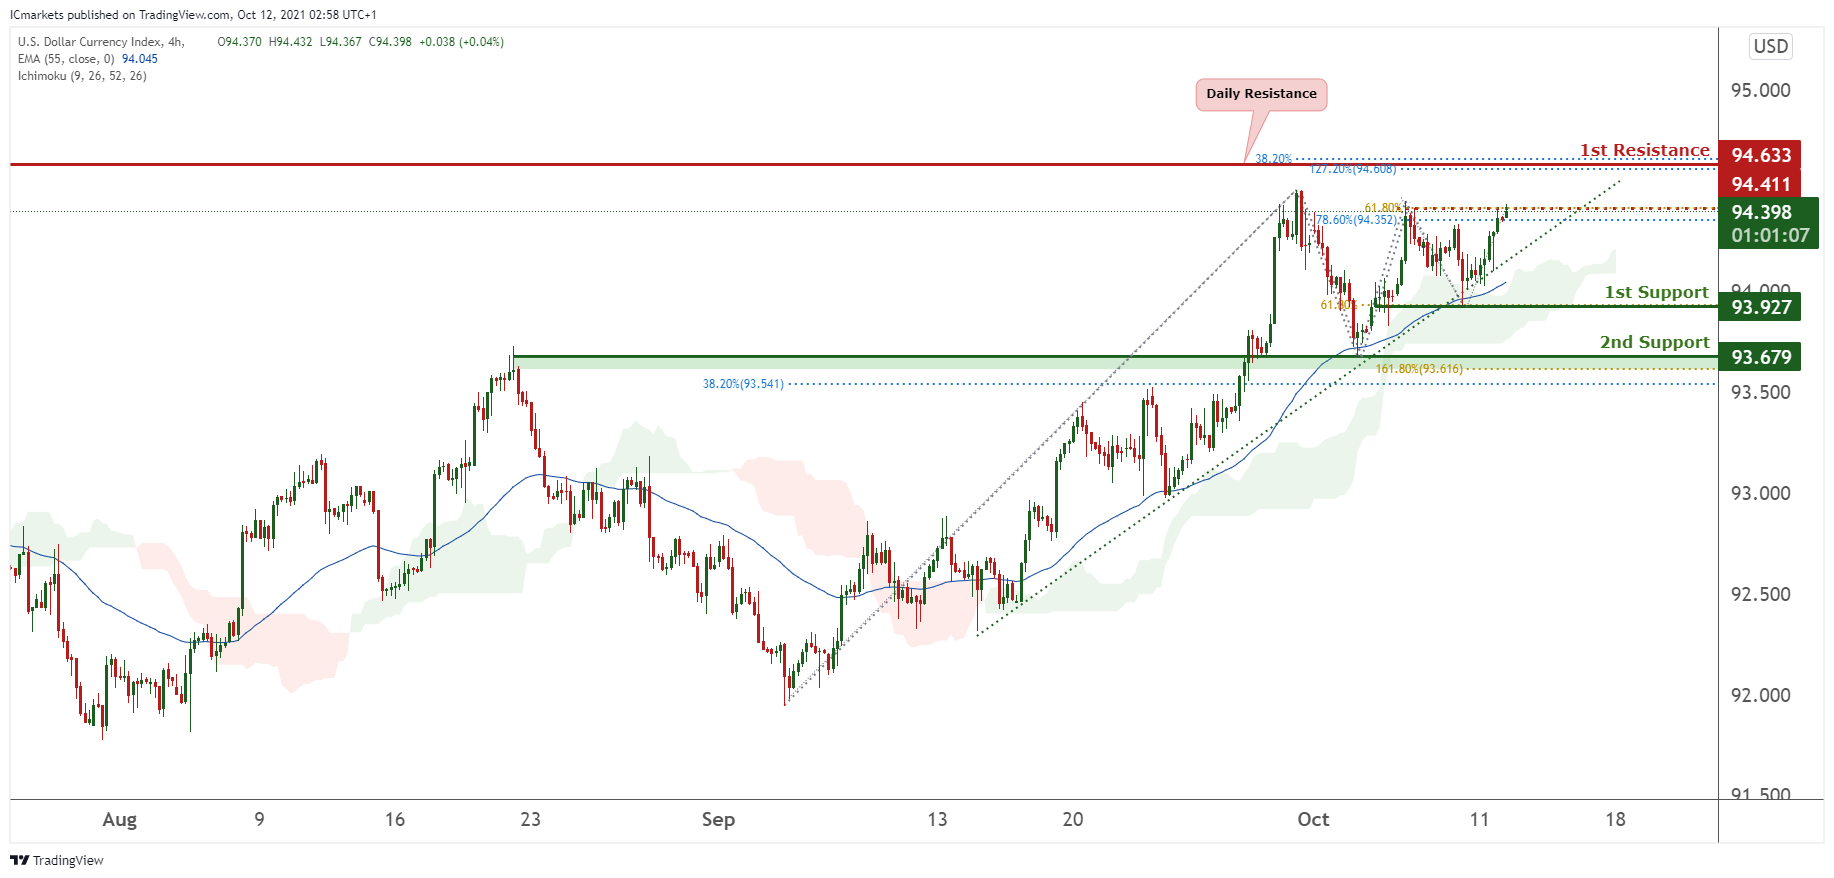
On the H4 timeframe, DXY is on a bullish momentum. We would expect a high probability of prices to test our intermediate support at 94.326 in line with 38.2% Fibonacci retracement and bullish trendline before any bounces towards our 1st resistance at 94.633 in line with 38.2% and 127.2% Fibonacci retracement and also a daily resistance. Technical indicators are showing bullish momentum. Alternatively, if prices break our ascending trendline, it might dip towards our 1st support at 93.927 in line with 61.8% Fibonacci retracement.
Areas of consideration:
- H4 time frame, 1st support at 93.927
- H4 time frame, intermediate support at 94.326
- H4 time frame 1st resistance at 94.633
XAU/USD (GOLD):
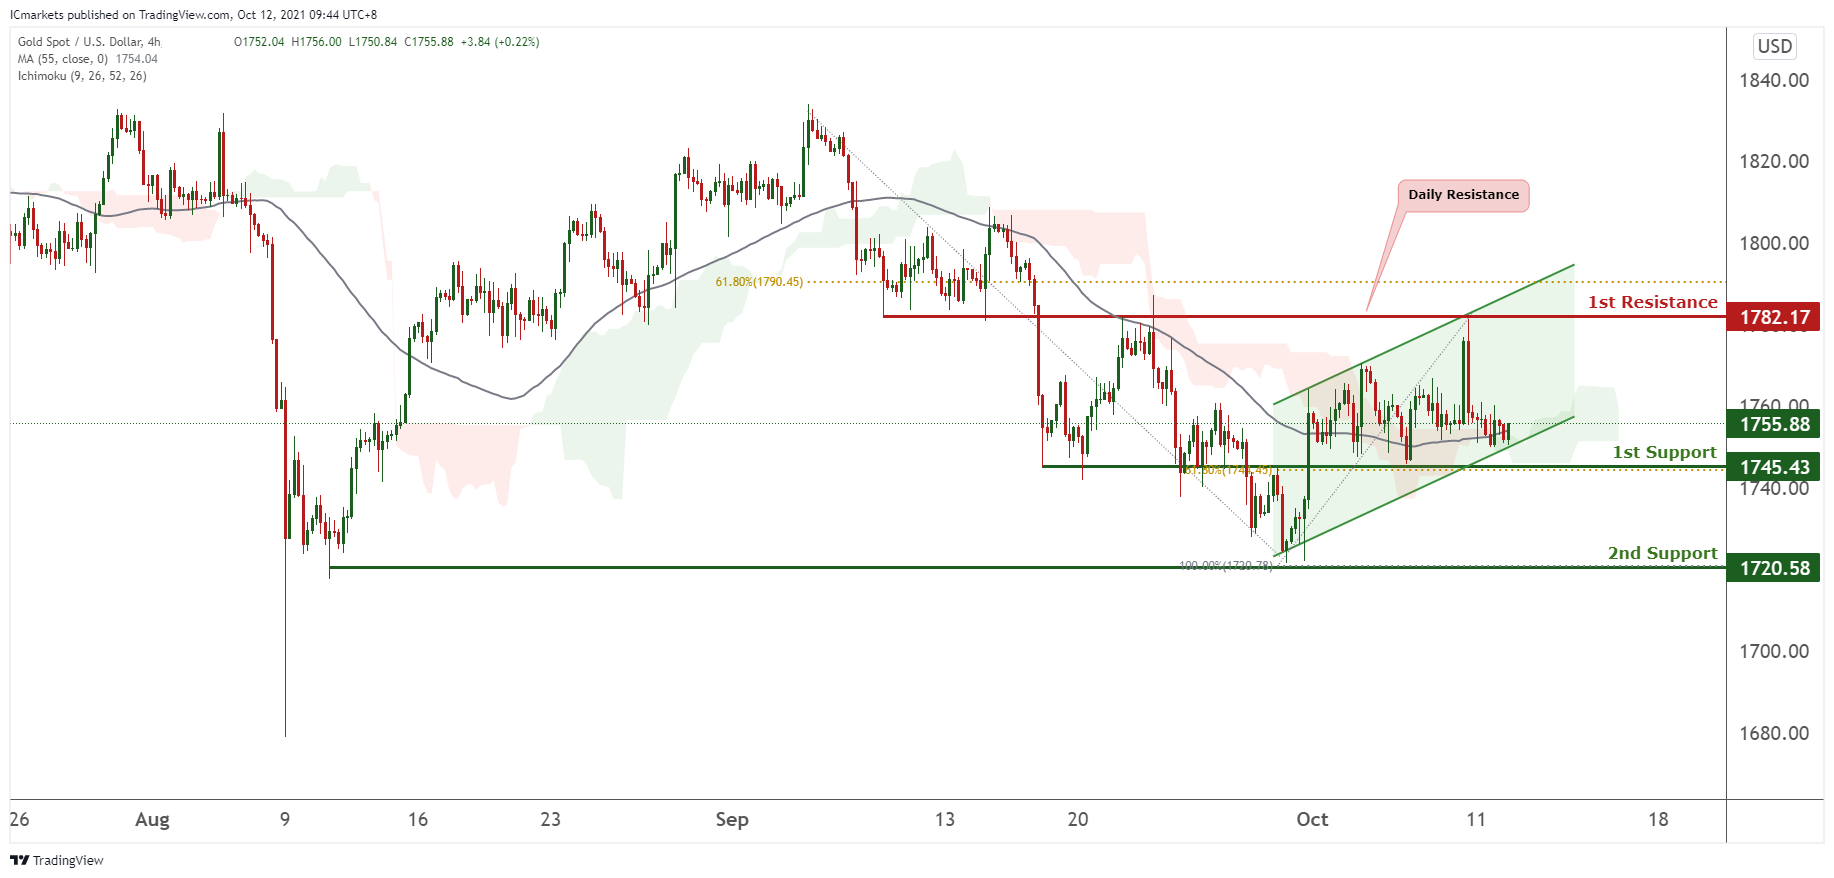
On the H4 chart, prices appear to be consolidating in a parallel channel. We would watch our intermediate resistance level at 1770.14 in line with 61.8% Fibonacci retracement. If prices surpasses the level, they have the potential to climb towards our 1st resistance at 1782.19 which is in line with the top of our ascending channel and graphical overlap, and is also a daily resistance on our daily time frame. Technical indicators are showing bullish momentum. Alternatively, prices break our bullish channel, it might dip towards our 1st support at 1745.43 in line with 61.8% Fibonacci retracement.
Areas of consideration:
- 4h 1st support at 1745.43
- 4h 1st resistance at 1782.17
EUR/USD:
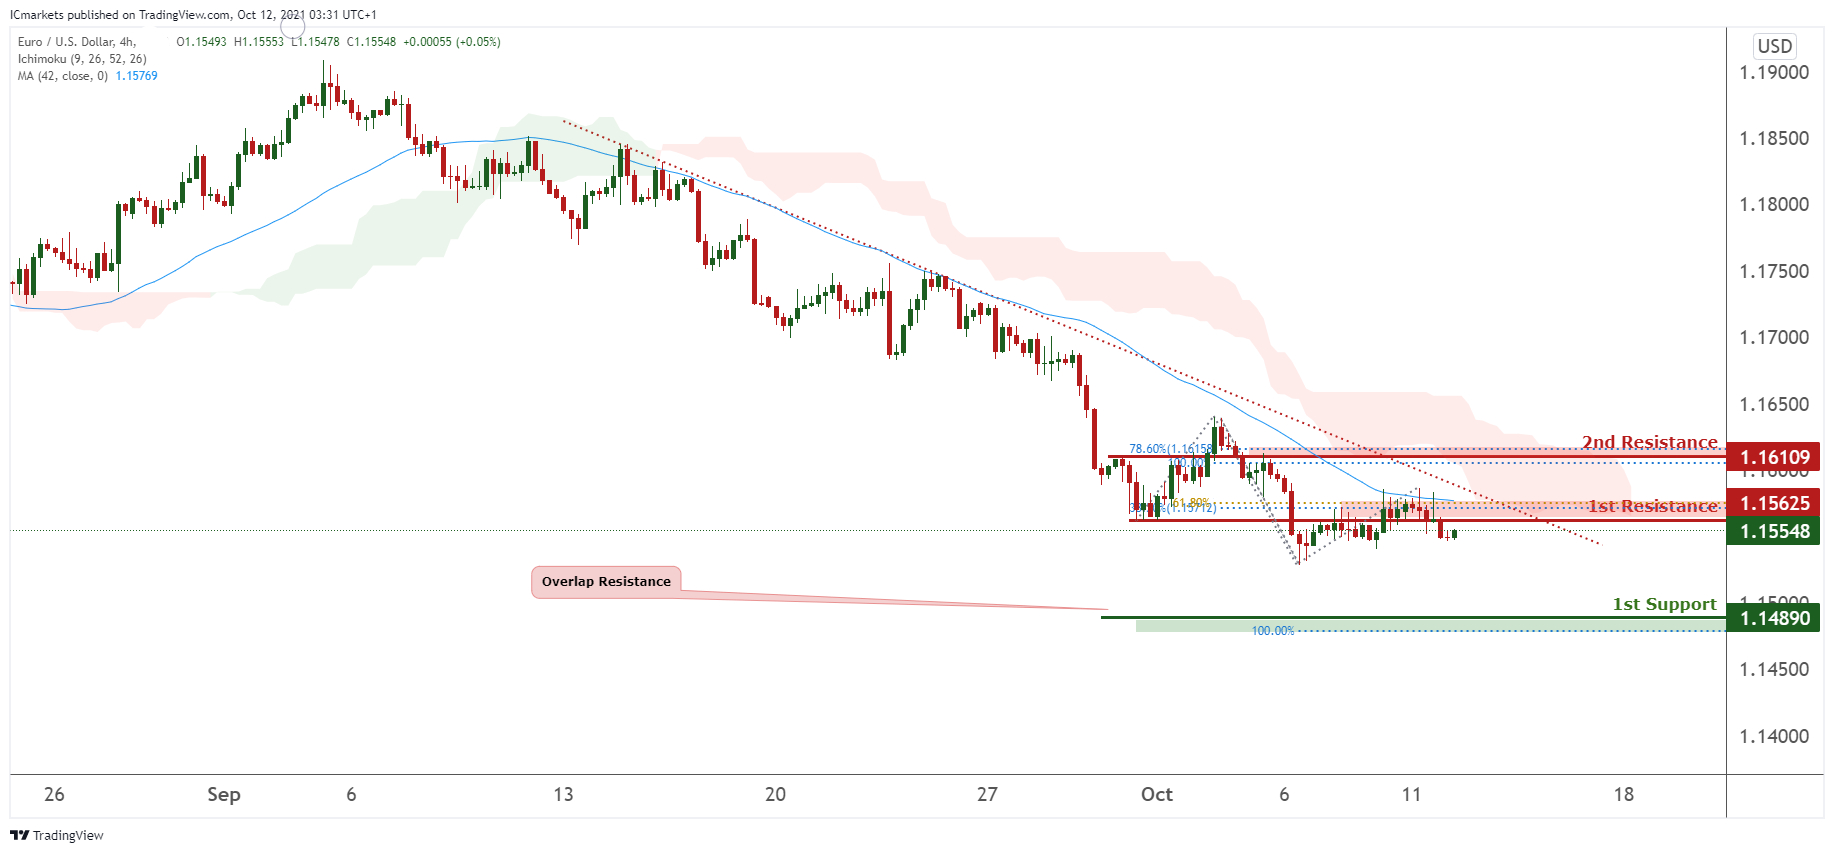
Price is currently trading in a descending channel and is in the middle of our respective intermediate support and resistance levels. Our intermediate resistance is placed at 1.5825 which is also our 50% retracement level and 61.8% projection level while our intermediate support is placed at 61.8% projection level. If price were to break our intermediate resistance level, it can potentially go to our 1st resistance level of 1.16644 which is also 38.2% retracement and 61.8% projection level. Alternatively, if price were to break below our intermediate support level 1.15261, it can potentially dip to its first support which is our graphical overlap support level.
H4 intermediate resistance level – 1.5825
H4 intermediate support level – 1.15261
H4 first resistance level – 1.16644
H4 first support level – 1.14913
USD/CHF:
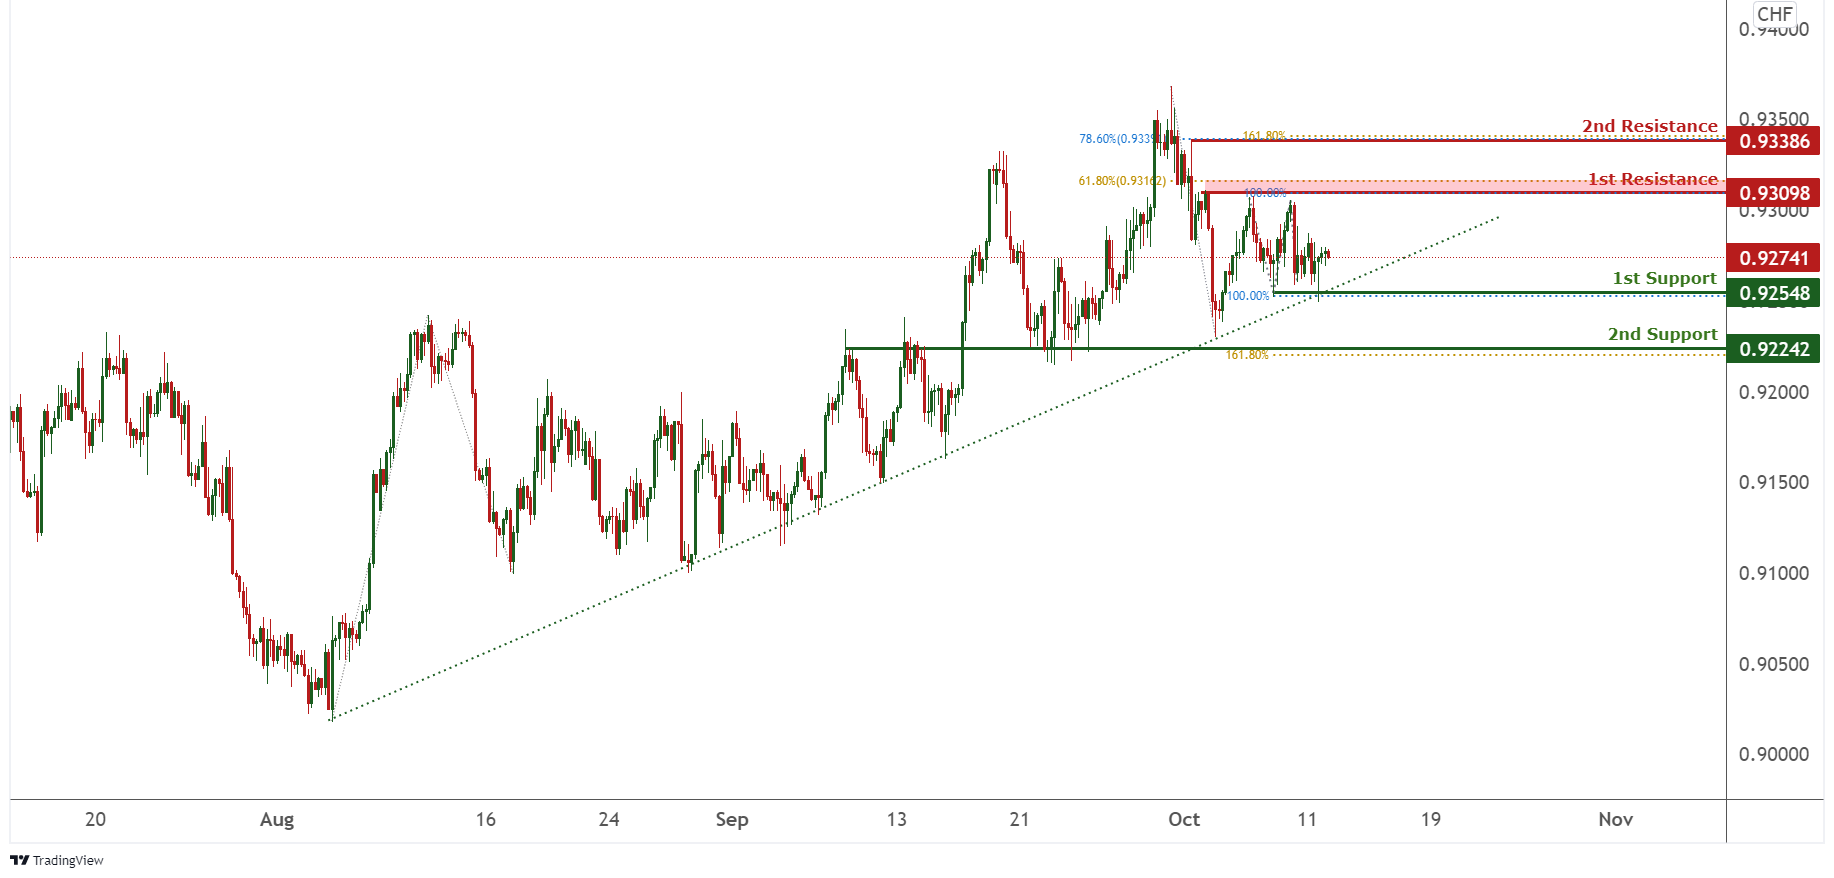
On the H4, price is seen to be reacting above the ascending trendline and price has failed to push past the 1st Resistance. We can expect price to be dropping down to the 1st Support in line with the ascending trendline support, 61.8% Fibonacci retracement and 78.6% Fibonacci projection. Our short-term bearish bias is further supported by the stochastic indicator where the %K line is holding below a descending trendline.
Areas of consideration:
- Watch 1st Support at 0.92713
- Watch 1st Resistance at 0.93189
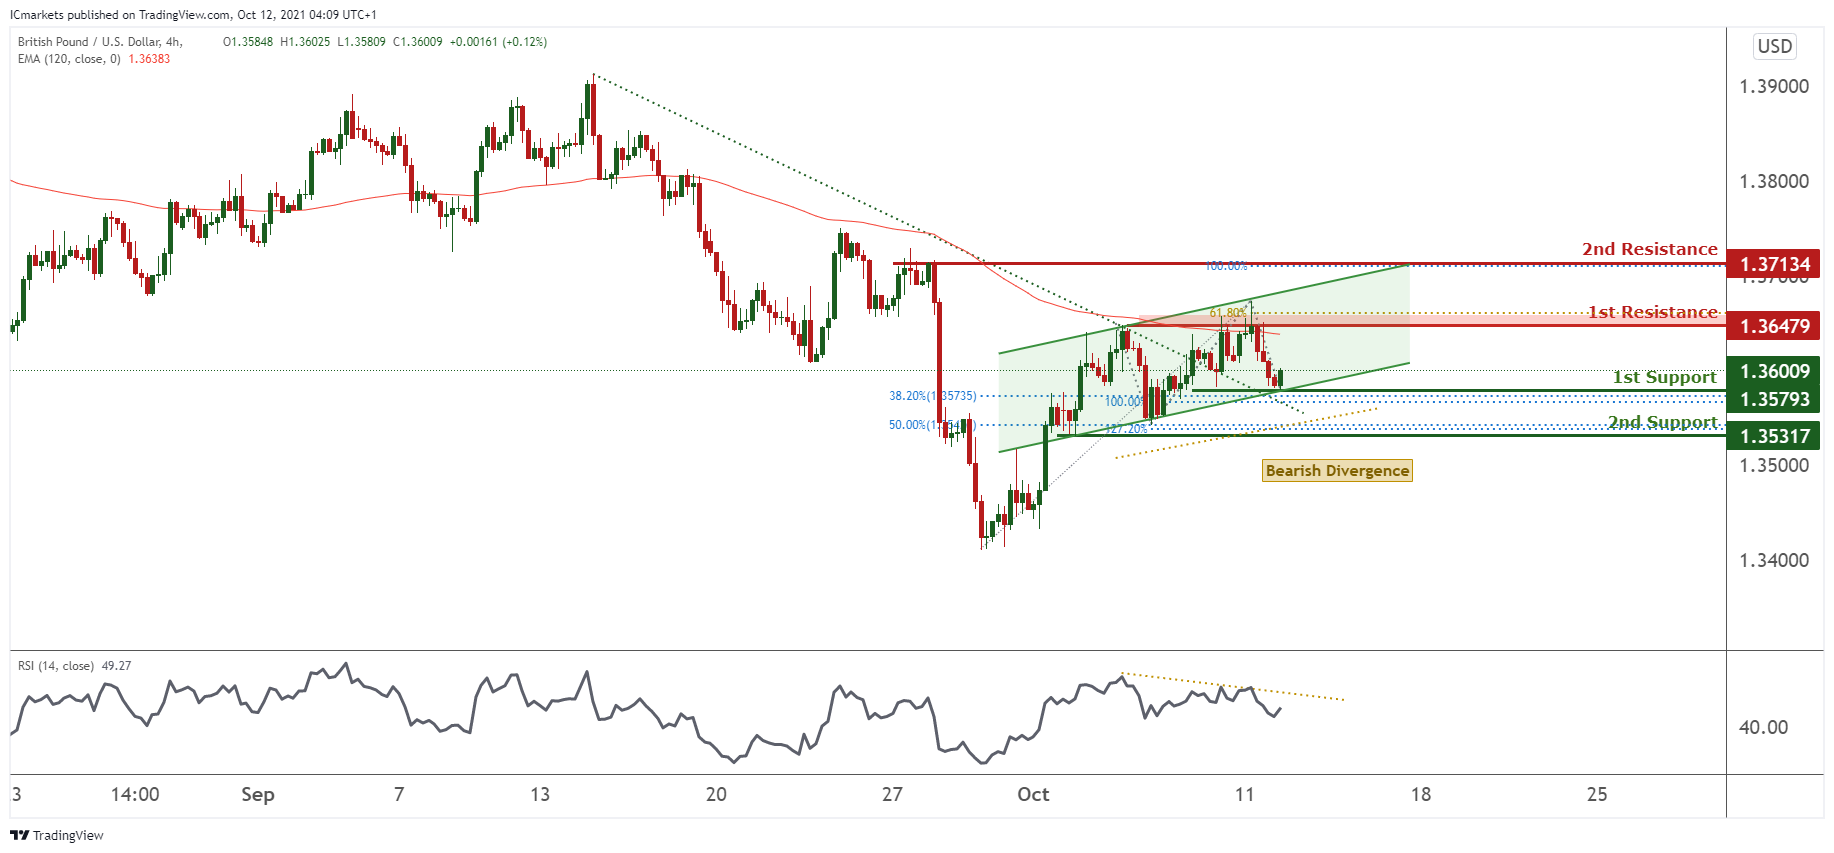
GBP/USD:
Price is currently trading in an ascending channel and is currently experiencing a bounce from the first support level of 1.35793 which is also our 100% projection level and 38.2% retracement level. Price can potentially go to its first resistance level of 1.36486 which is also our 61.8% projection level. Our bullish bias is supported by our ichimoku cloud indicator as price is currently trading above it.
Key considerations:
1st support – 1.35793
1st resistance – 1.36486
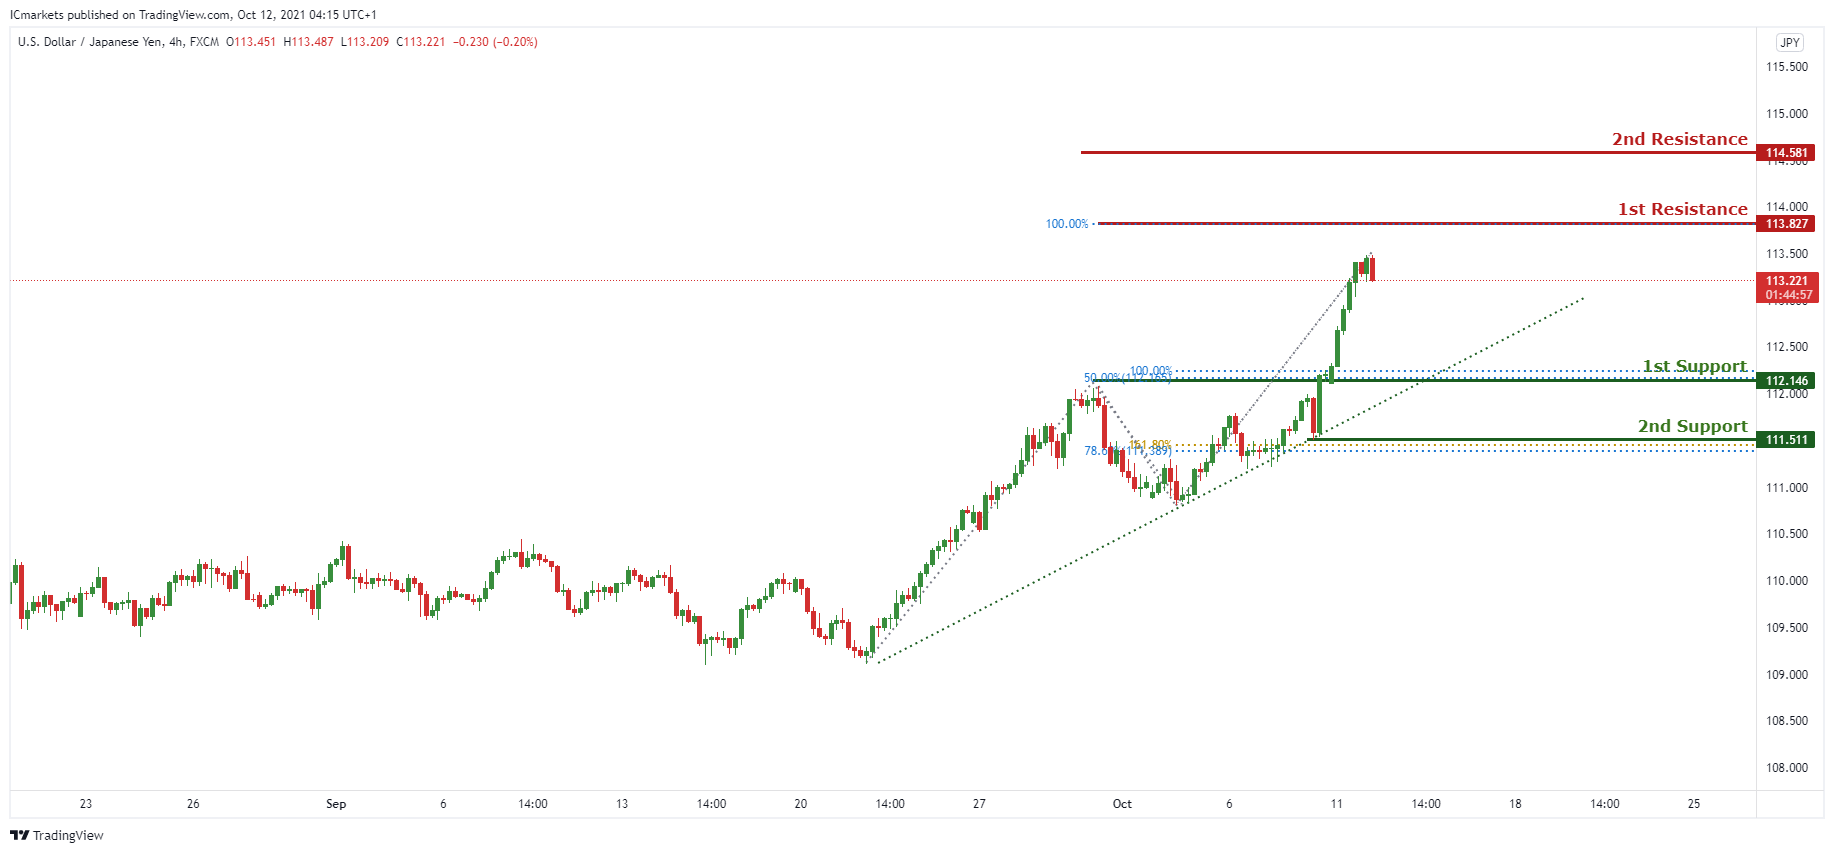
USD/JPY
On the H4 timeframe, we can see that price is abiding by the ascending trendline and we can see price has reached the 1st resistance just as we expected yesterday. Now, we can expect the price to reverse back down to the 1st Support in line with the 50% Fibonacci retracement , 100% Fibonacci projection and ascending trendline support. Our short-term bearish bias is further supported by the RSI indicator where it touched the resistance level and dropped.
Areas of consideration:
- H4 1st resistance level 114.581
- H4 1st support level 112.146
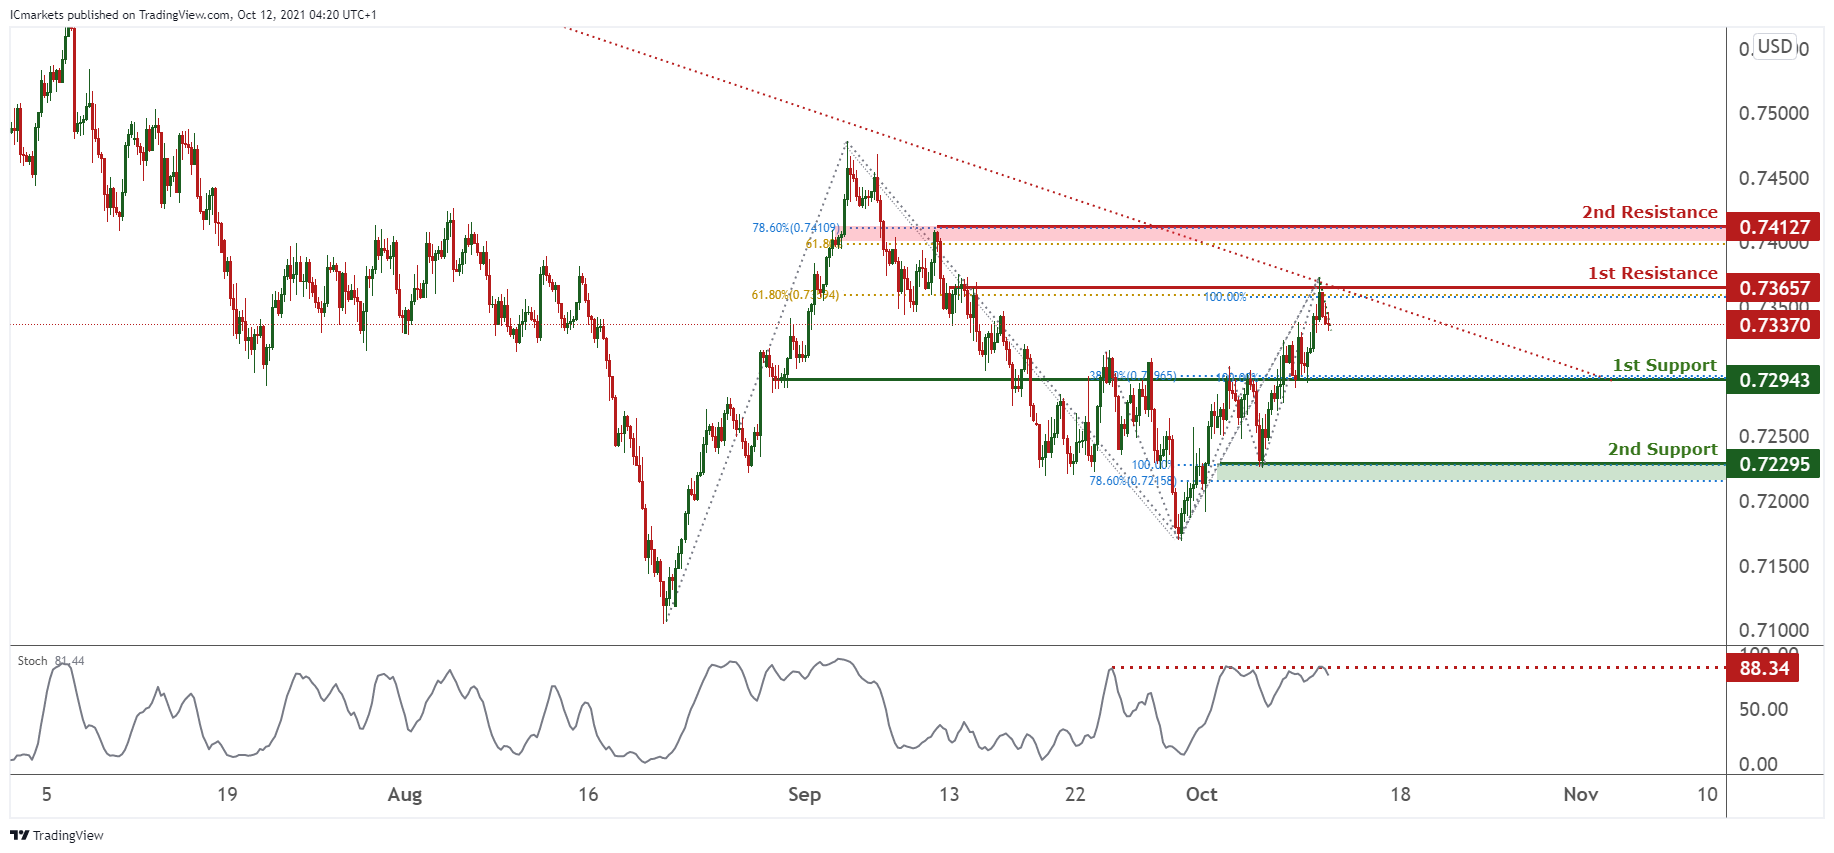
AUD/USD:
On the H4, price is seen to be holding below the descending trendline resistance, signifying a bearish momentum. Price is approaching the 1st resistance where price is in line with the descending trendline resistance, hence we can expect price to drop from 1st Resistance in line with 61.8% Fibonacci Retracement and 100% Fibonacci projection towards the 1st Support in line with 127.2% Fibonacci Projection and 38.2% Fibonacci Retracement. Our bearish bias is further supported by the stochastic indicator where the %K line touched the resistance level and dropped.
Areas of consideration:
- H4 1st resistance level 0.73647
- H4 1st support level 0.72917
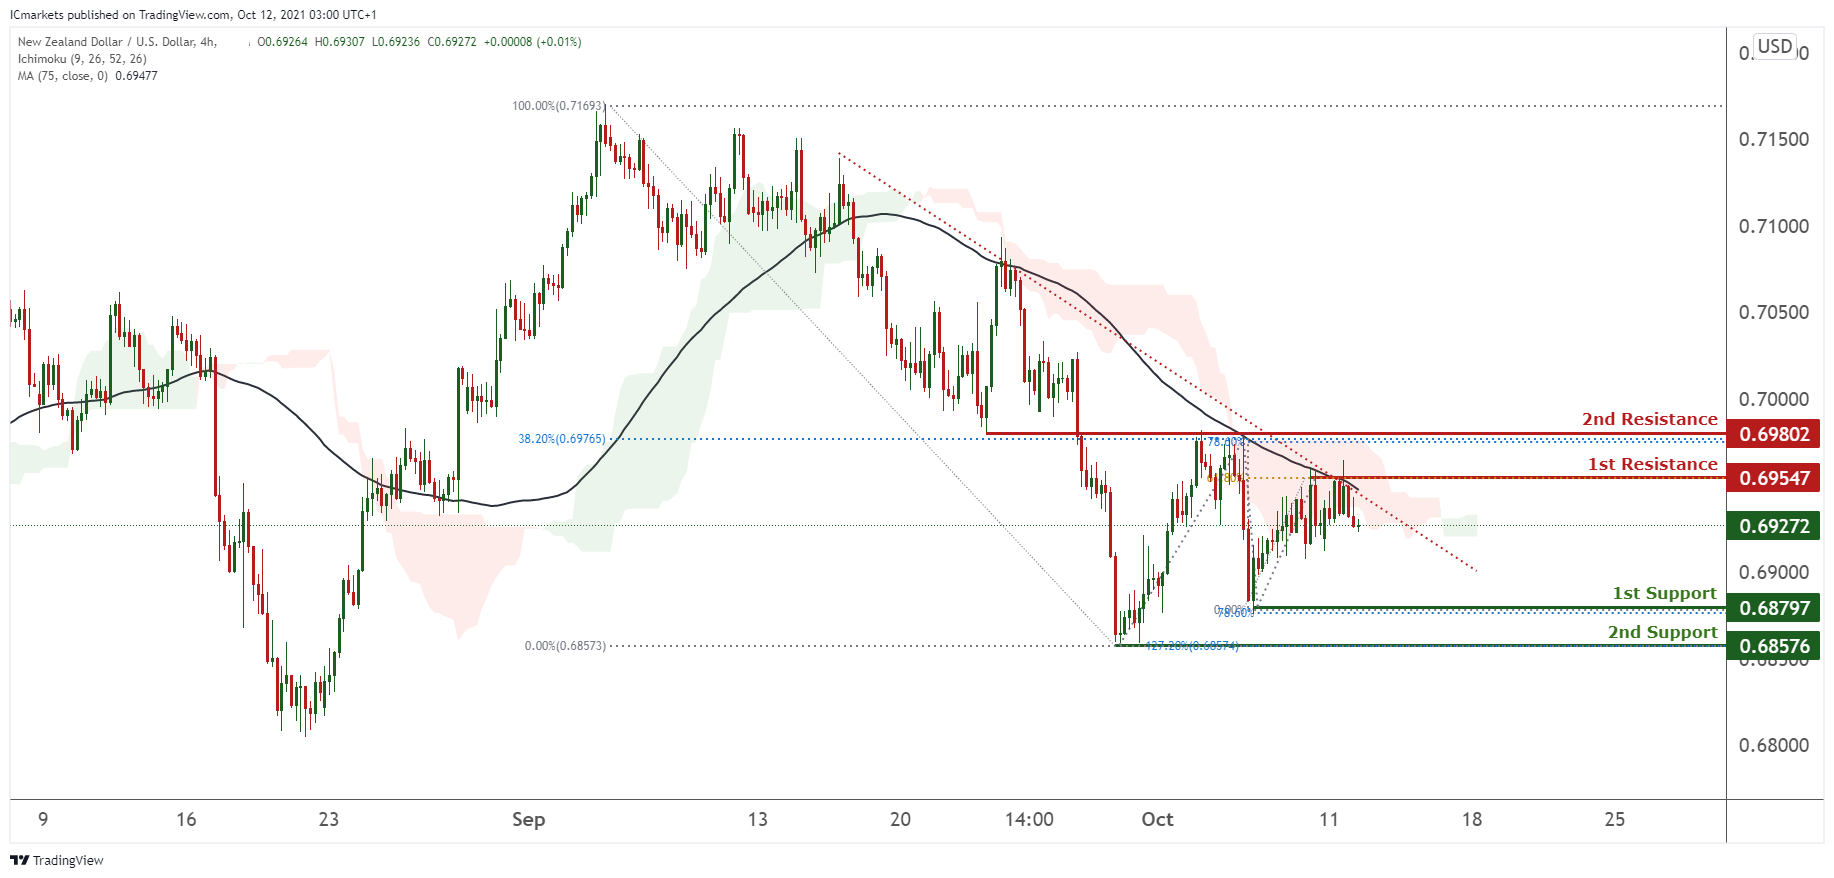
NZD/USD:
On the H4 timeframe, prices are on a bearish momentum. Prices are consolidating near our bearish trendline. We would watch the intermediate resistance at 0.69428 where price might bounce off the descending trendline and potentially dip towards 1st support at 0.68797 in line with 100% Fibonacci retracement. Technical indicators are showing bearish momentum. Alternatively, breaking the bearish trendline will find prices climbing towards our 1st resistance at 0.69789 in line with 38.2% and 78.6% Fibonacci retracement.
Areas of consideration:
- H4 time frame, 1st resistance at 69789
- H4 time frame, 1st support at 0.68797
- H4 time frame, intermediate resistance at 0.69428
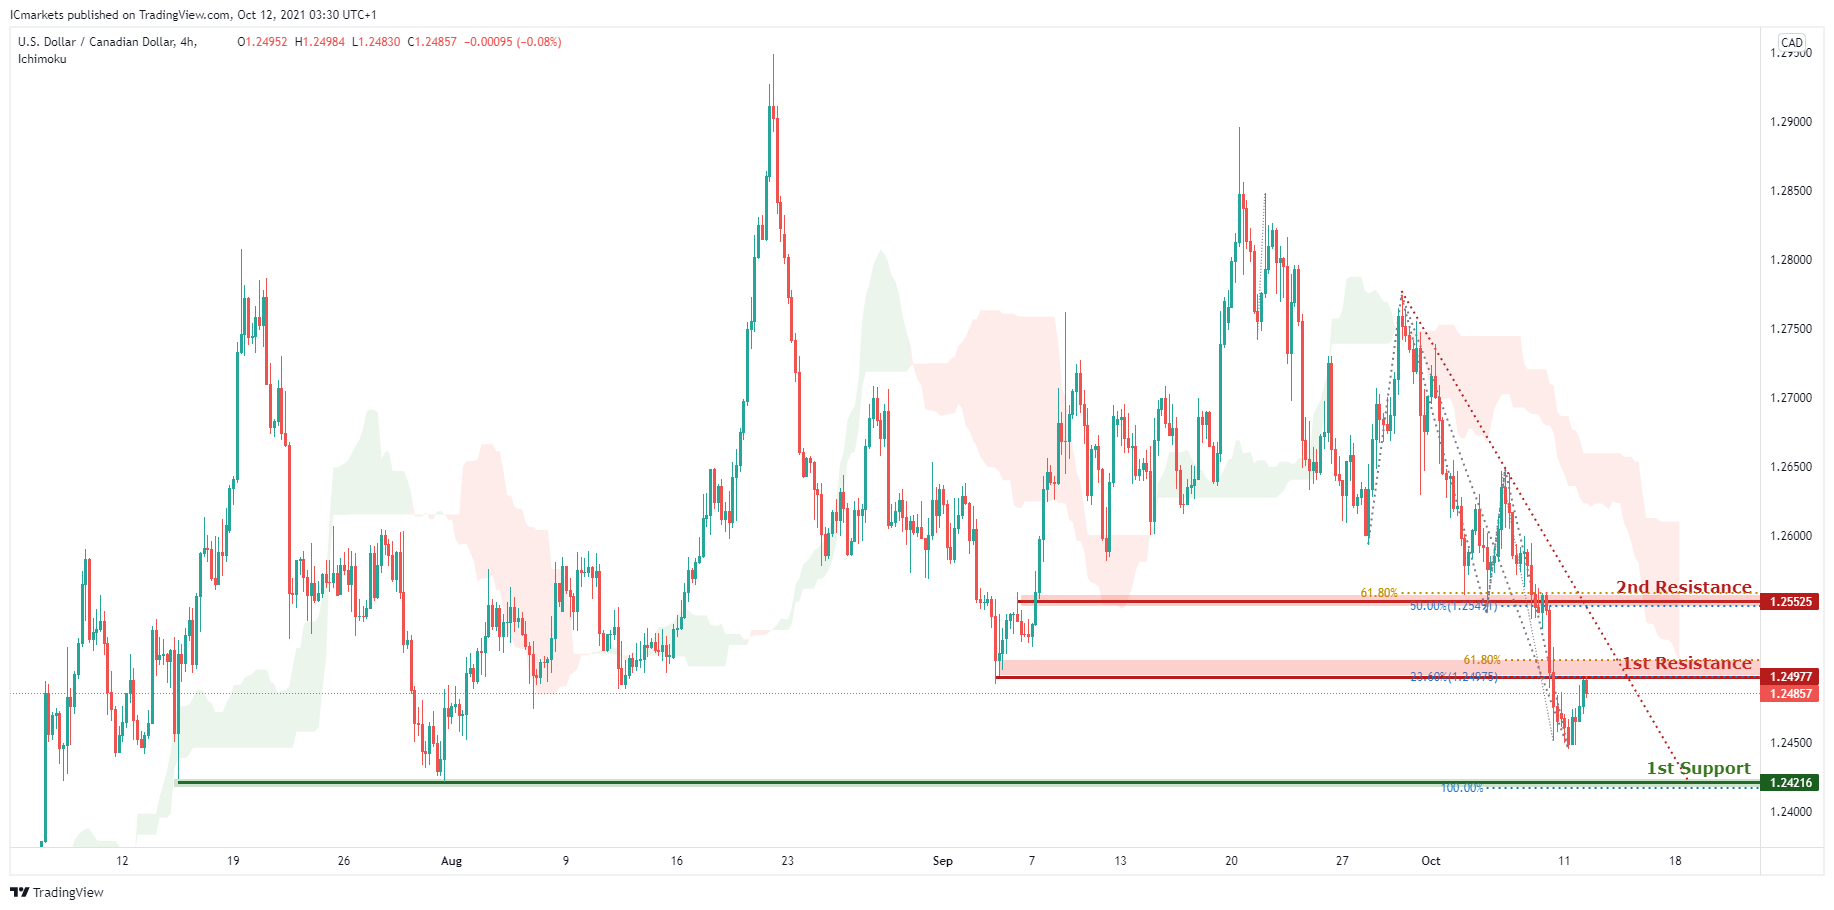
USD/CAD:
On the H4, current price is moving below the ichimoku cloud suggesting a continuation of its bearish movement. We are expecting to see price fall to 1st support at 1.24216 in line with the 100% Fibonacci projection. Otherwise, we may see price do a retest at 1st resistance at 1.24977 in line with the 61.8% Fibonacci projection and the 23.6% Fibonacci retracement. Our bearish bias is further supported by the existing descending trend line.
Areas of consideration:
- H4 time frame, support at 1.24216
- H4 time frame, resistance at 1.24977
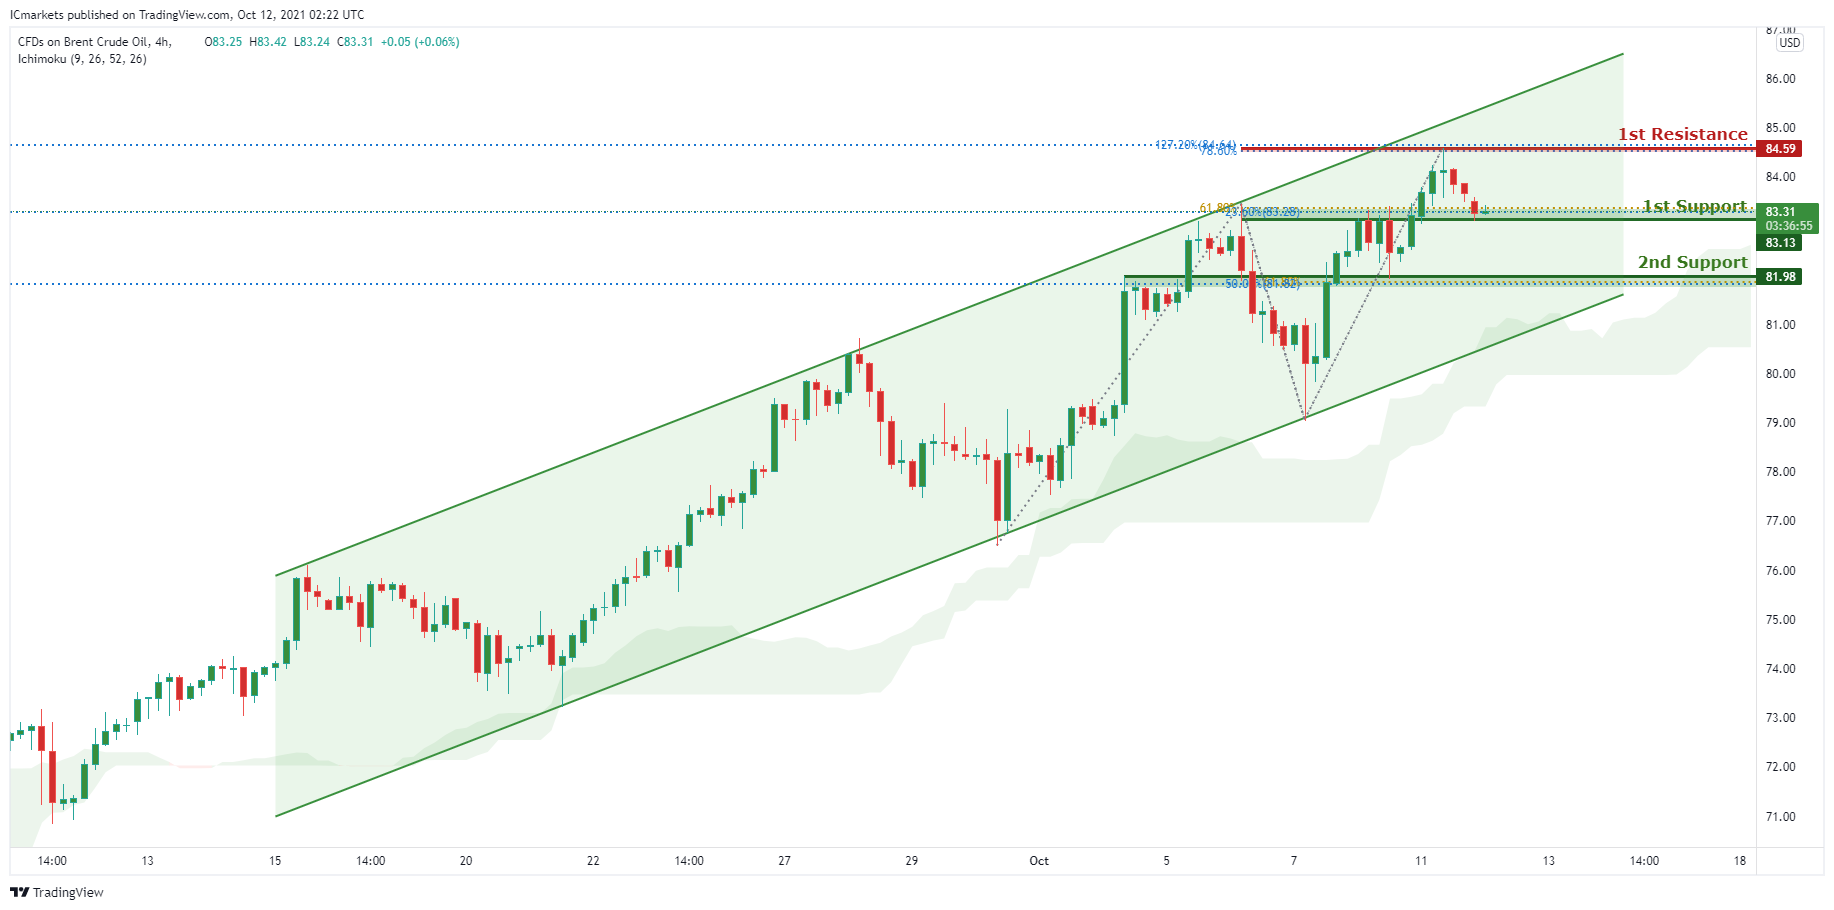
OIL:
On the H4 timeframe, we may see price head for 1st support at 81.98 in line with the 61.8% fibonacci retracement before heading for 1st resistance at 84.62 in line with the 78.6% Fibonacci projection. Although we have a bullish bias which is supported by the ichimoku indicator and the ascending channel, there may still be room for short term downwards movement as price is at the mid of the channel. Otherwise, we may see price head straight to 1st resistance from its current position.
Areas of consideration:
- H4 time frame, 1st resistance of 84.62
- H4 time frame, 1st support of 81.98
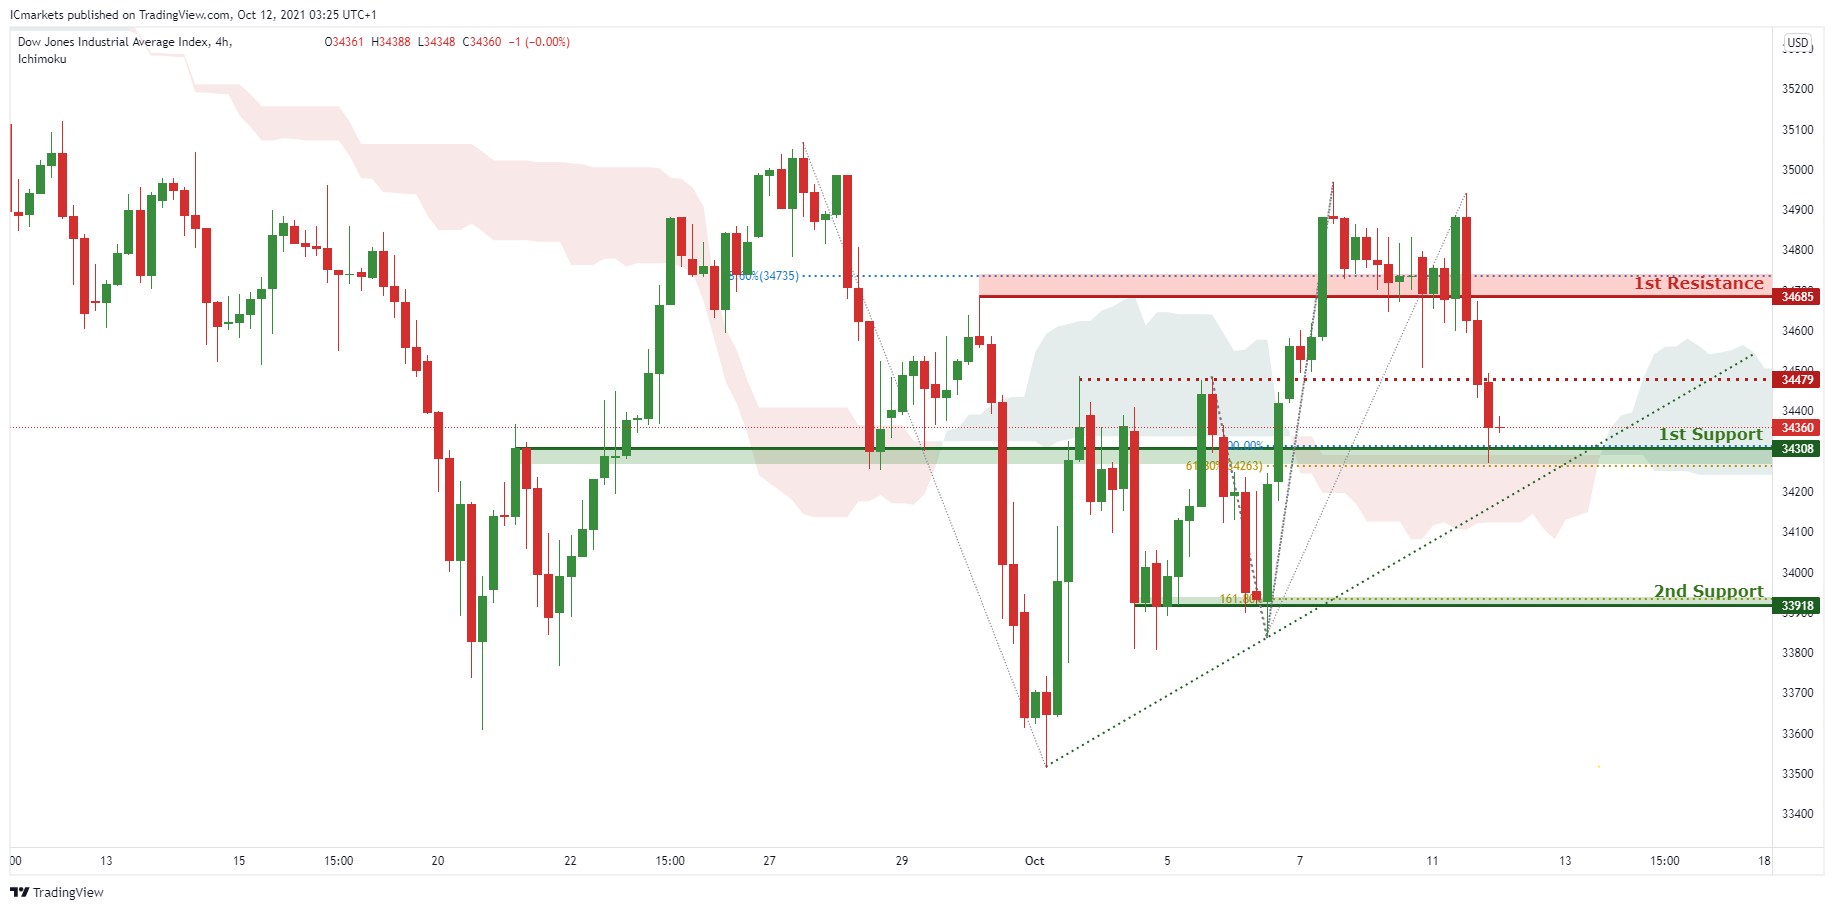
Dow Jones Industrial Average:
On the H4, with a bullish bias, we may expect to see price head to 1st resistance at 34685 in line with the 78.6% Fibonacci retracement. Otherwise if price breaks structure at 1st support at 34308 in line with the 61.8% Fibonacci retracement, we may see further bearish movements to 2nd support at 33918 in line with the 161.8% Fibonacci projection. Our bullish bias is supported by the ichimoku where price is moving above it along with the existing ascending trend line.
Areas of consideration:
- 4H resistance at 34685
- 4H support at 34308
The accuracy, completeness and timeliness of the information contained on this site cannot be guaranteed. IC Markets does not warranty, guarantee or make any representations, or assume any liability regarding financial results based on the use of the information in the site.
News, views, opinions, recommendations and other information obtained from sources outside of www.icmarkets.com.au, used in this site are believed to be reliable, but we cannot guarantee their accuracy or completeness. All such information is subject to change at any time without notice. IC Markets assumes no responsibility for the content of any linked site.
The fact that such links may exist does not indicate approval or endorsement of any material contained on any linked site. IC Markets is not liable for any harm caused by the transmission, through accessing the services or information on this site, of a computer virus, or other computer code or programming device that might be used to access, delete, damage, disable, disrupt or otherwise impede in any manner, the operation of the site or of any user’s software, hardware, data or property.