
A note on lower timeframe confirming price action…
Waiting for lower timeframe confirmation is our main tool to confirm strength within higher timeframe zones, and has really been the key to our trading success. It takes a little time to understand the subtle nuances, however, as each trade is never the same, but once you master the rhythm so to speak, you will be saved from countless unnecessary losing trades. The following is a list of what we look for:
- A break/retest of supply or demand dependent on which way you’re trading.
- A trendline break/retest.
- Buying/selling tails – essentially we look for a cluster of very obvious spikes off of lower timeframe support and resistance levels within the higher timeframe zone.
- Candlestick patterns. We tend to only stick with pin bars and engulfing bars as these have proven to be the most effective.
For us, lower timeframe confirmation starts on the M15 and finishes up on the H1, since most of our higher timeframe areas begin with the H4.
EUR/USD:
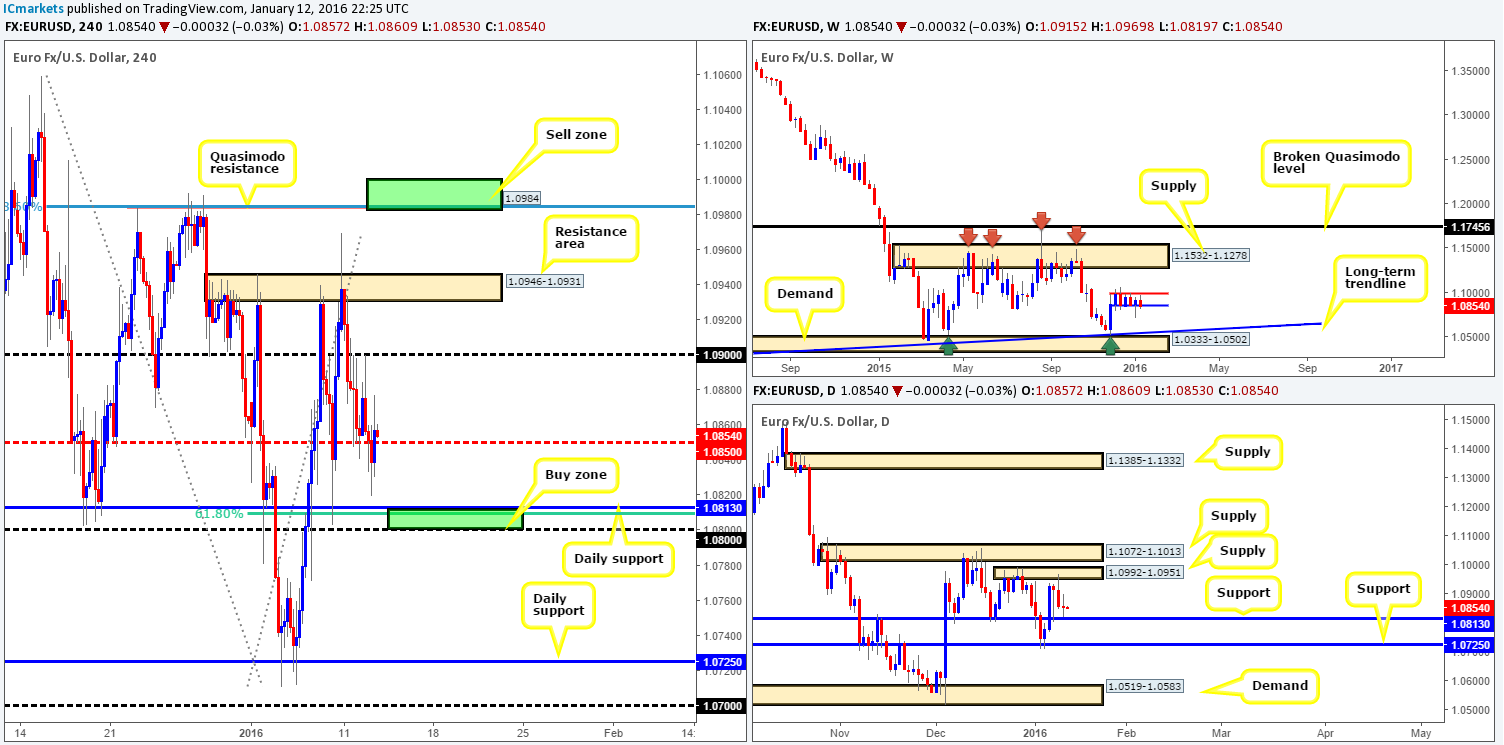
Throughout the course of yesterday’s trade, the single currency was initially seen bid from mid-level support 1.0850 up to psychological resistance 1.0900. It was from this point, the London open, we saw the EUR collapse to lows of 1.0819 before correcting itself back up to highs of 1.0877 into the close. Seeing as how price didn’t connect with our pre-determined buy or sell zones yesterday, much of the following report will remain similar to the previous.
Ultimately, the areas we’re looking to trade from are the H4 Quasimodo level coming in at 1.0984, and daily support drawn from 1.0813. Everything else in between is considered mid-range to us. What we mean by mid-range here is simply levels that do not merge with higher-timeframe structures.
In regard to the above said H4 Quasimodo resistance level, the reason we’ve selected this barrier as our chosen level to short from simply comes from the following: (The below structures form our sell zone and a pending order has been placed at 1.0983 with a stop above at 1.1010)
- A lot of people are probably wondering why we did not select the H4 resistance zone seen at 1.0946-1.0931 considering it’s positioned just beneath daily supply at 1.0992-1.0951. The reason for why is the spike seen on the 10th Jan at 1.0969 likely took out a huge amount of stops from here, thus potentially weakening this zone.
- The H4 Quasimodo sits nicely within the extremes of the above said daily supply zone.
- It also blends beautifully with the 78.6% Fibonacci barrier at 1.0985.
- Large Psychological resistance sits just above at 1.1000.
To the downside, nevertheless, we have our eye on the daily support mentioned above at 1.0813 for longs today. This number boasts both a 61.8% Fibonacci level at 1.0808 and psychological support coming in at 1.0800, which fuse together to form our buy zone in this market. Dependent on the time of day and the H4 approach to this zone, we would consider entering long from here at market.
Levels to watch/live orders:
- Buys: 1.0813 [Possible entry at market here] (Stop loss: 1.0795).
- Sells: 1.0983 [Pending order] (Stop loss: 1.1010).
GBP/USD:
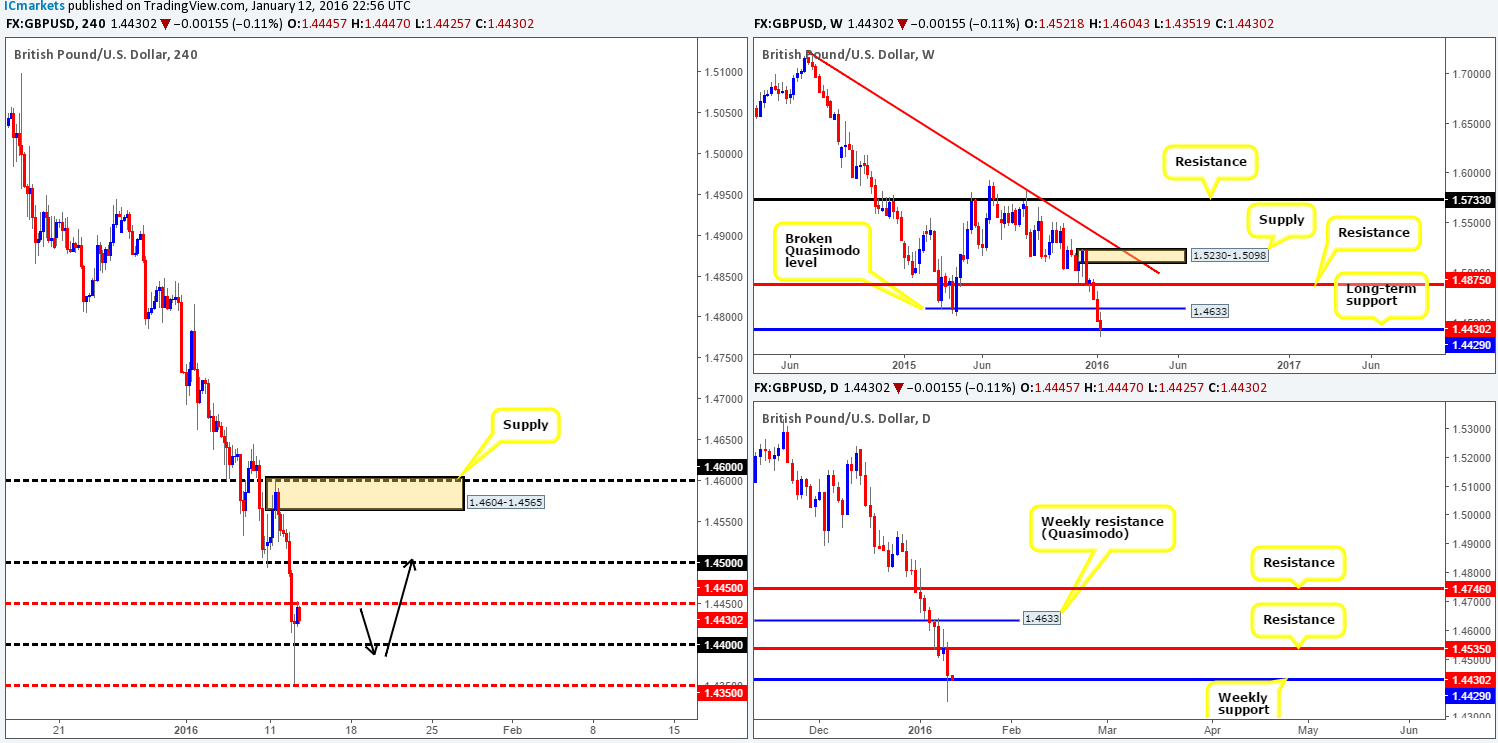
The GBP/USD pair, as you can see, cascaded lower during the course of yesterday’s sessions, engulfing bids around psychological support 1.4500, and ending the day stamping in a vicious-looking buying tail off the back of 1.4400/1.4350.
As can be seen from both the weekly and daily charts, this recent sell-off also brought Cable into the jaws of a major weekly support level chalked up at 1.4429, which, for the time being is holding firm. This long-term level has capped downside movement on this pair since 2009, so this is certainly a key turning point to keep an eye on!
Given the significance of the weekly number, our attention will be driven toward longs today. Ideally, what we’re looking for is price to pullback from mid-level resistance 1.4450 and connect with 1.4400. Due to how quick price whipsawed through 1.4400 yesterday, there’s likely unfilled orders still present here. Therefore, should we see a lower timeframe setup form around this number today, we’d jump in long, targeting 1.4450, followed closely by 1.4500 since this number sits just below daily resistance at 1.4535.
Levels to watch/live orders:
- Buys: 1.4400 [Tentative – confirmation required] (Stop loss: dependent on where one confirms this level).
- Sells: Flat (Stop loss: N/A).
AUD/USD:
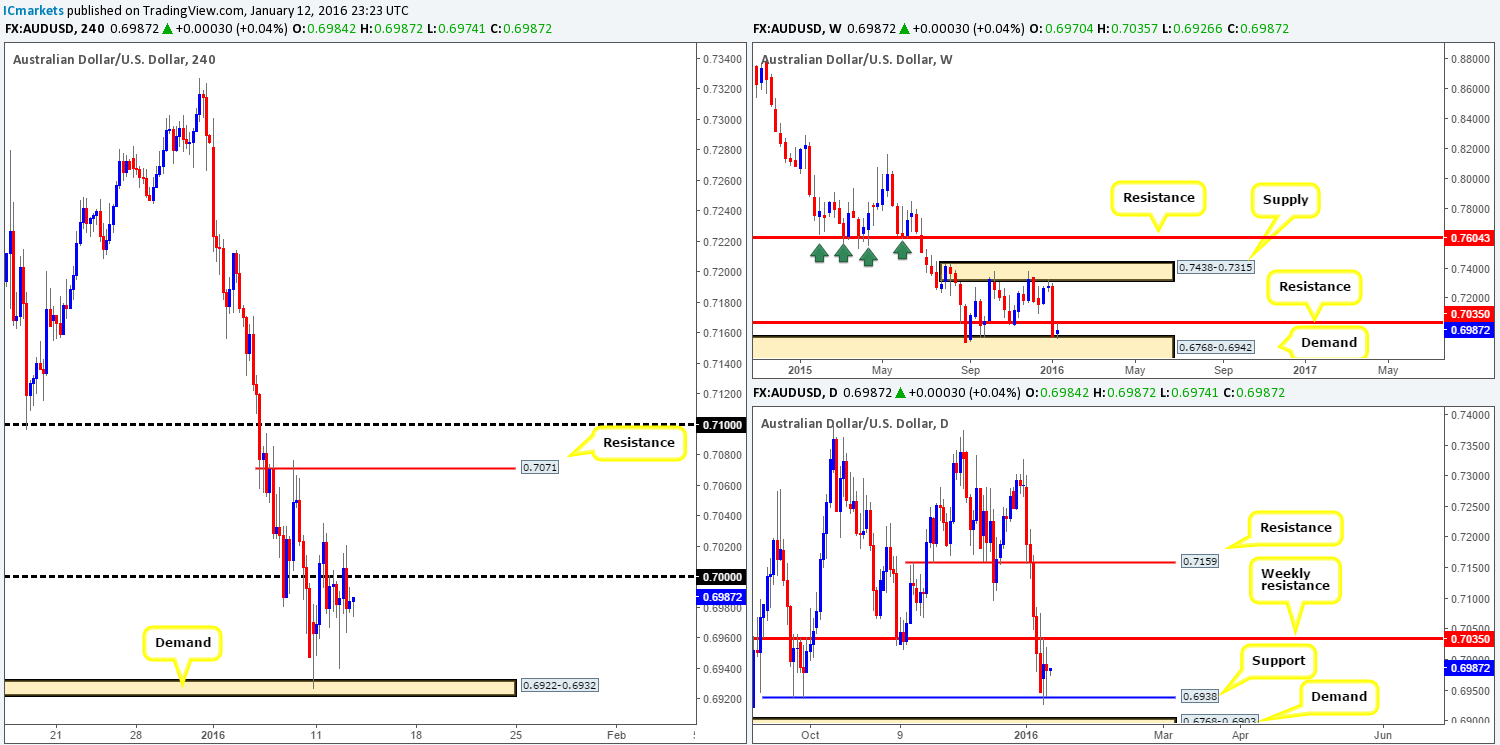
Amid yesterday’s sessions, the AUD sold off to lows of 0.6939 during the beginning of European trade. It was from this point though, London traders entered the market. The commodity currency was heavily bid from here, but failed to sustain gains above the large psychological resistance 0.7000, consequently ending the day largely unchanged.
This pair is a rather tricky one to read at the moment. On the one hand, we have price trading at weekly demand chalked up from 0.6768-0.6942, and alongside this, daily support at 0.6938. However, directly above this barrier of support hangs a weekly resistance level coming in at 0.7035. Although the trend on this pair is predominantly south, the market has been ranging for quite a few months now. Therefore, traders are left with a precarious situation – buy into resistance or sell into support?!?!
In light of the above, we do not see any immediate opportunity that takes our fancy right now. To be on the safe side, we believe it is best to pass on this pair until the higher timeframes are at least in alignment with one another.
Levels to watch/live orders:
- Buys: Flat (Stop loss: N/A).
- Sells: Flat (Stop loss: N/A).
USD/JPY:
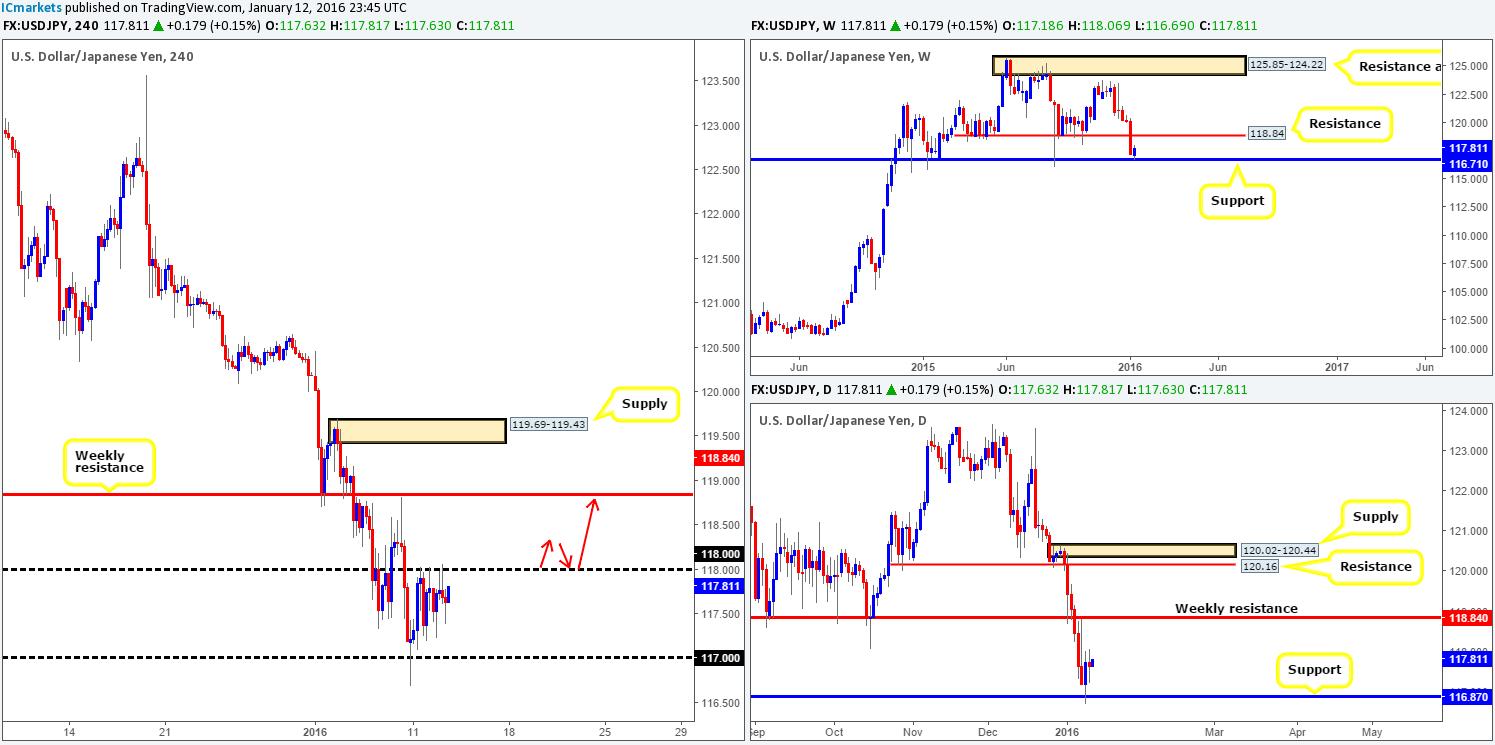
Although price moved very little throughout the course of the day yesterday, the structure of price action is interesting. Psychological resistance 118.00 was clearly well-offered during the day. However, notice what price was doing below this number… Check out the lows printed at 117.92/117.22/117.38. These are, as far as we see, demand consumption tails. In other words, unfilled buy orders were being filled as price attempted to break above 118.00.
Therefore, with candle action suggesting further buying could take place today, and both weekly and daily support (116.71/ 116.87) bolstering this market right now, where do we go from here? Well, much the same as yesterday’s analysis, our outlook for today is relatively simple. Either price breaks above 118.00 and retests it as support to enter long, or price continues to trade lower and we remain flat. In the event the former takes place, we’ll be looking to close the full position out around the weekly resistance level at 118.84.
Levels to watch/live orders:
- Buys: Watch for offers to be consumed around 118.00 and look to trade the retest thereafter (lower timeframe confirmation preferred).
- Sells: Flat (Stop loss: N/A).
USD/CAD:
Starting from the top this morning, weekly action shows that price remains teasing the upper channel resistance band extended from the high 1.1173. Down on the daily timeframe, nevertheless, resistance chalked up from 1.4261 was offered during yesterday’s session.
Turning our attention to the H4 timeframe, psychological support 1.4200 was beautifully retested as support going into the American open yesterday, resulting in the market rallying over 100 pips up to psychological resistance 1.4300. 1.4200 was in actual fact a noted level in our previous report to watch for confirmed buys. Unfortunately, we missed this move altogether which was a shame since there was an almost perfect buy signal at 14.45 GMT in the form of a buying tail on the M15 chart.
In respect to today’s sessions, it’s challenging to say the least. On the one hand, resistance is coming in from both the weekly upper channel resistance band and daily resistance (see above), and on the other, we have an extremely strong trend in place that has proven it’s capable of taking out major resistances. To that end we’re left with the predicament of either buying into resistance or selling into the trend…
Personally, we vote neither and are going to take the more conservative route here, opting to stand on the sidelines until further development is seen.

Levels to watch/live orders:
- Buys: Flat (Stop loss: N/A).
- Sells: Flat (Stop loss: N/A).
USD/CHF:
For those who read our previous report on the Swissy pair (http://www.icmarkets.com/blog/tuesday-12th-january-daily-technical-outlook-and-review/), you may recall us mentioning to watch for price action to retest parity (1.0000) for a possible long into the market. As you can see, price did indeed retest this number (albeit a little deeper than expected) and, as a result, rallied to highs of 1.0046 on the day. Well done to any of our readers who managed to get in on this move.
In light of the above, what’s likely in store for this market today? Well, with both the weekly support area at 0.9796-0.9902 and a daily demand area at 0.9851-0.9926 currently bolstering this market, further upside is a strong possibility up to at least psychological resistance 1.0100 (sits just below a daily resistance level at 1.0123 that blends together with a 61.8% Fibonacci number at 1.0123). In addition to this, there are two clear consumption wicks seen on the H4 marked with black arrows at 1.0052/1.0076, suggesting the path north is clear.
We are not expecting much resistance to be seen from the mid-level number 1.0050, but what it could do is provide us a platform to enter long from should it be retested (with lower timeframe confirmation) following a break higher. Granted, the risk/reward will not be as good as getting in from 1.0000, but it could, with the right stop-loss placement, provide at least a 2:1 trade.
Seeing as the daily resistance level is quite a hefty structure, shorting between 1.0100 and this daily structure (alongside lower timeframe confirming price action) is also another possibility today. The reason for requiring confirmation within this region simply comes from the possibility that weekly price may fake above this level to connect with offers at a faked supply coming in at 1.0239-1.0131.
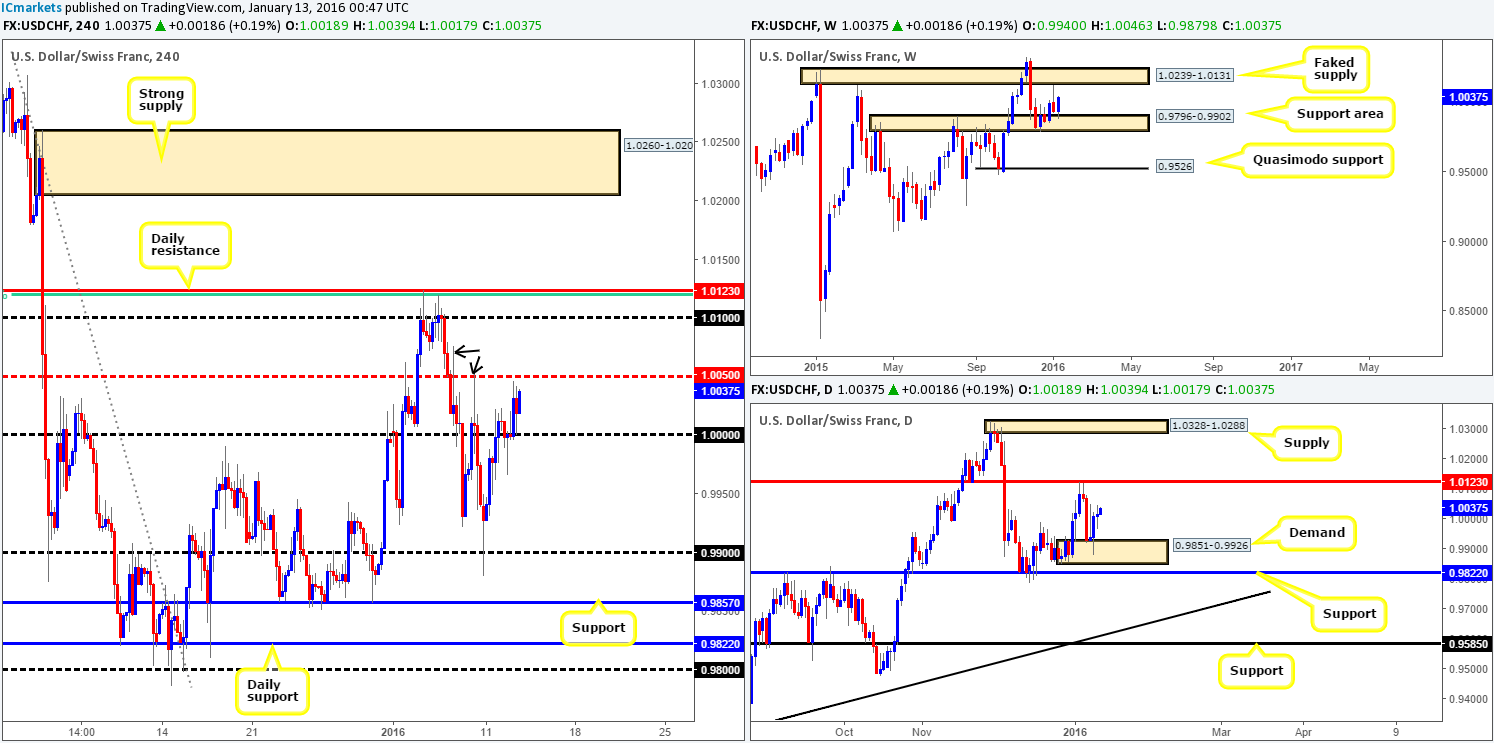
Levels to watch/live orders:
- Buys: Watch for offers to be consumed around 1.0050 and look to trade any retest of this level seen thereafter (lower timeframe confirmation required).
- Sells: 1.0100/1.0123 region [Tentative – confirmation required] (Stop loss: dependent on where one confirms this area).
DOW 30:
Beginning with a look at the weekly timeframe this morning, we see little in the way of technical support reinforcing the current buying from 16179 – the closest support via this timeframe falls in at 15978. In a similar fashion, down on the daily timeframe, the nearest support base comes in at 15902-16083, and yet price turned before hitting this zone. In the event that this upside momentum continues to take place, however, we could see the market collide with daily resistance penciled in at 16708. It will be interesting to see what the H4 timeframe has to offer…
Much like its higher-timeframe brothers, the H4 also has (as far as we can see) no fixed support around the 16179 area. The closest comes in at a Quasimodo support seen at 16070.
At this point, nonetheless, price is seen trading at the underside of a minor resistance at 16536, which if breached, could lead to prices rallying to the aforementioned daily resistance hurdle. With that in mind, we may consider a buy trade should price retest 16536 as support following a break higher (waiting for lower timeframe confirmation here is highly recommended).
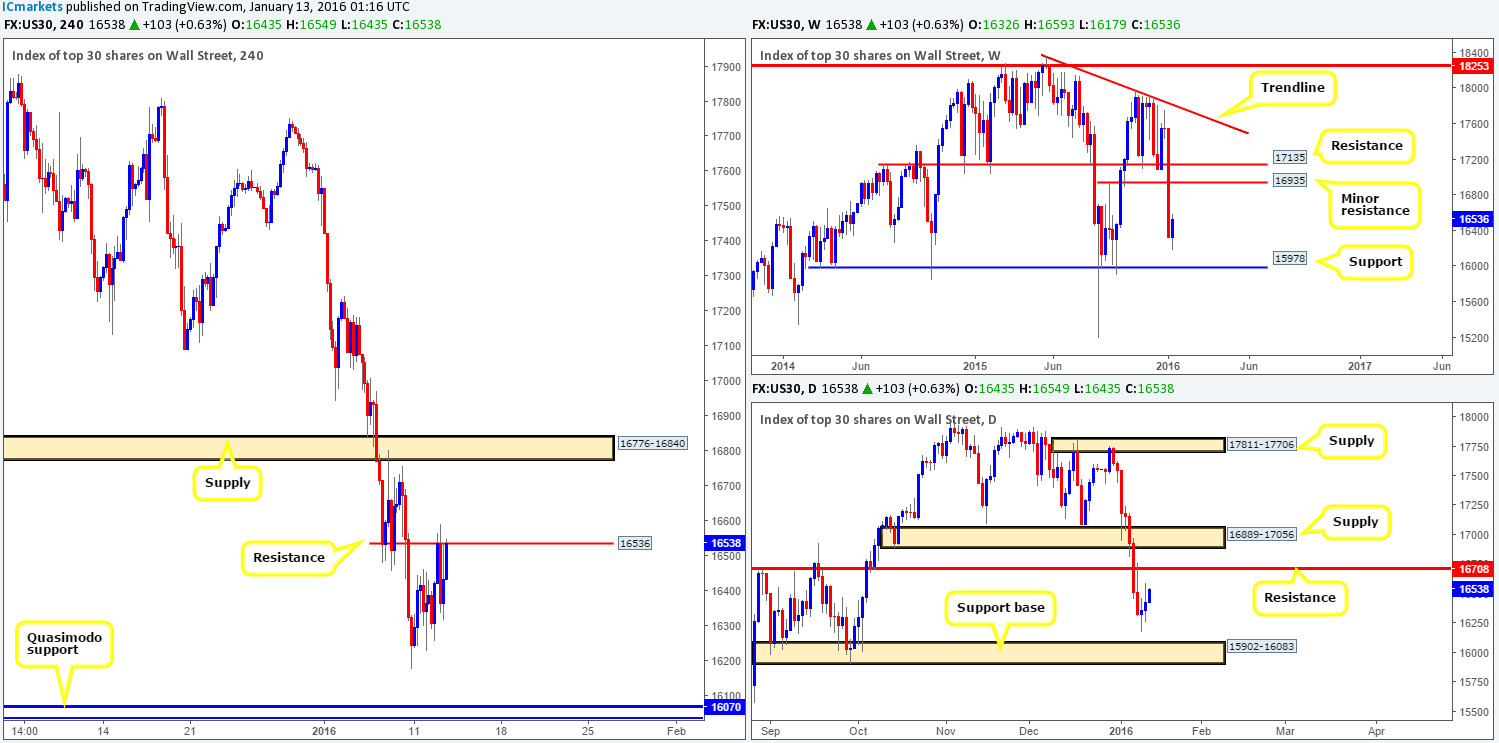
Levels to watch/live orders:
- Buys: Watch for offers to be consumed around 16536 and look to trade any retest of this level seen thereafter (lower timeframe confirmation required).
- Sells: Flat (Stop loss: N/A).
XAU/USD: (Gold)
In our previous report on Gold (http://www.icmarkets.com/blog/tuesday-12th-january-daily-technical-outlook-and-review/), you may recall us mentioning to watch for lower timeframe shorts around the H4 broken Quasimodo line at 1095.6. As can be seen from the chart, traders had little need to scroll down to the lower timeframes as the H4 printed a picture-perfect bearish selling tail around this number. By the time we spotted the candle, however, it was too late, price had already moved too far beyond the entry point unfortunately! Well done to any of our readers who took advantage of this move!
The most recent sell-off marks the third consecutive losing day for the yellow metal, and has resulted in price shaking hands with daily support coming in at 1084.5, which fuses together nicely with a 50.0% Fibonacci level at 1085.5. Although the daily chart conveys support, we mustn’t forget where price came from – weekly supply at 1098.6-1121.7! As such, a long position will only be permitted at this daily support if and only if there’s some sort of lower timeframe buying seen here (a break of supply/buying tails at lower timeframe support etc…).
In the event that the daily level caves in, nevertheless, all eyes will be on the H4 demand fixed at 1074.8-1077.1 (positioned around the minor daily support at 1078.0) for potential long trades. In addition to this, there may, dependent upon if price retests 1084.5 as resistance and produces a lower timeframe sell signal, be an opportunity to short this market down to the above said H4 demand.
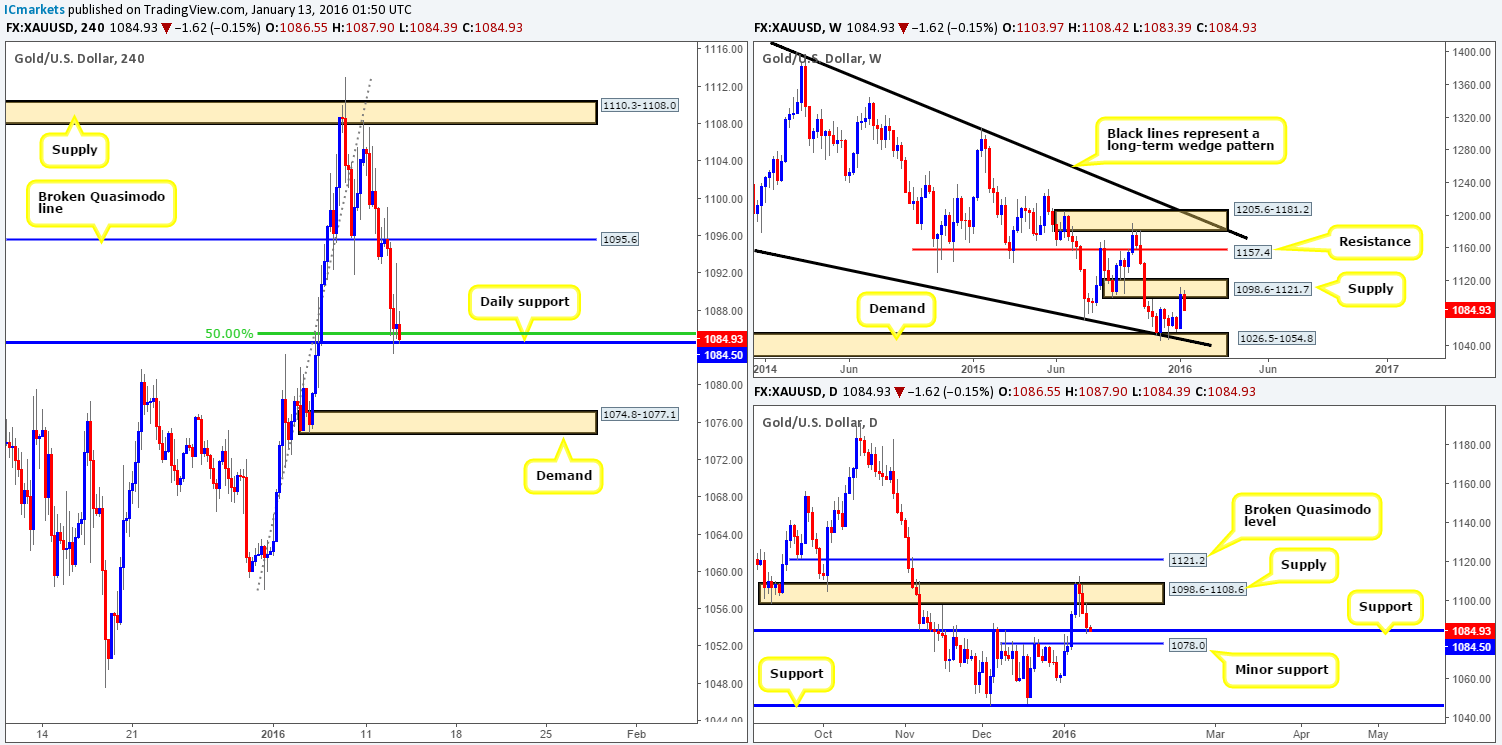
Levels to watch/live orders:
- Buys: 1084.5 [Tentative – confirmation required] (Stop loss: dependent on where one confirms this level). 1074.8-1077.1 [Tentative – confirmation required] (Stop loss: dependent on where one confirms this area).
- Sells: Watch for bids to be consumed around 1084.5 and look to trade the retest seen thereafter (lower timeframe confirmation required).


