
DXY:
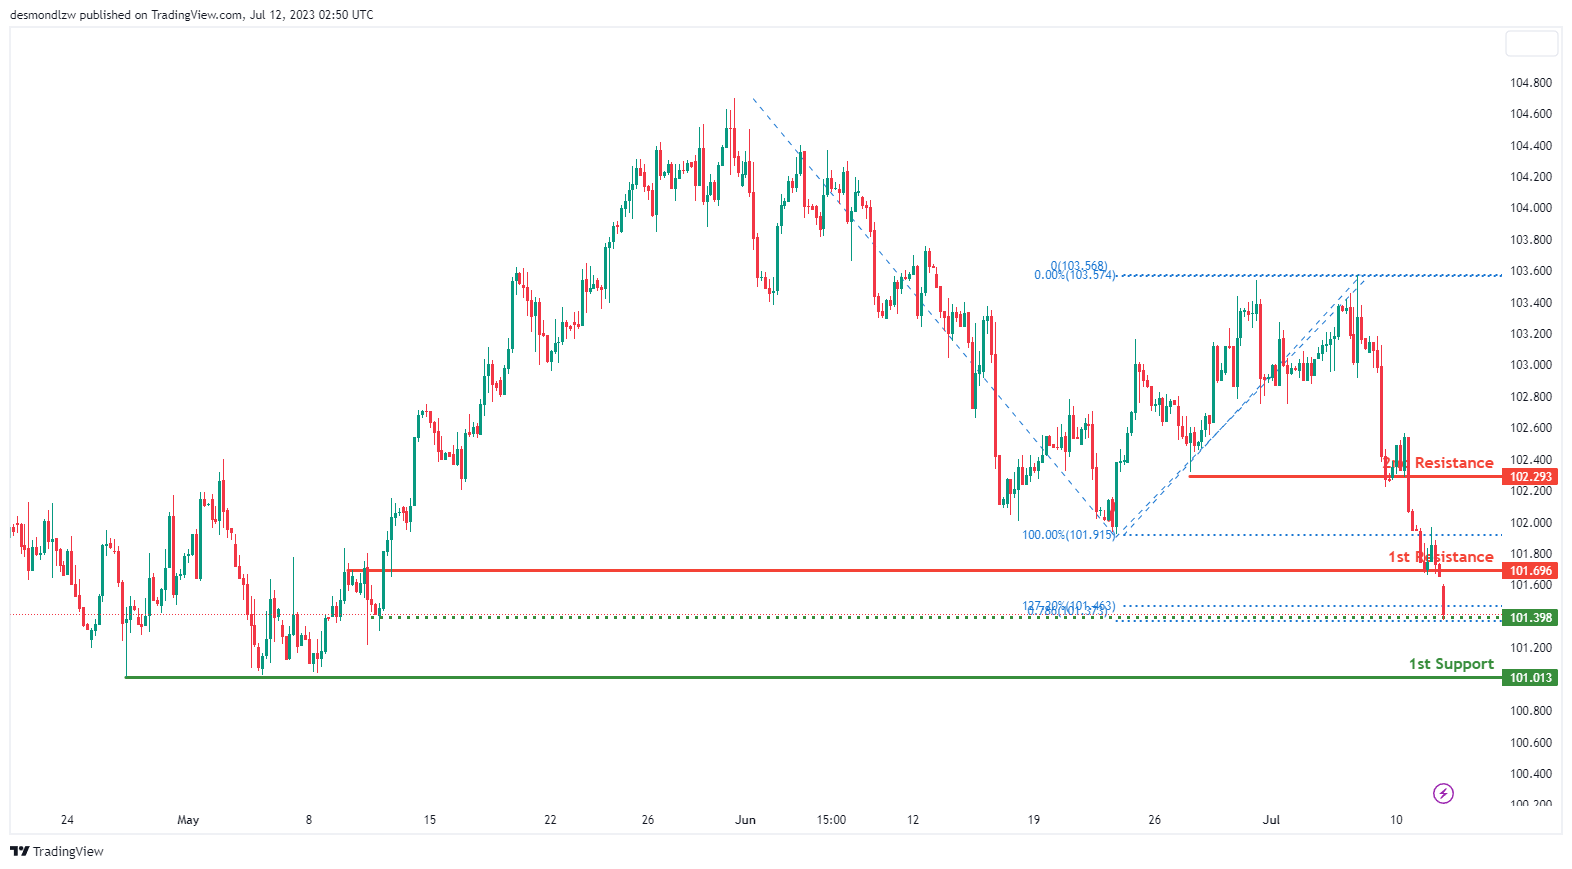
The DXY index is currently demonstrating a bearish momentum, indicating a possible continued downward movement towards the 1st support level.
The intermediate support level is found at 101.39 and is characterized as a pullback support. This level also aligns with a 127.20% Fibonacci extension and a 78.60% Fibonacci projection levels, enhancing its significance as a potential stabilization point in the event of a price decline.
Should the price continue to drop, the 1st support situated at 101.01, an overlap support, could offer another layer of stability.
In contrast, if the price reverses its course, it could encounter the 1st resistance at 101.69, characterized as an overlap resistance. This level could serve as a potential barrier to upward price movements.
If the price manages to surpass the 1st resistance, it could aim for the 2nd resistance level positioned at 102.29. This level also serves as an overlap resistance, marking another potential point of resistance.
EUR/USD:
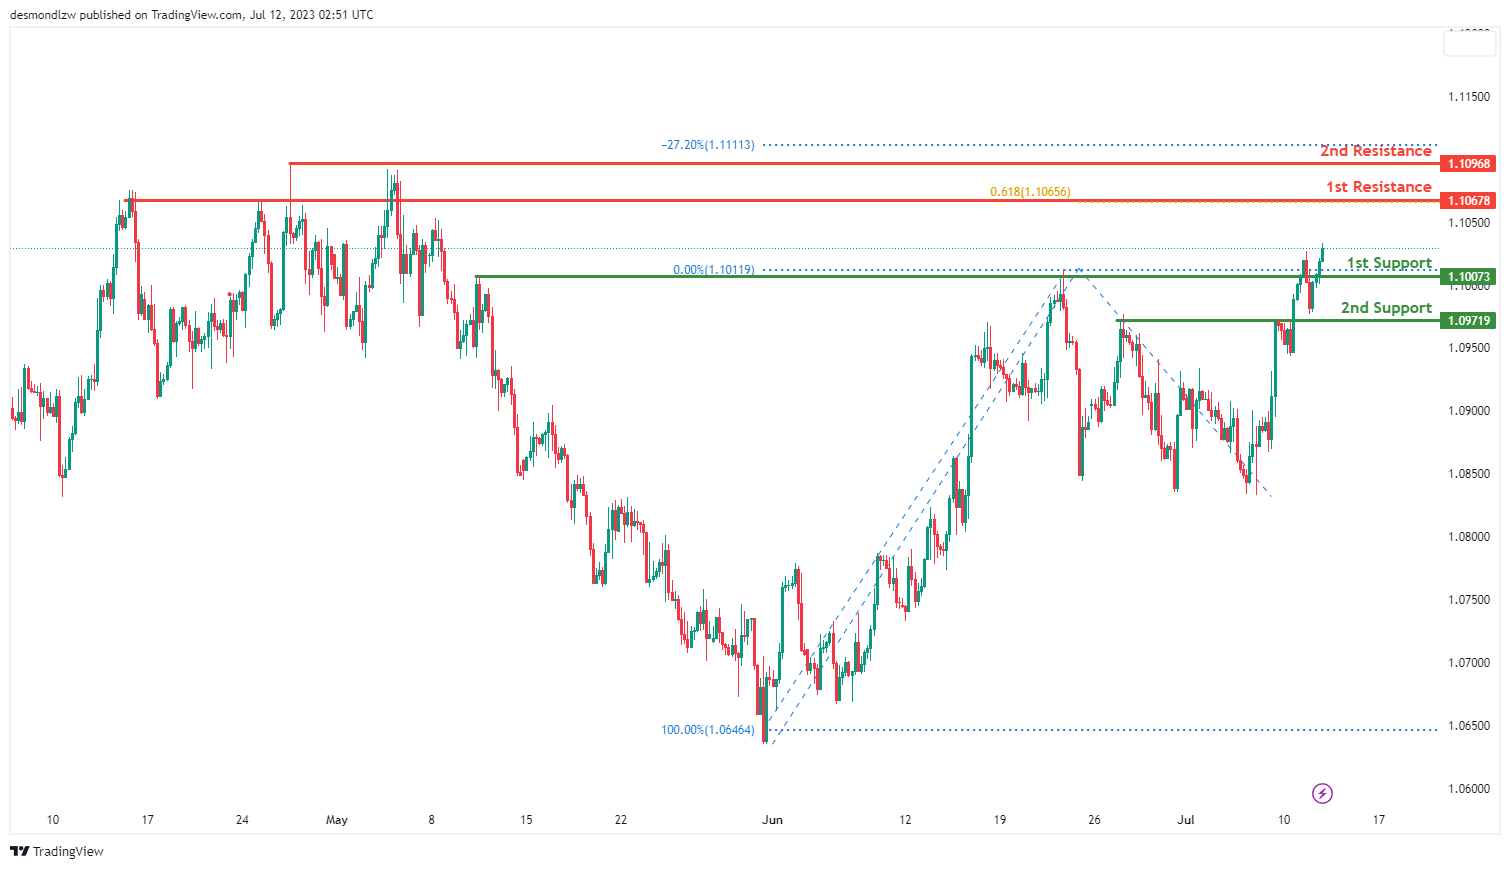
The EUR/USD pair is currently displaying a bullish trend, indicating a potential for a bullish continuation towards the 1st resistance level.
On the downside, the price may find substantial support at the 1st level of 1.1007, identified as an overlap support, which can provide significant stability for the price. A further descent could be cushioned by the 2nd support level at 1.0972, another overlap support.
On the upside, the price may continue its bullish trend towards the 1st resistance level at 1.1068. This overlap resistance coincides with a 61.80% Fibonacci projection level, bolstering its significance.
If the price manages to surpass this resistance, it might aim for the 2nd resistance level at 1.1097. This overlap resistance aligns with a -27% Fibonacci expansion level, adding further weight to its role as a potential barrier to further price increases.
EUR/JPY:
The EUR/JPY instrument currently demonstrates a bearish momentum. It is anticipated that the price may continue its downward movement towards the 1st support.
The 1st support level is located at 153.43 and is considered significant due to its role as an overlap support, as well as its alignment with the 78.60% Fibonacci projection and the 38.20% Fibonacci retracement, indicating a Fibonacci confluence.
The 2nd support level is positioned at 151.68 and is recognized as a strong support level, representing an overlap support and aligning with the 50% Fibonacci retracement.
Moving on to the resistance levels, the 1st resistance is found at 154.20 and is deemed significant due to its status as an overlap resistance. The 2nd resistance level is situated at 155.32 and is considered noteworthy as it represents an overlap resistance.

EUR/GBP:
The EUR/GBP pair currently demonstrates a bearish momentum. This is supported by the fact that the price is below the bearish Ichimoku cloud, which contributes to the overall downward trend.
Given this bearish momentum, there is potential for the price to continue its downward movement towards the 1st support level. The 1st support level is located at 0.8492 and is considered significant as it represents an overlap support and aligns with the 61.80% Fibonacci projection.
The 2nd support level is positioned at 151.6800 and is recognized as a strong support level. It represents a swing low support, and it aligns with the -61.8% Fibonacci expansion and the 100% Fibonacci projection, indicating a Fibonacci confluence.
On the other hand, the 1st resistance is found at 154.2000 and is significant due to its overlap resistance. The 2nd resistance level is situated at 155.3200 and is considered noteworthy as it represents an overlap resistance.

GBP/USD:
The GBP/USD pair is presently exhibiting a bullish momentum, signifying a potential bullish continuation towards the 1st resistance level.
The 1st support is found at 1.2847 and is recognized as an overlap support, offering a critical level of price stability. Further, the 2nd support level is located at 1.2754, another overlap support, offering additional assurance in case of a downward price move.
On the upward side, the price may continue its bullish movement towards the 1st resistance level at 1.2999. This overlap resistance aligns with a 78.60% Fibonacci retracement and a 78.60% Fibonacci projection levels in addition to the 161.80% Fibonacci expansion level, , indicating a Fibonacci confluence.
Should the price breach this level, the next target could be the 2nd resistance level at 1.3143. This overlap resistance coincides with a 100% Fibonacci projection level, providing another potential hurdle for further price ascension.

GBP/JPY:
The GBP/JPY instrument currently exhibits a bearish momentum. It is anticipated that the price may continue its downward movement towards the 1st support level.
1st supportt level is located at 179.95 and is considered significant as it represents a swing low support and aligns with the 23.60% Fibonacci retracement level. 2nd level is positioned at 178.85 and is recognized as a strong support level. It represents an overlap support and aligns with the 127.20% Fibonacci extension.
Moving on to the resistance levels, 1st resistance is found at 182.10 and is considered significant due to its status as an overlap resistance. 2nd resistance level is situated at 183.89 and is notable as it represents a multi-swing high resistance.

USD/CHF:
The USD/CHF pair is currently showcasing a bearish momentum, implying a potential bearish continuation towards the 1st support level.
The 1st support is located at 0.8779, which serves as an overlap support. Additionally, this support level is aligned with both a 61.80% and a 100% Fibonacci projection levels, thereby bolstering its significance in providing price stability.
In terms of resistance, the 1st resistance level is spotted at 0.8828 and is classified as an overlap resistance. This could potentially act as an obstacle to any upward price movement. Further, should the price breach this level, it could face the 2nd resistance located at 0.8868, another overlap resistance, potentially stalling further ascension.

USD/JPY:
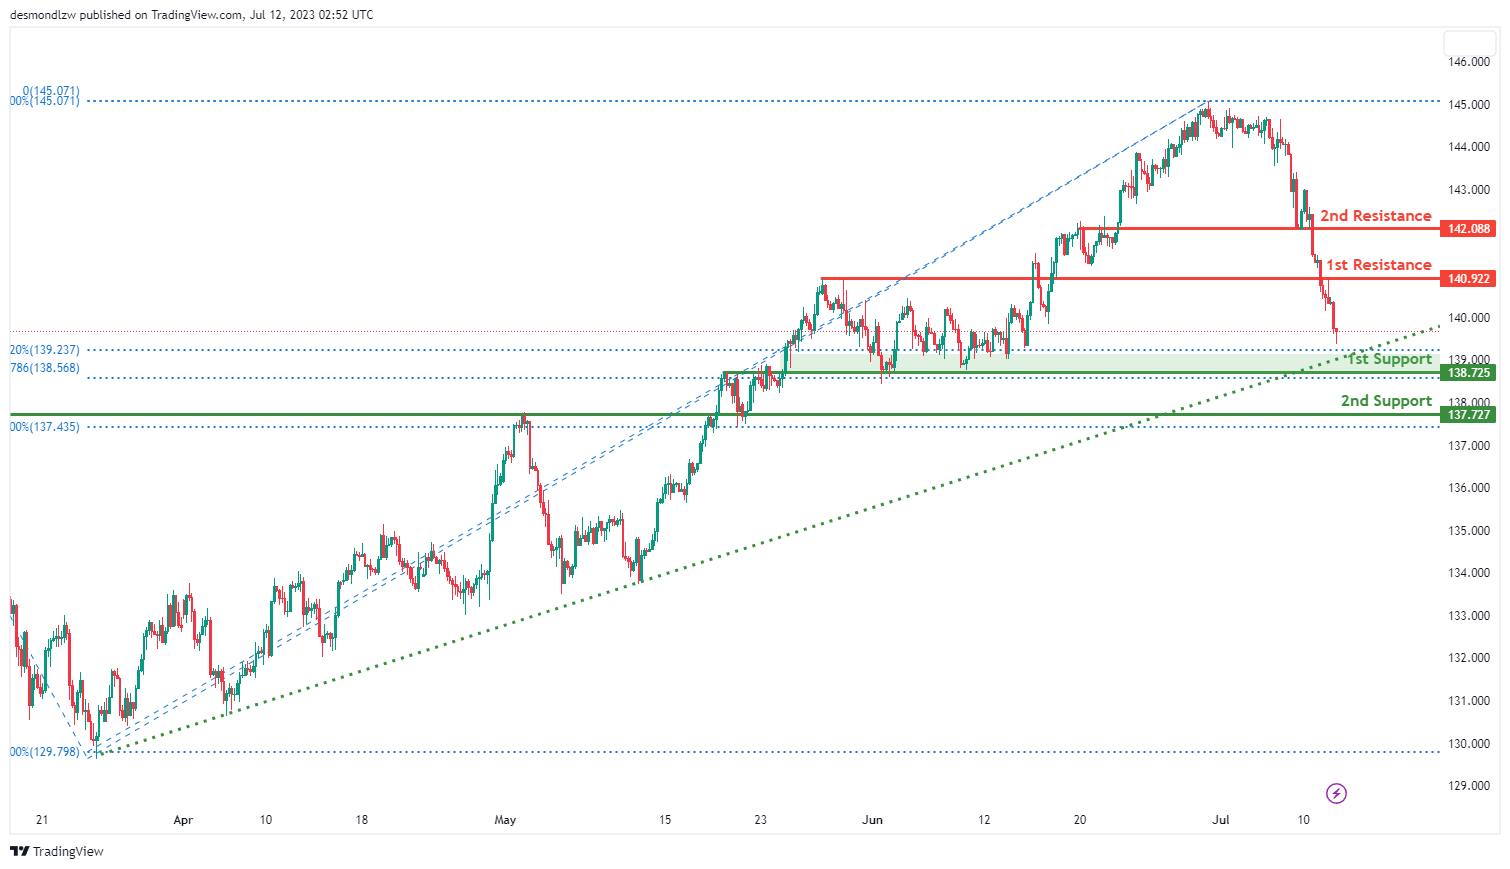
The USD/JPY chart is currently demonstrating a bearish momentum, indicating the potential for a bearish continuation towards the 1st support level.
The 1st support is situated at 138.73, functioning as an overlap support. This level also aligns with a 38.20% Fibonacci retracement and a 78.60% Fibonacci projection levels, thereby emphasizing its importance.
Furthermore, the 2nd support level at 137.73 acts as another overlap support and coincides with a 50% Fibonacci retracement level, bolstering its significance as a potential barrier to the bearish trajectory.
On the flip side, if the price starts to reverse its course, the 1st resistance at 140.92, classified as an overlap resistance, might provide a significant challenge to the bullish movement. Additionally, the 2nd resistance level at 142.09, another overlap resistance, could pose further resistance to upward price movements.
USD/CAD:
The USD/CAD currency pair is currently demonstrating a bearish momentum, suggesting a possible continuation of the downward trend in the near term. This is indicated by the potential for a bearish break off the 1st support level.
The 1st support level is placed at 1.3206, a point that has shown significant overlap support in the past. Its significance is further emphasized as it aligns with a 78.60% Fibonacci projection level. Should the bearish momentum persist, we might see the price breaking through this support and potentially heading towards the 2nd support level.
The 2nd support level is located at 1.3131, another critical price point identified by its characteristic as an overlap support. Furthermore, this level is also in line with a 145.00% Fibonacci extension level, further solidifying its position as a potential target in a continued bearish trend.
On the contrary, if the bearish momentum is halted and the price shifts in the opposite direction, we would expect the pair to encounter resistance levels. The 1st resistance level lies at 1.3271, a point that has provided overlap resistance in the past, potentially hindering an upward price movement.
Beyond that, the 2nd resistance level, identified at 1.3305, is classified as a pullback resistance. This indicates that should the price reach this point, there could be an increased likelihood of a slowdown in the bullish trend.

AUD/USD:
The AUD/USD currency pair is currently showcasing a bullish trend. This positive momentum is primarily attributed to the price breaking above a descending resistance line, which is potentially triggering a bullish move in the short term. The price could possibly continue its bullish trajectory towards the 1st resistance level.
The 1st support level is noted at 0.6708 and has been identified as an overlap support. Should the bullish momentum wane and the price experiences a decline, this level could serve as a reliable foundation.
The 2nd support is found at 0.6655, serving as a pullback support. This level could play a crucial role if a more substantial price correction were to occur, helping to potentially reverse the downward trend.
On the flip side, should the bullish momentum persist, the 1st resistance is expected at 0.6747. It’s marked as an overlap resistance and aligns with a 50% Fibonacci retracement, which may further solidify this resistance level.
Beyond the 1st resistance, if the price continues to climb, the 2nd resistance is located at 0.6806. This level is noted as a pullback resistance and could potentially pose a substantial barrier to continued upward price movements.

NZD/USD
The NZD/USD pair currently exhibits a bullish trend, supported by the fact that the price is situated above a significant ascending trend line. The price could potentially continue its bullish direction towards the 1st resistance level.
The 1st support is identified at 0.6219 and is considered as an overlap support, a level that provides a robust foundation for the price. If the price were to retrace from its current position, this level could act as a strong buffer.
Further beneath the 1st support, the 2nd support is located at 0.6165, and it also serves as an overlap support. This level could provide additional backing for the price in the event of a more significant downward correction.
On the contrary, if the bullish momentum is sustained, the price could meet the 1st resistance at 0.6249. This level is characterized as a swing high resistance and aligns with a 78.6% Fibonacci projection level.
If the price manages to breach the 1st resistance, it could then encounter the 2nd resistance placed at 0.6302. This level is noted as a multi-swing high resistance and corresponds to a 100% Fibonacci projection level.

DJ30:
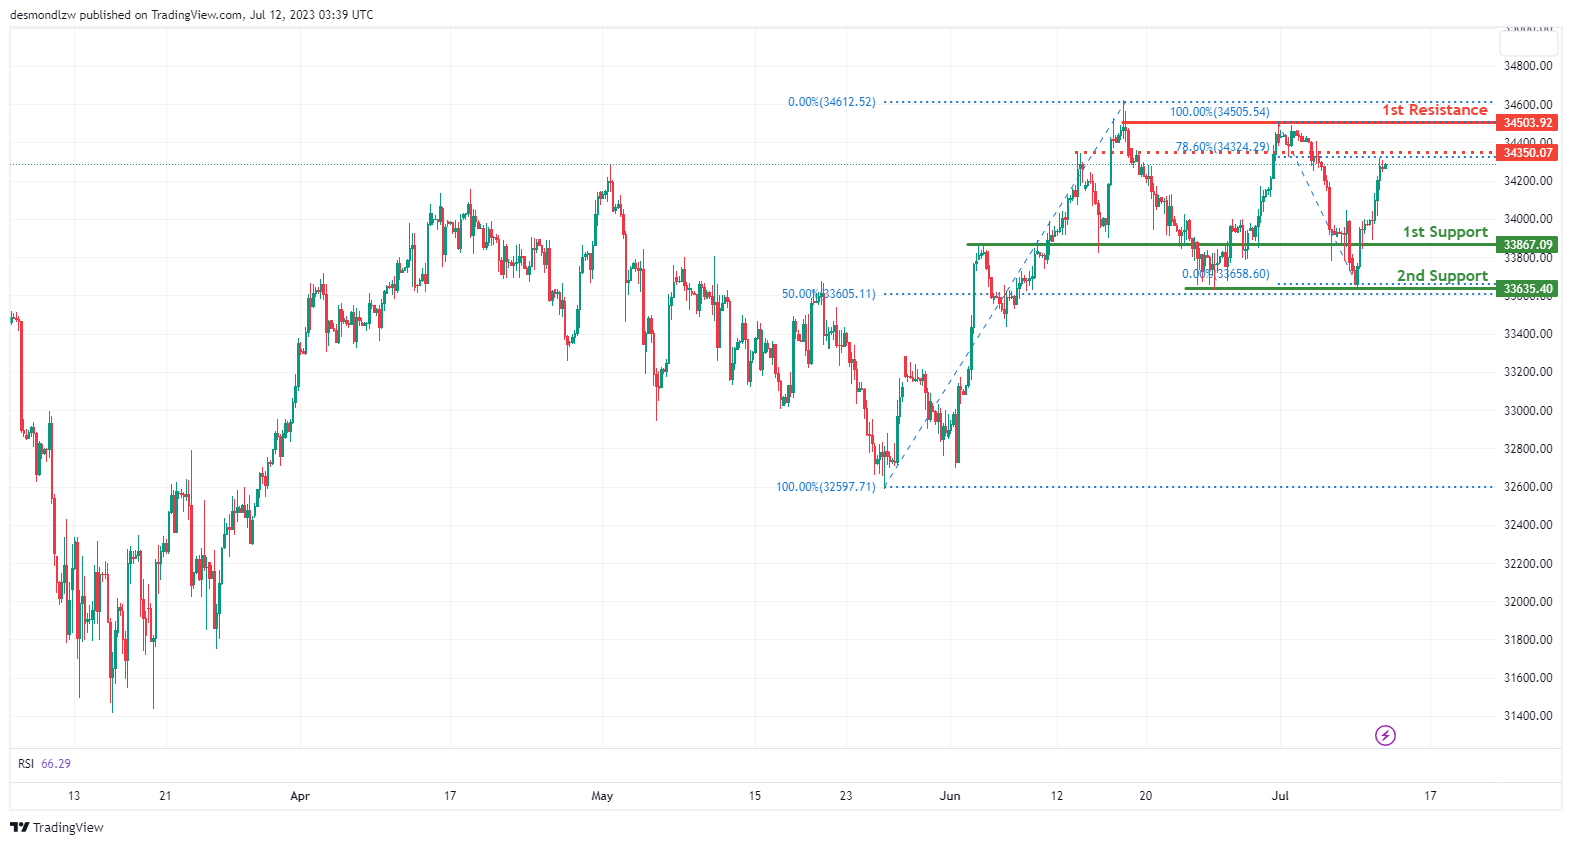
The DJ30 (Dow Jones Industrial Average) chart is currently exhibiting a bullish momentum. There is potential for the price to continue its upward movement towards the 1st resistance.
The 1st support level is at 33867.09 and is considered significant due to its overlap support. The 2nd support level is positioned at 33635.40 and is recognized as a strong support level as it represents a multi-swing low support and aligns with the 50% Fibonacci retracement level.
Moving on to the resistance levels, the 1st resistance is found at 34503.92 and is significant because it represents a multi-swing high resistance. Additionally, there is an intermediate resistance level at 34350.07. This level is considered notable due to its overlap resistance and correlation with the 78.60% Fibonacci retracement level.
GER30:
The GER30 (DAX) chart currently shows a bullish momentum. There is potential for the price to continue its upward movement towards the 1st resistance.
The 1st support level is located at 15702.38 and is considered significant due to its overlap support. The 2nd support level is positioned at 15483.16 and is recognized as a strong support level, representing a multi-swing low support.
Moving on to the resistance levels, the 1st resistance is found at 15926.65. This resistance level is significant as it represents an overlap resistance, a 61.80% Fibonacci retracement, and a 100% Fibonacci projection, indicating a Fibonacci confluence.
Additionally, the 2nd resistance level is situated at 16216.44 and is considered noteworthy due to its status as a swing high resistance.

US500
The US500 (S&P 500) chart currently exhibits a bullish momentum. There is potential for the price to continue its upward movement towards the 1st resistance.
The 1st support level is located at 4431.4 and is considered significant as it represents an overlap support. The 2nd support level is positioned at 4383.9 and is recognized as a strong support level, representing a multi-swing low support and aligning with the 61.80% Fibonacci retracement level.
Moving on to the resistance levels, the 1st resistance is found at 4455.7. This resistance level is significant as it represents a multi-swing high resistance, a 61.80% Fibonacci projection, and a 127.20% Fibonacci extension, indicating a Fibonacci confluence.
Additionally, the 2nd resistance level is situated at 4478.8 and is considered noteworthy as it represents a swing high resistance, along with a 78.60% Fibonacci projection and a 161.80% Fibonacci extension, indicating another Fibonacci confluence.

BTC/USD:
The BTC/USD instrument is currently showing a neutral overall momentum. It’s conceivable that the price might fluctuate between the 1st support and 1st resistance levels. The 1st support is positioned at 29826 and is viewed as strong due to its overlap support and a 23.60% Fibonacci Retracement.
The 2nd support, found at 28274, is also considered robust due to its overlap support and a 50% Fibonacci Retracement.
On the other hand, the 1st resistance is located at 31457 and is deemed significant owing to its multi-swing high resistance and a 61.80% Fibonacci Retracement. The 2nd resistance, at 32252, is notable for its swing high resistance nature, which could potentially pose a significant obstacle for any upward movement in price.

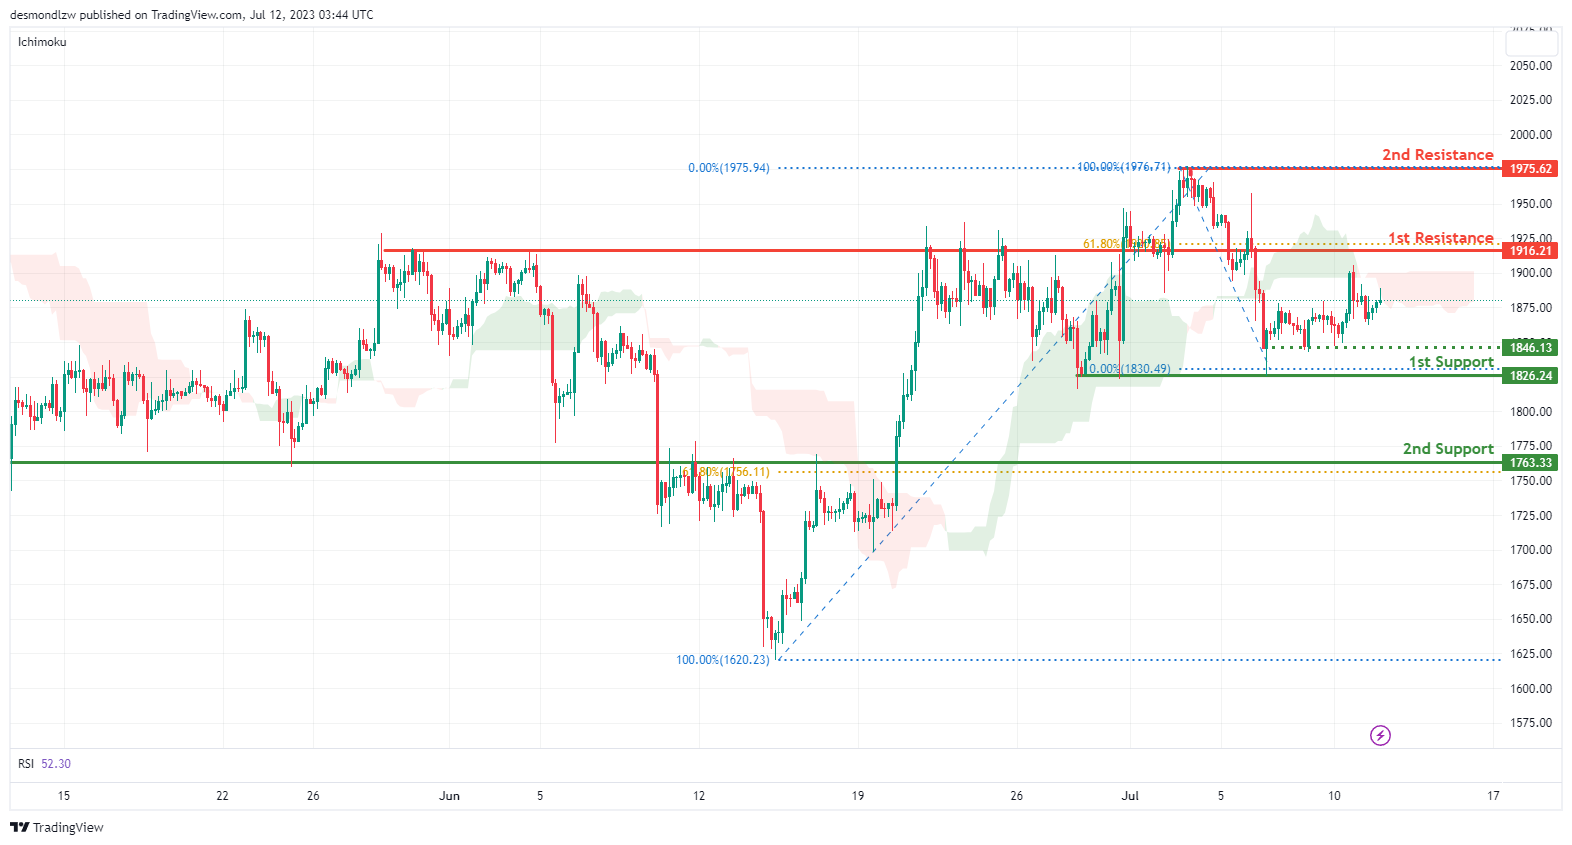
ETH/USD:
The ETH/USD instrument is currently on a bearish trend, largely attributed to the price trading below the bearish Ichimoku cloud.
As the trend proceeds, it’s probable that the price might continue on this bearish direction towards the 1st support, positioned at 1826.24. This support level is regarded as strong due to its character as a multi-swing low support.
Further on, the 2nd support stands at 1763.33 and is considered strong due to its overlap support and a 50% Fibonacci Retracement.
On the other hand, the 1st resistance is positioned at 1916.21 and is recognized as significant due to its overlap resistance and a 61.80% Fibonacci Retracement. The 2nd resistance, found at 1975.62, is also notable as it represents swing high resistance, and could potentially pose an obstacle to any upward price movements.
An intermediate support level is also noticeable at 1846.13, recognized as durable due to its status as a multi-swing low support.
WTI/USD:
The WTI/USD pair is currently showing a bullish momentum, suggesting the possibility of a continued upward movement towards the 1st resistance level.
The 1st support level is found at 74.25 and is characterized as an overlap support. If the price were to drop, this level could act as a strong buffer.
Should the price fall below the 1st support, the 2nd support located at 72.78 stands as another overlap support, offering an additional layer of support.
Conversely, if the bullish momentum continues, the price may encounter the 1st resistance at 76.65. This level acts as an overlap resistance and aligns with a 61.8% Fibonacci retracement level and a 161.8% Fibonacci extension level, indicating a potential barrier for upward price movements.
If the price manages to break through the 1st resistance, it could aim for the 2nd resistance at 78.93. This level also presents as an overlap resistance, marking another significant point of potential resistance.

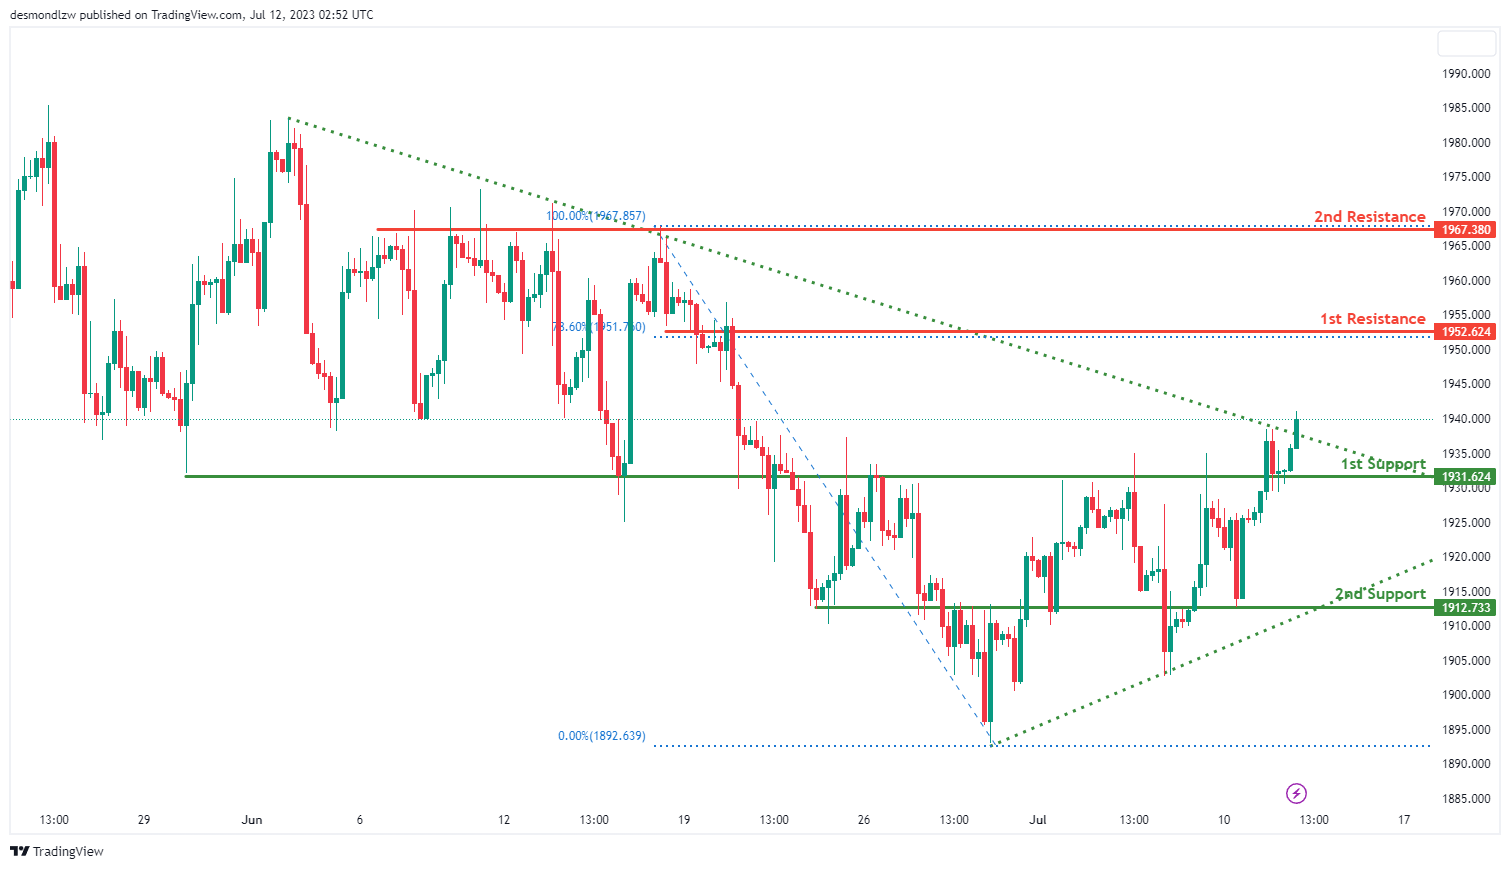
XAU/USD (GOLD):
The XAU/USD pair currently exhibits a bullish momentum, a development triggered by a break above a descending resistance line which suggests a possible bullish continuation.
On the downside, if the price retreats, it could find substantial support at the 1st level of 1931.62, which is characterized as an overlap support. Further down, a 2nd support level is found at 1912.73, also serving as an overlap support.
On the upside, the price could potentially continue its bullish movement towards the 1st resistance level at 1952.62. This resistance level, characterized as an overlap resistance, aligns with a 78.60% Fibonacci retracement, further strengthening its significance.
Should the price breach this level, it might aim for the 2nd resistance level at 1967.38, which is another overlap resistance and could serve as a significant barrier to further price ascents.
The accuracy, completeness and timeliness of the information contained on this site cannot be guaranteed. IC Markets does not warranty, guarantee or make any representations, or assume any liability regarding financial results based on the use of the information in the site.
News, views, opinions, recommendations and other information obtained from sources outside of www.icmarkets.com, used in this site are believed to be reliable, but we cannot guarantee their accuracy or completeness. All such information is subject to change at any time without notice. IC Markets assumes no responsibility for the content of any linked site.
The fact that such links may exist does not indicate approval or endorsement of any material contained on any linked site. IC Markets is not liable for any harm caused by the transmission, through accessing the services or information on this site, of a computer virus, or other computer code or programming device that might be used to access, delete, damage, disable, disrupt or otherwise impede in any manner, the operation of the site or of any user’s software, hardware, data or property.


