
Key risk events today:
Limited.
(Previous analysis as well as outside sources – italics).
EUR/USD:
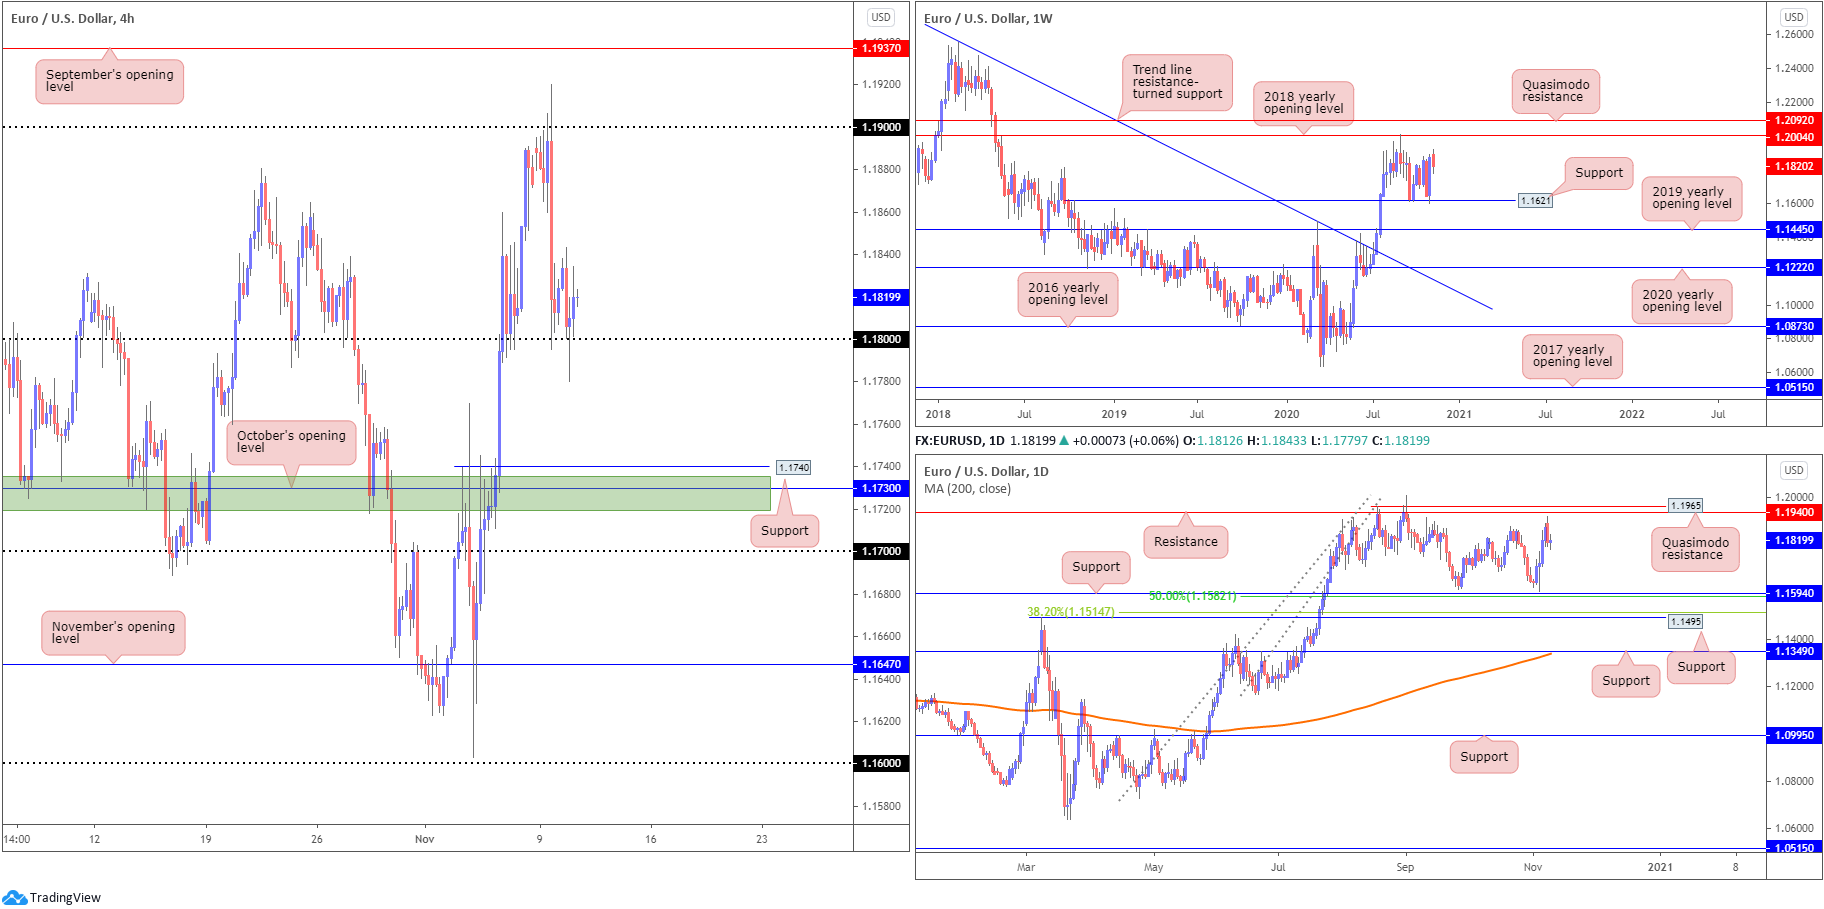
Europe’s single currency tentatively held 1.18 against the buck on Tuesday, generating a 20-pip whipsaw beneath the round number a couple of hours ahead of the US session.
Yesterday’s spike to 1.1780 has likely squeezed out a number of buyers off 1.18 and also filled breakout sellers, causing pain on both sides of the market. A H4 close beneath 1.18 today proposes moves to support at 1.1740 (a previous Quasimodo resistance), as well as a support zone (green) around 1.1719-1.1735 and October’s opening value at 1.1730.
Meanwhile, on the weekly timeframe, last week’s 2% advance has so far failed to attract fresh buyers, despite technical structure indicating room to advance towards the 2018 yearly opening value at 1.2004, closely shadowed by Quasimodo resistance priced at 1.2092. Trend traders may also acknowledge July’s trend line resistance break, taken from the high 1.2555, on top of the break of the 1.1495 March 9 swing high.
A closer reading of price action on the daily timeframe reveals the unit snapped a four-day bullish phase on Monday, ahead of resistance at 1.1940 and Quasimodo resistance at 1.1965, with Tuesday offering little more than an indecision candle. Support at 1.1594, and nearby 50.0% retracement ratio at 1.1582, reside as the next downside targets should further selling take shape.
Areas of consideration:
- Buyers holding off 1.18 today on the H4, in light of weekly price demonstrating room to move higher, could see price head for 1.19, followed by September’s opening value at 1.1937.
- A 1.18 breach on the H4 scale potentially triggers intraday bearish scenarios, targeting the 1.1730ish zone.
- October’s opening value at 1.1730 and connecting H4 areas form a support to be aware of, though do take into account no higher timeframe support exists here.
- The connection between September’s opening value 1.1937 on the H4 and daily resistance at 1.1940 assembles interesting confluence.
GBP/USD:
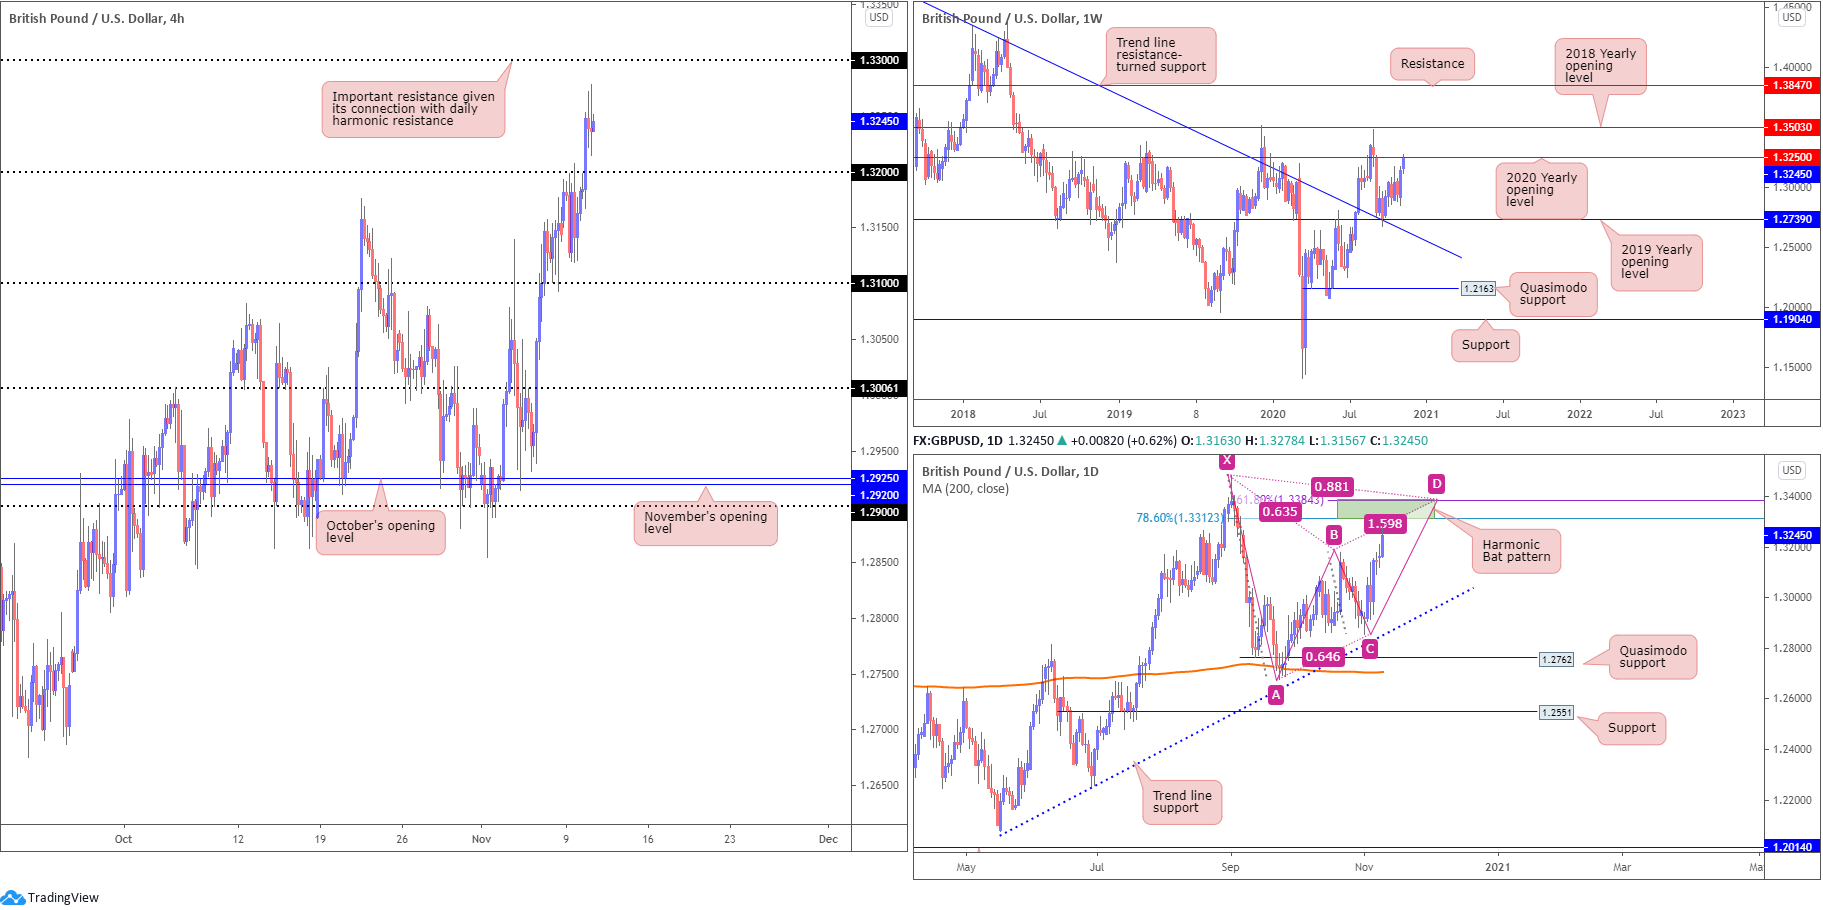
Cable rallied more than 0.6% on Tuesday, squeezing orders from the 1.32 handle on the H4 and reaching peaks around 1.3278. This also shines the spotlight on the 1.33 handle as the next possible resistance.
Interestingly, also circling the 1.33 handle is a daily bearish harmonic Bat pattern with a potential reversal zone (PRZ) stationed at 1.3384/1.3312. This may, assuming the harmonic configuration lures price higher, develop a fakeout above current resistance on the weekly timeframe: the 2020 yearly opening value at 1.3250.
Areas of consideration:
- A retest at 1.32 on the H4, given the upward momentum so far this week, could fuel buying, though this, of course, would be at odds with weekly resistance at 1.3250 (2020 yearly opening value).
- The 1.33 handle is interesting resistance, having noted the lower edge of a daily bearish harmonic Bat pattern positioned at 1.3312.
AUD/USD:
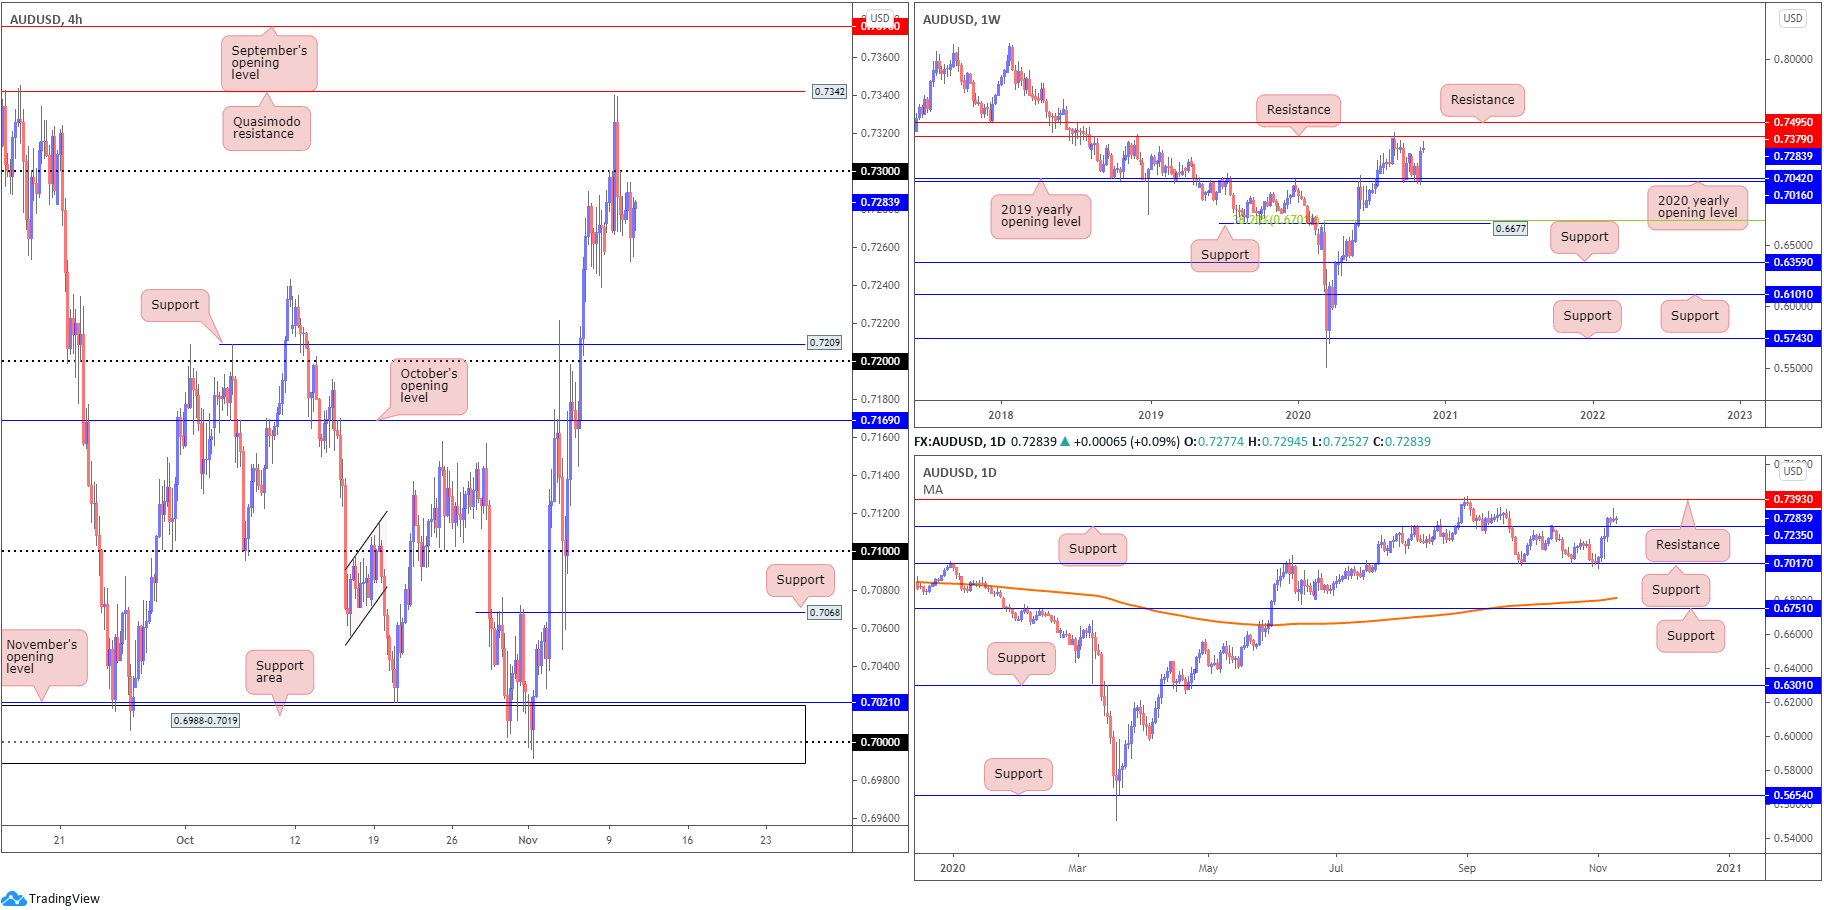
Risk sentiment diminished somewhat on Tuesday, leaving the risk sensitive Australian dollar side-lined against the US dollar south of 0.73.
AUD/USD aggressively spiked above 0.73 to test levels just south of Quasimodo resistance at 0.7342 on Monday, with chart studies indicating support at 0.7209 and the 0.72 handle could make their way into the spotlight should a bearish theme emerge.
From the weekly timeframe, price structure remains unchanged (italics):
Last week’s risk rally, together with the 2020 (0.7016) and 2019 (0.7042) yearly opening values (supports), underpinned the Australian dollar’s near-250-pip advance against the US dollar, consequently producing a sizeable bullish engulfing candle. The positive close, in addition to this market trending higher since early 2020, might motivate additional bullish flow towards resistance priced in at 0.7379.
From the daily timeframe, nevertheless, Monday formed what many candlestick analysts would label a shooting star pattern (bearish signal), yet little follow-through movement developed. This, however, does keep the spotlight fixed on support at 0.7235, while a revival of bids could attack resistance at 0.7393.
Areas of consideration:
Outlook unchanged.
- Sellers still have their work cut out for them under 0.73 on the H4, despite the daily bearish candlestick formation. Not only do both weekly and daily charts reveal room to move above 0.73 to at least 0.7379 (weekly resistance), a downside move on the H4 could be halted as soon as 0.7235 support on the daily timeframe.
- A retreat to 0.72, however, could trigger dip-buyers, while a decisive H4 close above 0.73 may tempt breakout buying moves, targeting Quasimodo resistance at 0.7342, followed by September’s opening value at 0.7376 (and weekly resistance at 0.7379).
USD/JPY:
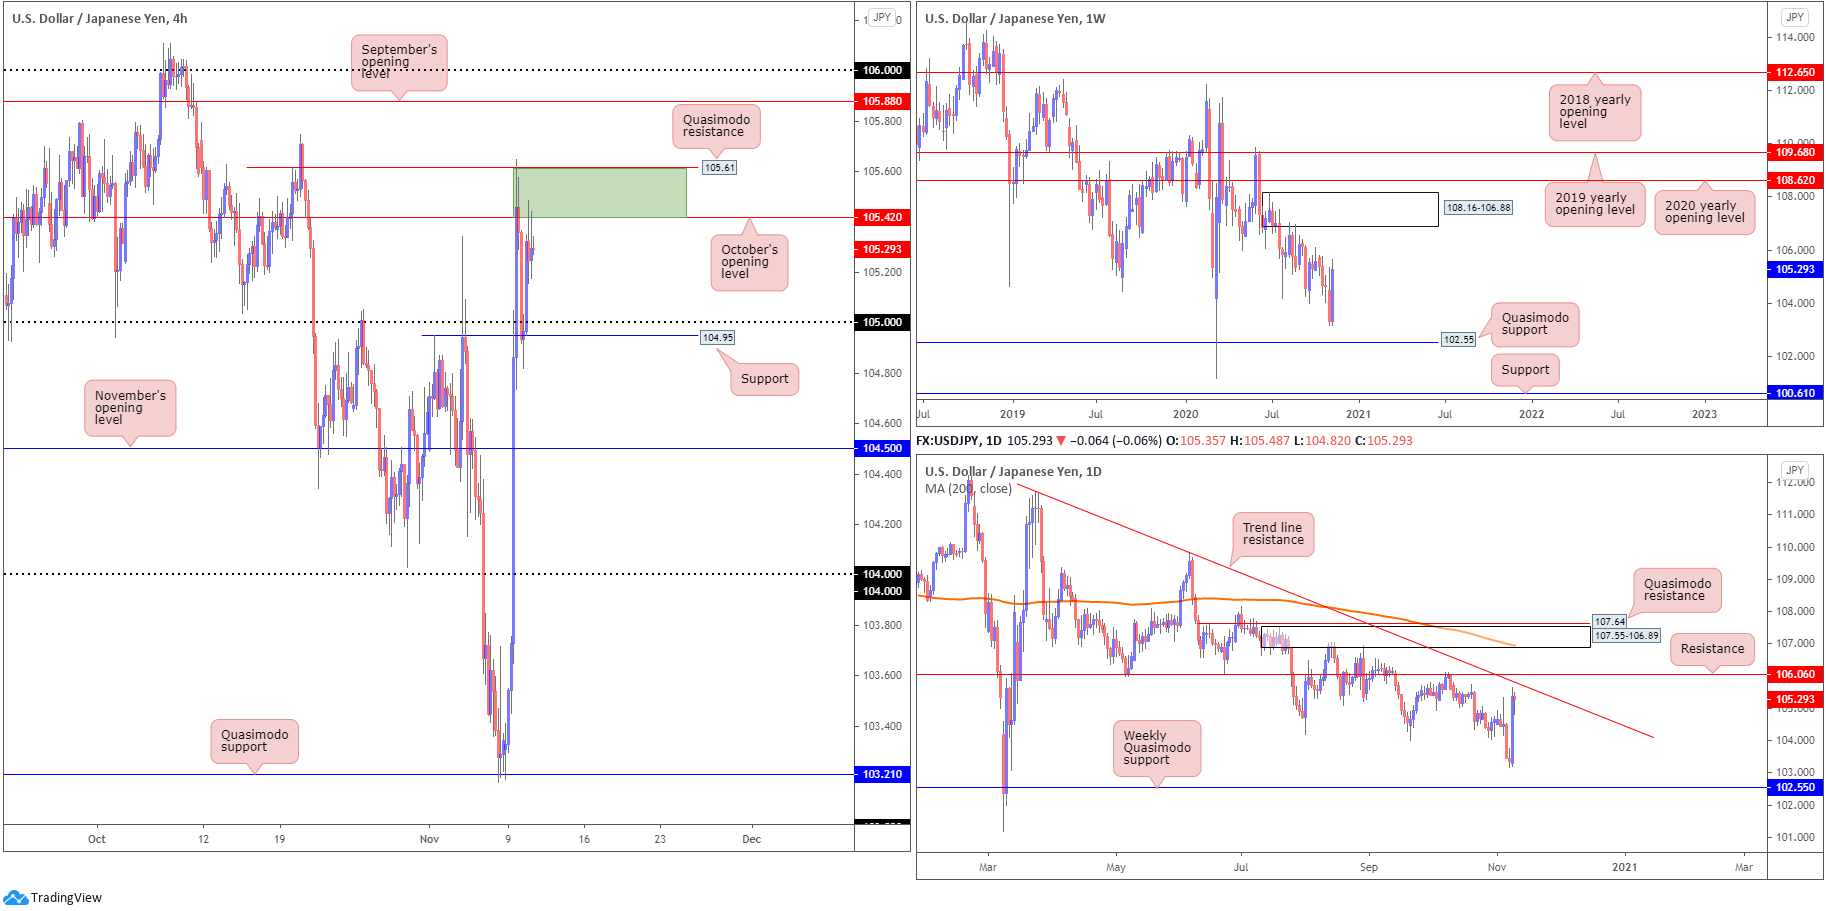
The US dollar finished significantly off session lows against the Japanese yen Tuesday, following Monday’s 2% advance.
Early hours Tuesday observed USD/JPY bulls make an appearance off H4 support at 104.95 (a prior Quasimodo resistance level) and the 105 handle, both of which were noted support levels to be mindful of. The rebound from the base, as you can see, had price confront October’s opening value at 105.42, a level closely shadowed by a Quasimodo resistance at 105.61.
Longer-term action, in view of Tuesday hovering around Monday’s session highs, remains unchanged heading into Wednesday (italics):
The weekly timeframe has supply at 108.16-106.88 on its radar to the upside, with Quasimodo support priced in at 102.55 to the south of price. Price action on the daily timeframe, on the other hand, faces neighbouring trend line resistance, extended from the high 111.71, followed by resistance at 106.06.
Areas of consideration:
- H4 Quasimodo resistance at 105.61 and October’s opening value at 105.42 is an area (green) sellers may still be watching (even more so thanks to Tuesday’s moderate response from the zone), though do be aware there is limited higher timeframe convergence present, according to our chart studies. Should sellers make a move, however, 105 is a support to be mindful of.
- A push higher could have the 106 handle and September’s opening value at 105.88 enter the fray on the H4, a range that merges with daily trend line resistance and resistance from 106.06.
USD/CAD:
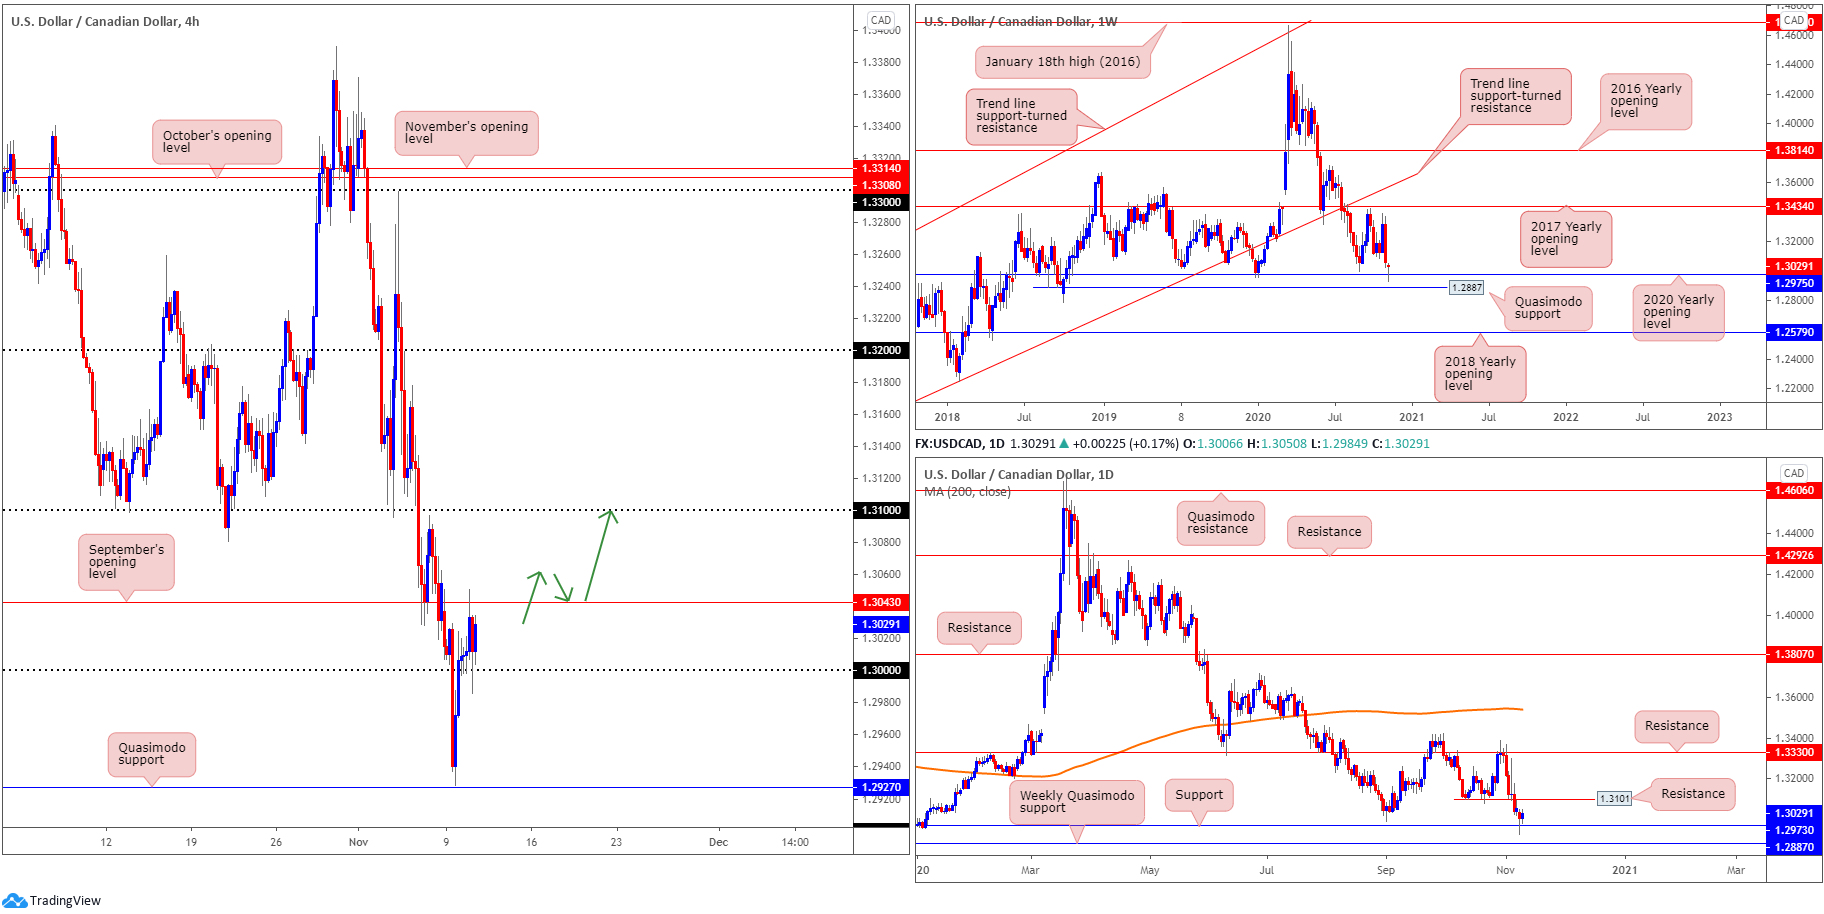
USD/CAD enters Wednesday mostly unchanged, balancing off the key figure 1.30 on the H4 though at the same also hindered by September’s opening value at 1.3043. Below 1.30, familiar Quasimodo support resides around 1.2927, ahead of the 1.29 handle, while bulls pulling price above 1.3043 could send H4 candles back to the 1.31 neighbourhood.
From the weekly timeframe, price, currently in the shape of a hammer candlestick pattern, recently crossed swords with the 2020 yearly opening value at 1.2975, a level shadowed by a Quasimodo support priced in at 1.2887. A decisive rejection from the latter could eventually see the 2017 yearly opening value at 1.3434 enter the fray. However, given this market has traded lower since topping at 1.4667 in early 2020, breaking the aforementioned supports swings the pendulum in favour of further weakness towards the 2018 yearly opening value at 1.2579.
The daily timeframe, also in the form of a hammer candle pattern, has price action communicating with support at 1.2973 (secured just north of weekly Quasimodo support at 1.2887). Resistance can be found at 1.3101 on the daily scale, a previous Quasimodo support level.
Areas of consideration:
- Aided by higher timeframe supports, a H4 close above September’s opening value at 1.3043 today may encourage a bullish theme, confirming bullish intent off the round number 1.30 to target the 1.31 handle and also daily resistance plotted at 1.3101. Conservative traders, nonetheless, may seek a 1.3043 retest before pulling the trigger (green arrows).
USD/CHF:
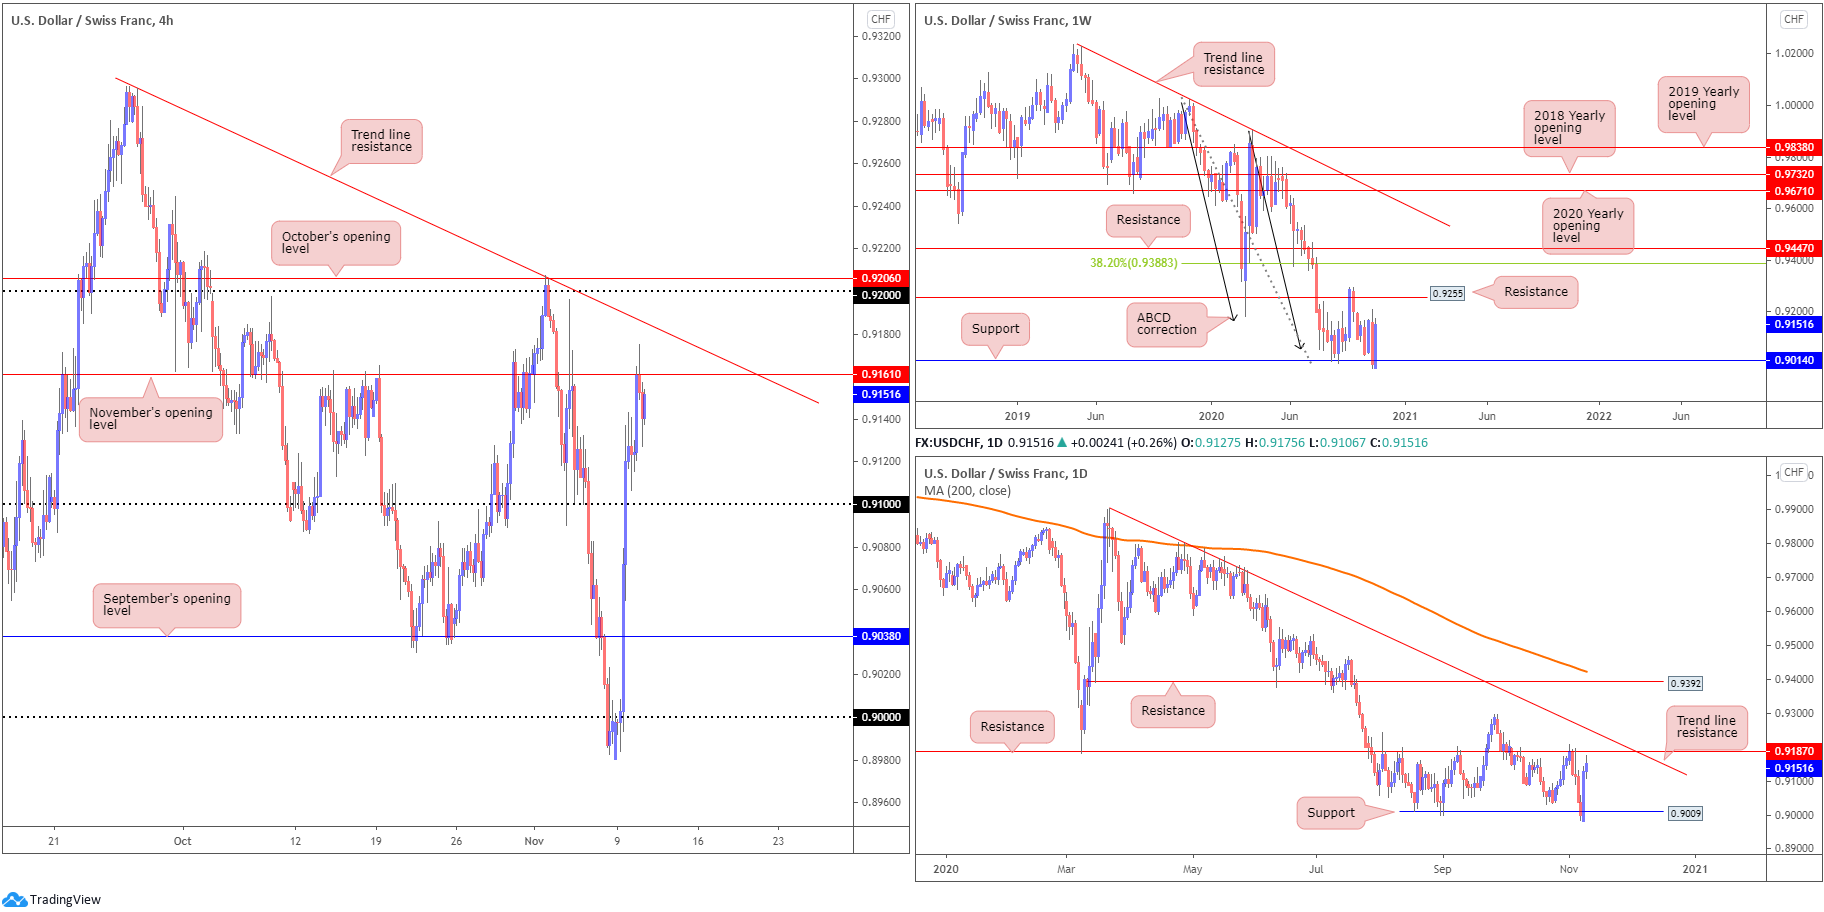
The US dollar edged a shade higher against the Swiss franc on Tuesday, extending Monday’s healthy recovery and scoring peaks at 0.9175. H4 candles, as evident from the chart, stabbed November’s opening value at 0.9161, with the session peak (enough to perhaps clear buy-stop liquidity) missing trend line resistance, extended from the high 0.9295, by a few pips before retreating to lower ground. North of the aforementioned trend line resistance, the 0.92 handle is present, sheltered just under October’s opening value at 0.9206.
Further out on the weekly timeframe, traders will acknowledge we’re heavily bid off support at 0.9014, a level dovetailing closely with ABCD support at 0.9051 (black arrows). 0.9255 resistance (a prior Quasimodo support) is next in the firing range should buyers continue to support this market.
Quasimodo support on the daily timeframe at 0.9009, despite a noticeable breach, welcomed buyers on Monday with Tuesday extending gains to within touching distance of resistance at 0.9187. Beyond here, traders will likely recognise nearby trend line resistance, taken from the high 0.9901.
Areas of consideration:
- As aired in Tuesday’s technical briefing, buyers in this market are likely to target 0.9206/0.9187 (October’s opening value/daily resistance); sellers may also welcome this zone should it make an entrance.
- Prior to reaching 0.9206/0.9187, retreating to 0.91 is also a possible scenario, one that may wave in a bullish scene.
Dow Jones Industrial Average:
The risk tone exhibited more of a mixed stance on Tuesday following the historic moves witnessed Monday. The Dow Jones Industrial Average added 262.95 points, or 0.90%, the S&P 500 traded lower by 4.97 points, or 0.14%, while the Nasdaq ended lower by 159.93 points, or 1.37%.
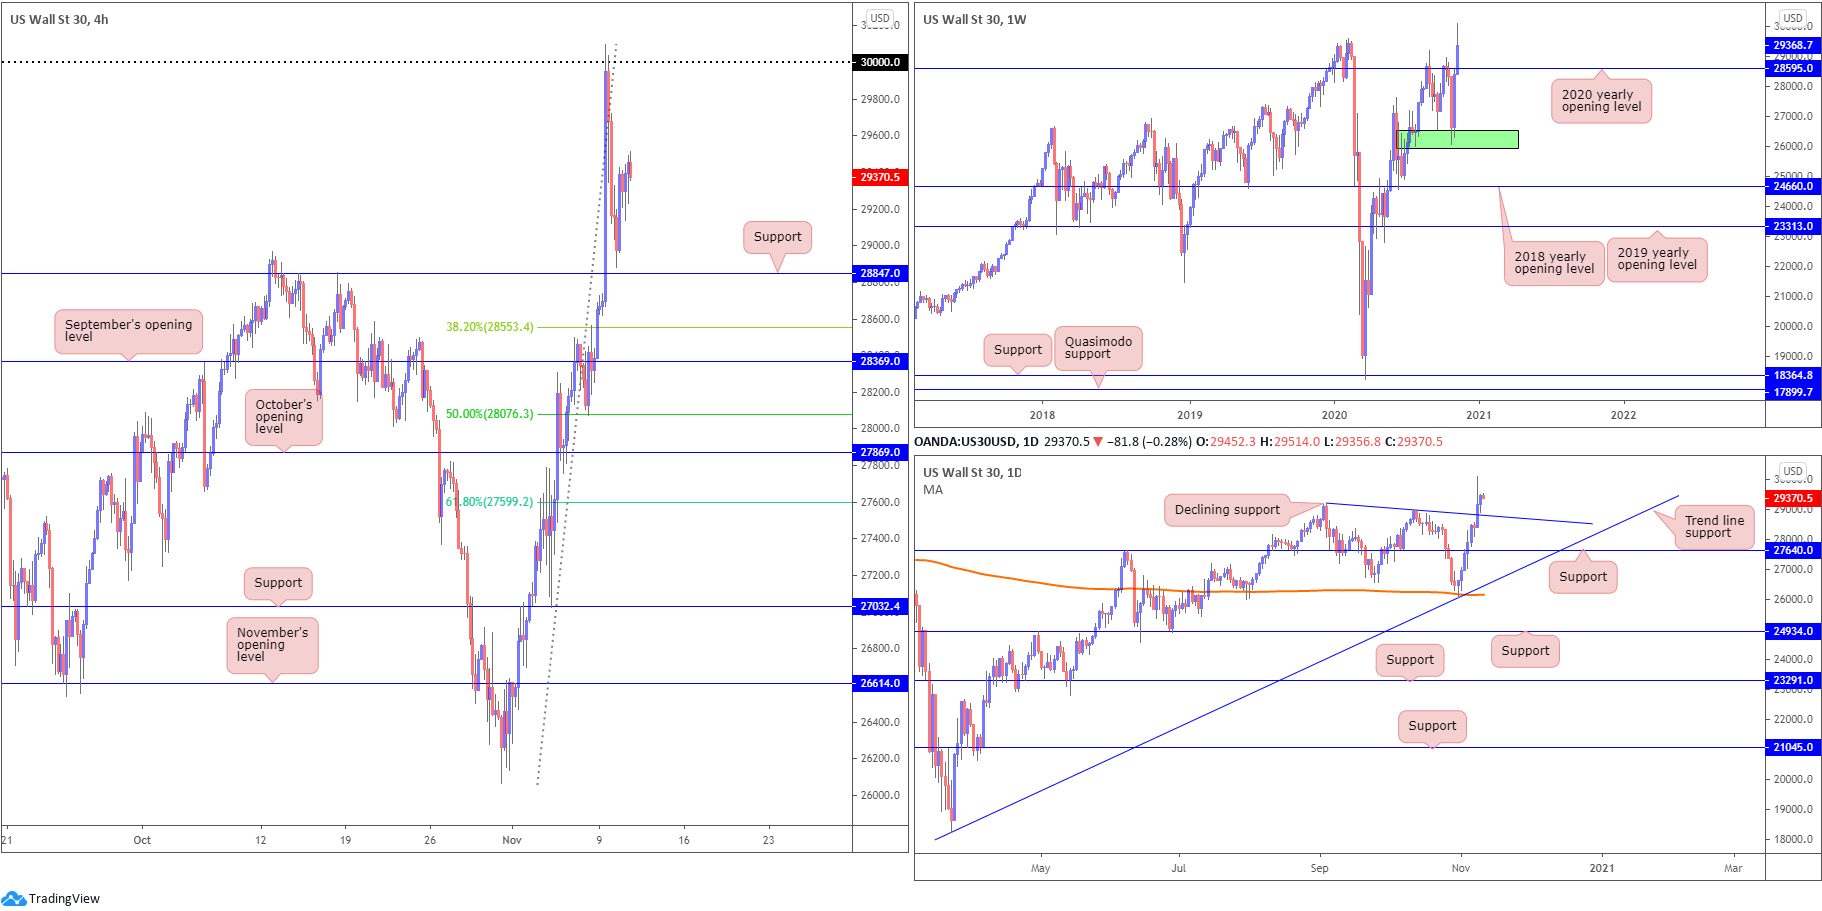
On the technical front, H4 recently bottomed just north of support at 28847, yet buyers appear to be struggling around 29426. Further upside from here, nevertheless, throws 30000 back into the fold, while dipping under 28847 moves light towards the 38.2% Fibonacci retracement ratio at 28553, followed by September’s opening value at 28369.
From the weekly timeframe, price hovers north of the 2020 yearly opening value at 28595, slightly off fresh all-time peaks at 30097. This follows last week’s 6.7% advance from demand at 25916-26523 (green). Price action on the daily timeframe has declining support in view, taken from the high 29193. Should a break of here come to pass, support at 27640 is seen.
Areas of consideration:
- Forming fresh all-time highs, as highlighted in recent analysis, will likely excite buyers.
- As a result, dip-buying opportunities remain on the table from H4 support at 28847 today should we test this level. Failure to hold, buyers’ crosshairs may switch to the 38.2% H4 Fibonacci retracement ratio seen at 28553 and September’s opening value at 28369.
XAU/USD (GOLD):
The price of gold marginally recovered against the US dollar on Tuesday, in attempt to reclaim a portion of Monday’s steep losses.
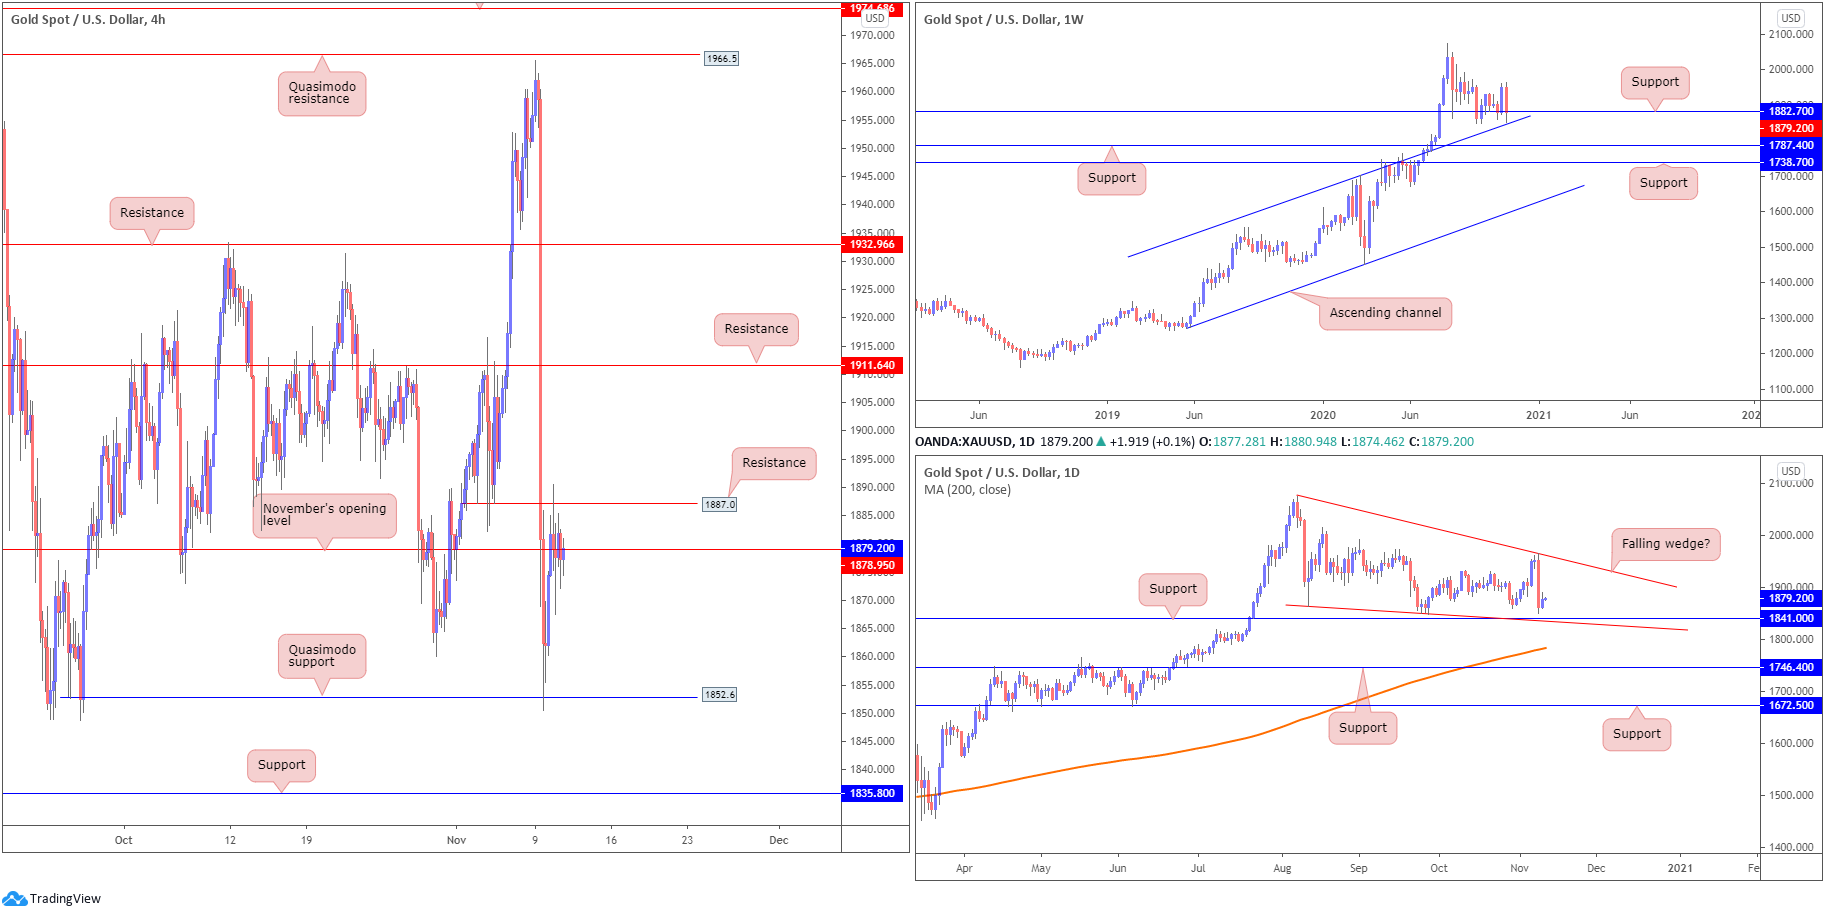
Holding off Monday’s session lows at $1,850 (and H4 Quasimodo support at $1,852), H4 shook hands with November’s opening value at $1,878 and entered into a phase of indecision, also reacting from resistance at $1,887 (a previous Quasimodo support level). Breaking beyond $1,887 today may see buyers work their way towards resistance at $1,911.
Higher up on the curve, weekly price recently dipped a toe under support at $1,882, coming within striking distance of channel resistance-turned support, taken from the high $1,703. What’s interesting from a technical perspective is daily support drawn from $1,841 converges with the weekly channel support. Another feature worth highlighting on the daily chart is a possible falling wedge pattern between $2,075/$1,862.
Areas of consideration:
Outlook unchanged.
- While the possibility of an extended recovery from H4 Quasimodo support at $1,852 is there, most traders may wait and see if we print a H4 close above November’s opening value at $1,878/H4 Quasimodo resistance at $1,887 before taking action.
- Should H4 support at $1,835 nudge its way into the limelight, the pendulum swings in favour of buyers here in terms of technical confluence: daily support at $1,841 and weekly channel support.
The accuracy, completeness and timeliness of the information contained on this site cannot be guaranteed. IC Markets does not warranty, guarantee or make any representations, or assume any liability regarding financial results based on the use of the information in the site.
News, views, opinions, recommendations and other information obtained from sources outside of www.icmarkets.com.au, used in this site are believed to be reliable, but we cannot guarantee their accuracy or completeness. All such information is subject to change at any time without notice. IC Markets assumes no responsibility for the content of any linked site.
The fact that such links may exist does not indicate approval or endorsement of any material contained on any linked site. IC Markets is not liable for any harm caused by the transmission, through accessing the services or information on this site, of a computer virus, or other computer code or programming device that might be used to access, delete, damage, disable, disrupt or otherwise impede in any manner, the operation of the site or of any user’s software, hardware, data or property


