
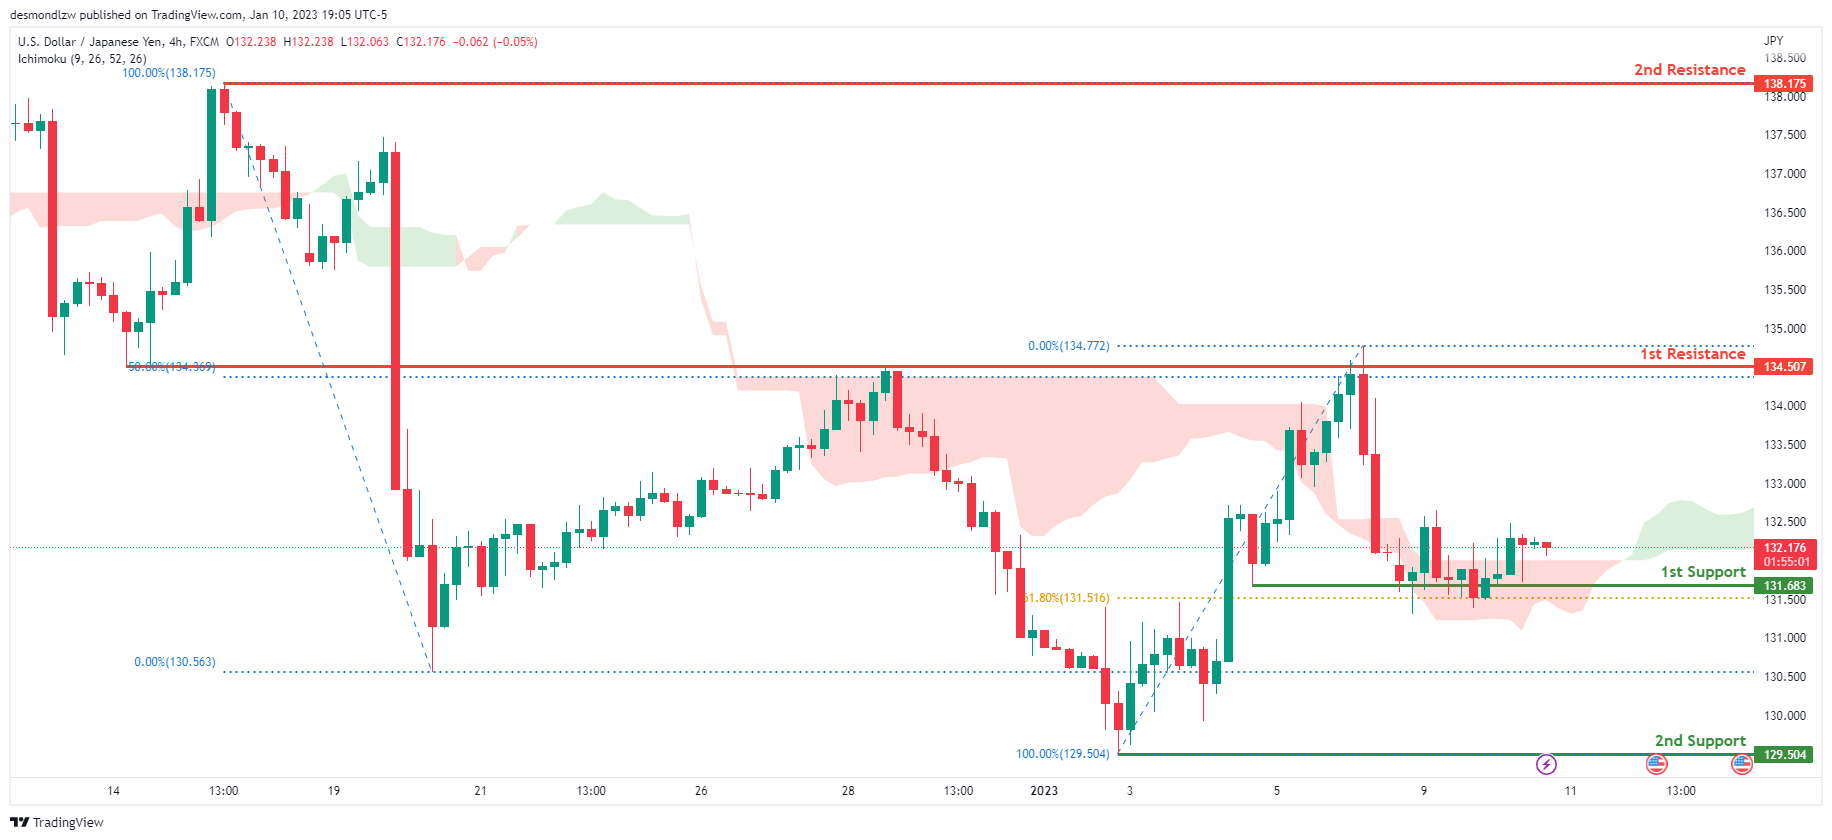
USD/JPY:
Looking at the H4 chart, my overall bias for USDJPY is bullish due to the current price being above the Ichimoku cloud, indicating a bullish market. If this bullish momentum continues, expect the price to possibly head back up towards the 1st resistance level at 134.507, where the 50% Fibonacci line is. In an alternate scenario, price could possibly break the 1st support at 131.683, where the 61.8% Fibonacci line is, before heading towards the 2nd support at 129.504, where the previous swing low is.
Areas of consideration:
- H4 time frame, 1st resistance at 134.507
- H4 time frame, 1st support at 131.683
- H4 time frame, 2nd support at 129.504
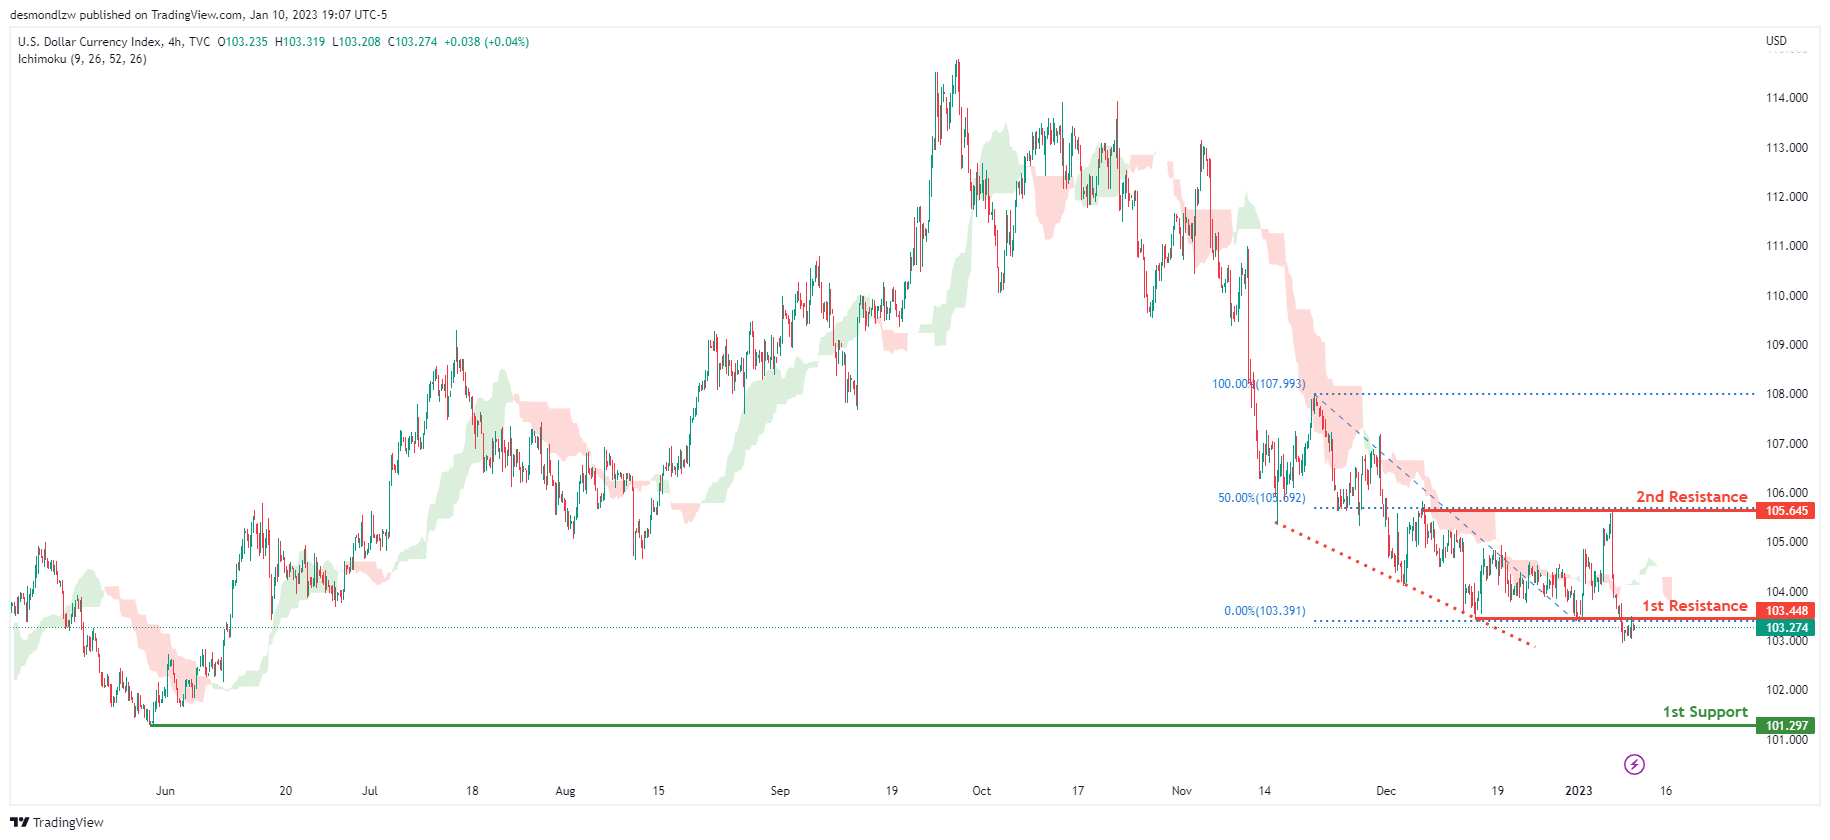
DXY:
Looking at the H4 chart, my overall bias for DXY is bearish due to the current price being below the Ichimoku cloud, indicating a bearish market. To add confluence to this, price is along a descending trend line which indicates a bearish market. If this bearish momentum continues, expect the price to possibly continue heading towards the 1st support at 101.297, where the previous lows and liquidity hotspots are. In an alternative scenario, price could head back up to retest the 1st resistance at 103.448, where the previous low is.
Areas of consideration:
- H4 time frame, 1st resistance at 103.448
- H4 time frame, 1st support at 101.297
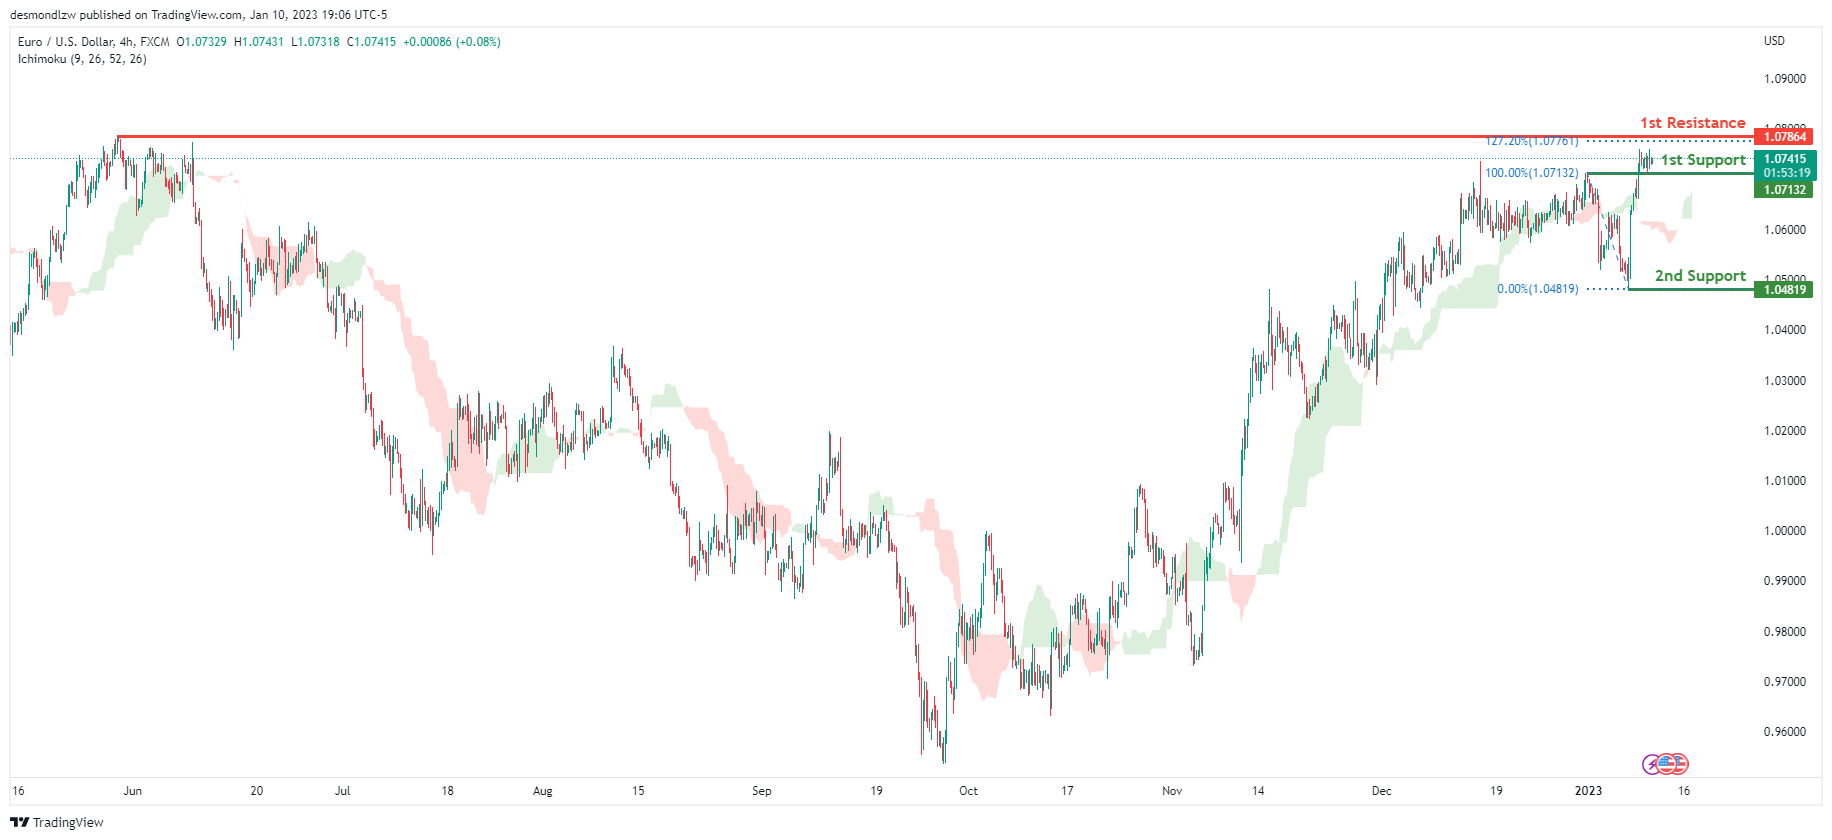
EUR/USD:
Looking at the H4 chart, my overall bias for EURUSD is bullish due to the current price being above the Ichimoku cloud, indicating a bullish market structure. If this bullish momentum continues, expect the price to possibly continue heading towards the 1st resistance at 1.07864, where the previous swing high is. In an alternate scenario, price could possibly head back down to retest the 1st support level at 1.07132, where the previous swing high is.
Areas of consideration :
- H4 1st resistance at 1.07864
- H4 1st support at 1.07132
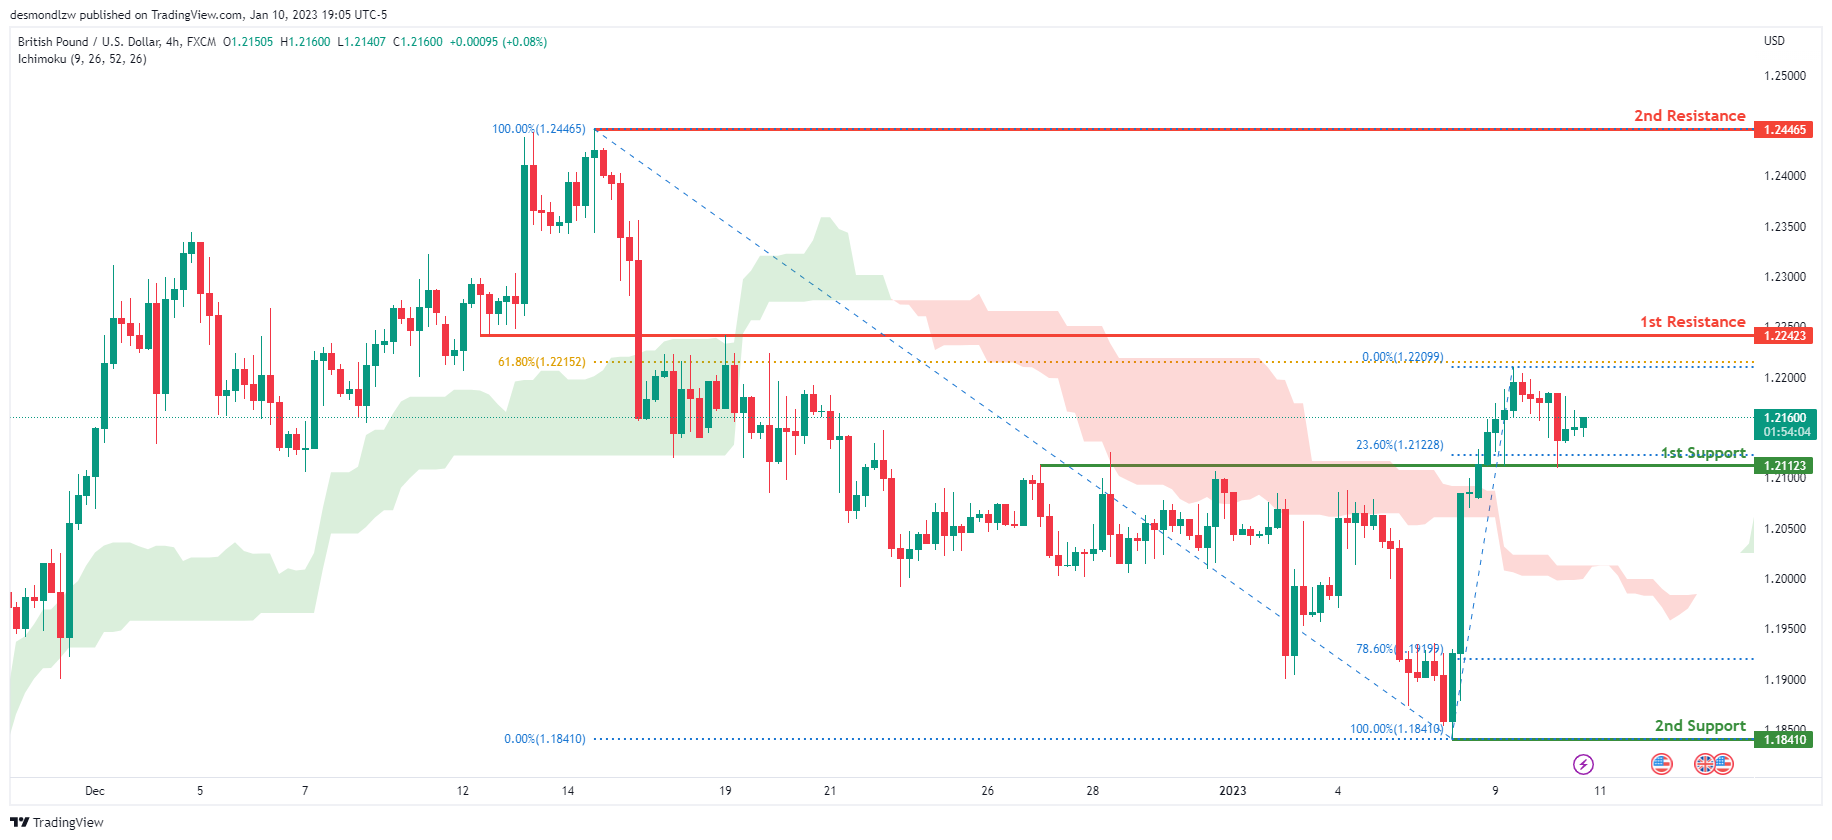
GBP/USD:
Looking at the H4 chart, my overall bias for GBPUSD is bullish due to the current price being above the Ichimoku cloud, indicating a bullish market. If this bullish momentum continues, expect price to possibly continue heading towards the 1st resistance line at 1.22423, slightly above where the 61.8% Fibonacci line is. In an alternate scenario, price could possibly head back down towards the 1st support at 1.21123, where the 23.6% Fibonacci line is
Areas of consideration:
- H4 1st resistance at 1.22423
- H4 1st support at 1.21068
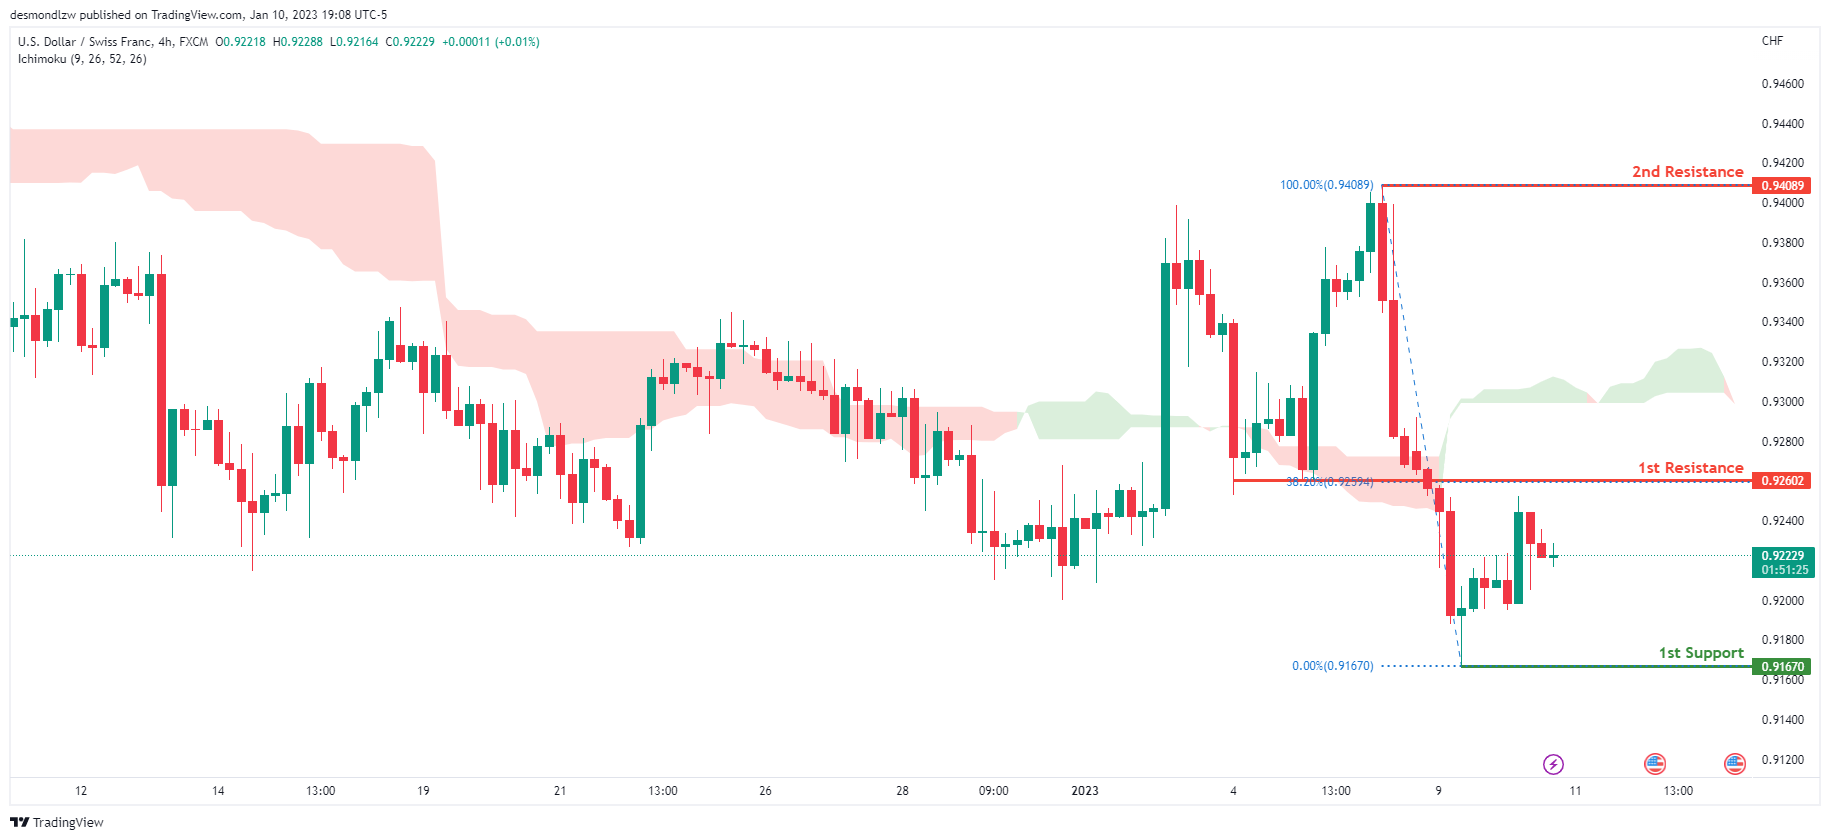
USD/CHF:
Looking at the H4 chart, my overall bias for USDCHF is bearish due to the current price being below the Ichimoku cloud, indicating a bearish market. If the current bearish trend continues, expect the price to head towards the 1st support at 0.91670, where the recent low is. In an alternative scenario, price could possibly head back up to retest the 1st resistance at 0.92602, where the 38.2% Fibonacci line is.
Areas of consideration
- H4 1st support at 0.91670
- H4 1st resistance at 0.92602
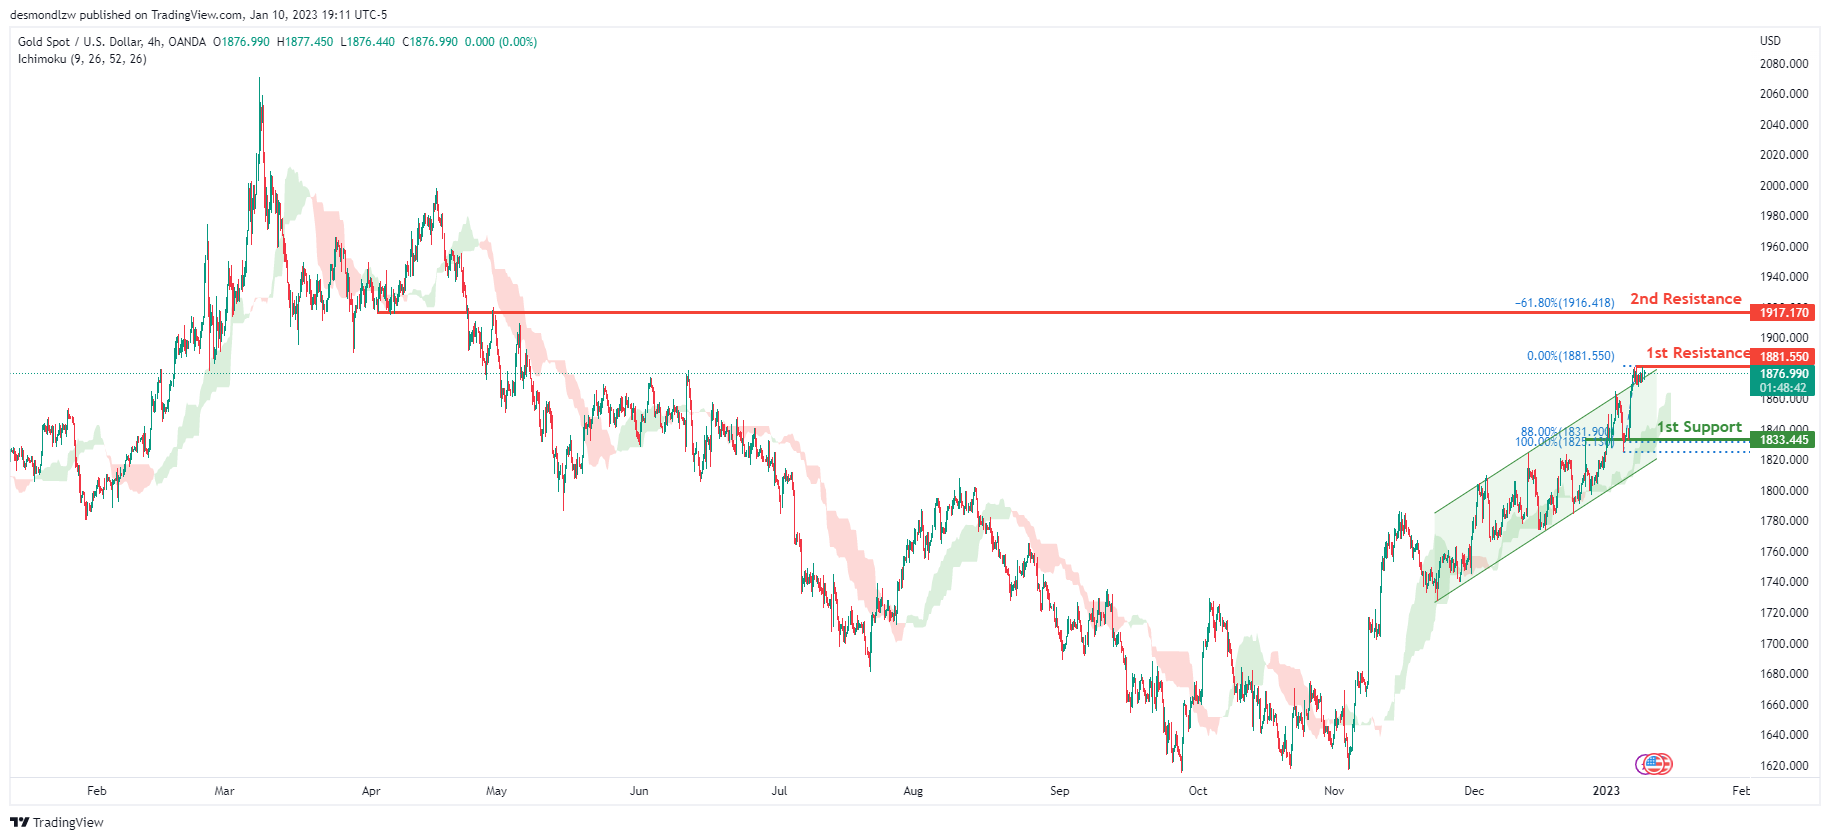
XAU/USD (GOLD):
Looking at the H4 chart, my overall bias for XAUUSD is bullish due to the current price crossing above the Ichimoku cloud, indicating a bullish market. To add support to this bias, price has also broken above the bullish ascending channel. If this bullish momentum continues, expect the price to possibly break the 1st resistance at 1881.550 where the recent high is, before heading towards the 2nd resistance at 1917.170, where the -61.8% Fibonacci expansion line is. In an alternative scenario, price could possibly head back down towards the 1st support at 1833.445, where the 88% Fibonacci line is.
Areas of consideration:
- H4 time frame, 1st resistance at 1881.550
- H4 time frame, 2nd resistance at 1917.170
- H4 time frame, 1st support at 1833.445
- H4 time frame, 2nd support at 1833.445
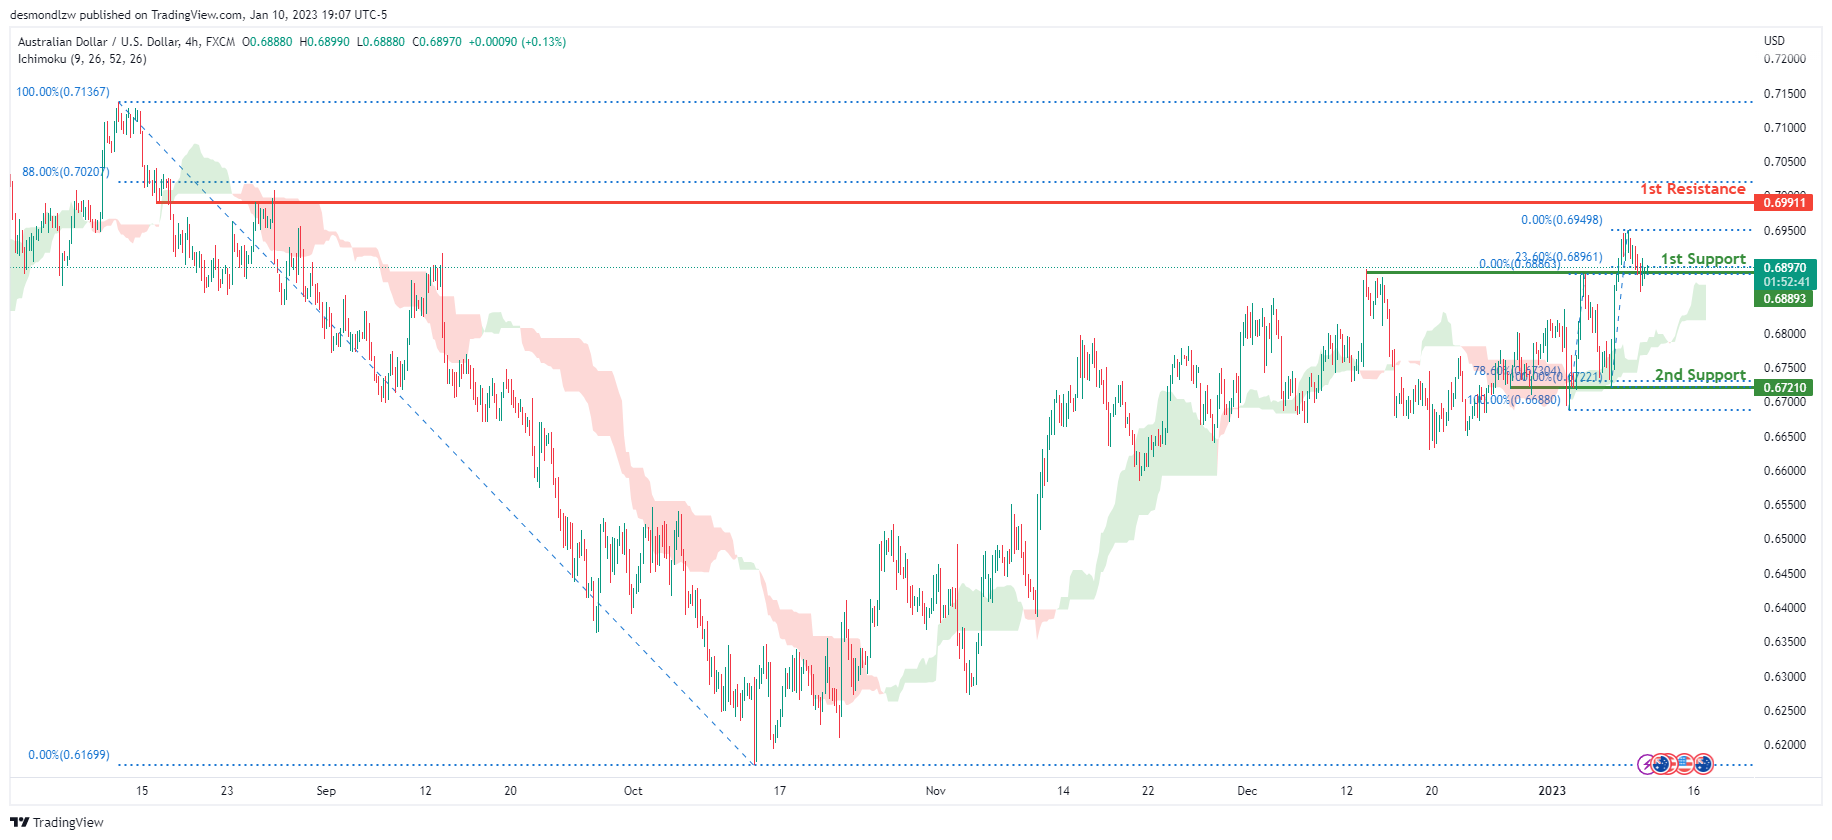
AUD/USD:
Looking at the H4 chart, my overall bias for AUDUSD is bullish due to the current price being above the Ichimoku cloud, indicating a bullish market. If this bullish momentum continues, expect the price to continue heading towards the 1st resistance at 0.69911, where the 88% Fibonacci line is. In an alternative scenario, price could possibly head back down towards the 1st support at 0.68893, where the 23.6% Fibonacci line is.
Areas of consideration
- H4, 1st resistance at 0.69911
- H4, 1st support at 0.68893
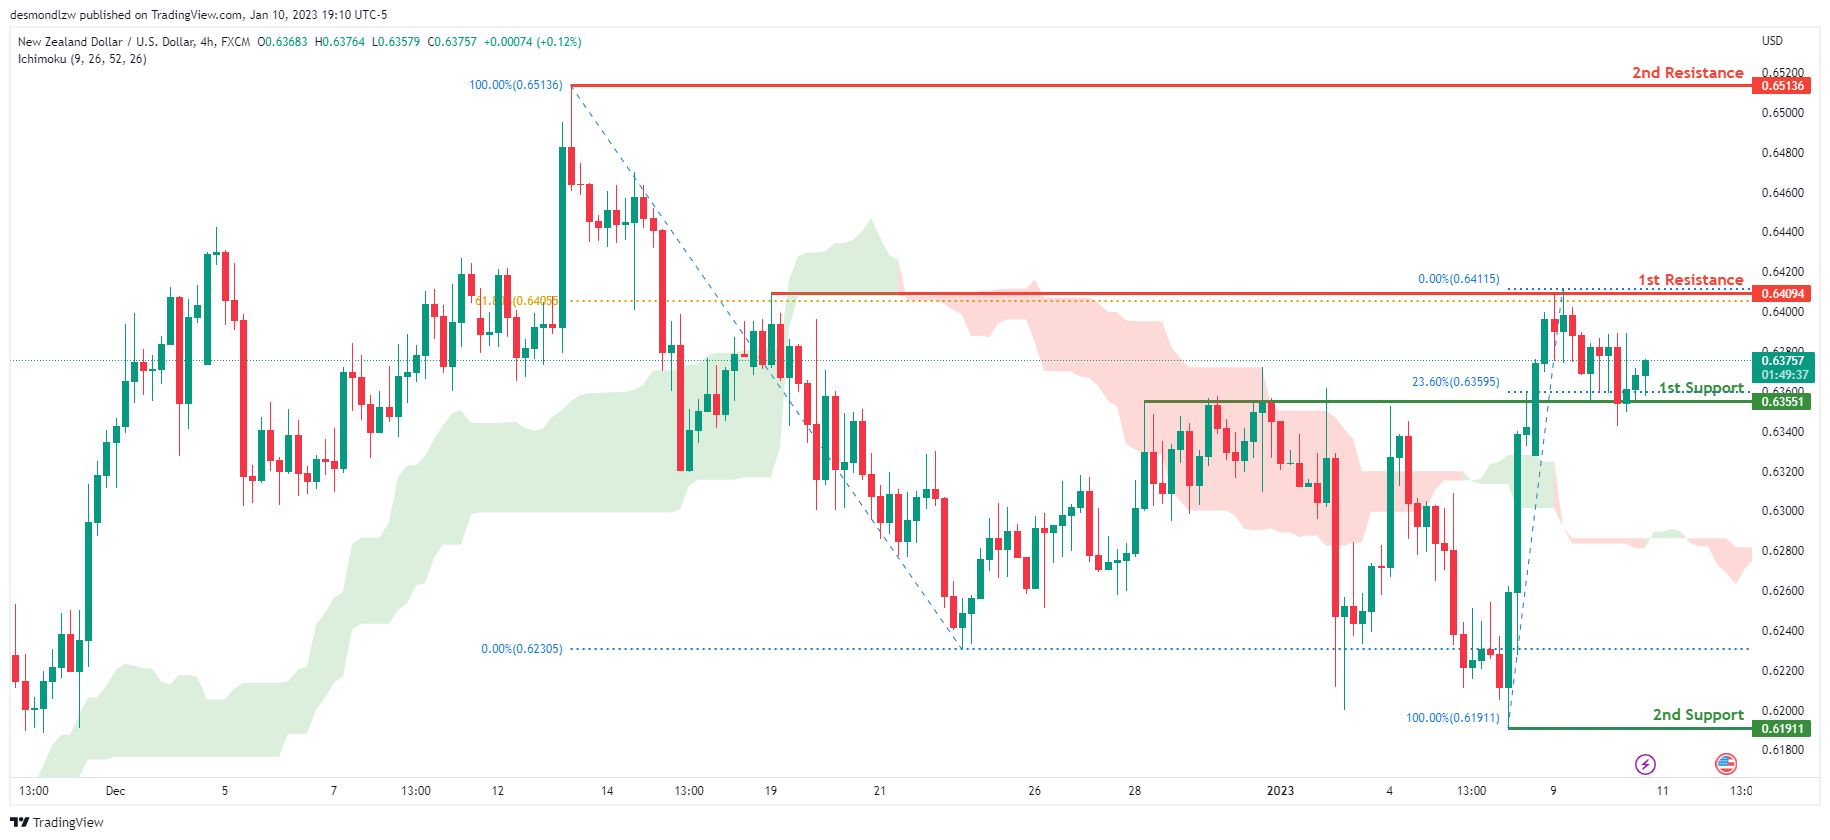
NZD/USD:
Looking at the H4 chart, my overall bias for NZDUSD is bullish due to the current price being above the Ichimoku cloud, indicating a bullish market. If this bullish momentum continues, expect price to possibly continue heading towards the 1st resistance at 0.64094, where the 61.8% Fibonacci line is. In an alternate scenario, price could possibly head back down to retest the 1st support at 0.63551, where the 23.6% Fibonacci line is
Areas of consideration:
- H4 time frame, 1st resistance at 0.64094
- H4 time frame, 1st support at 0.63551
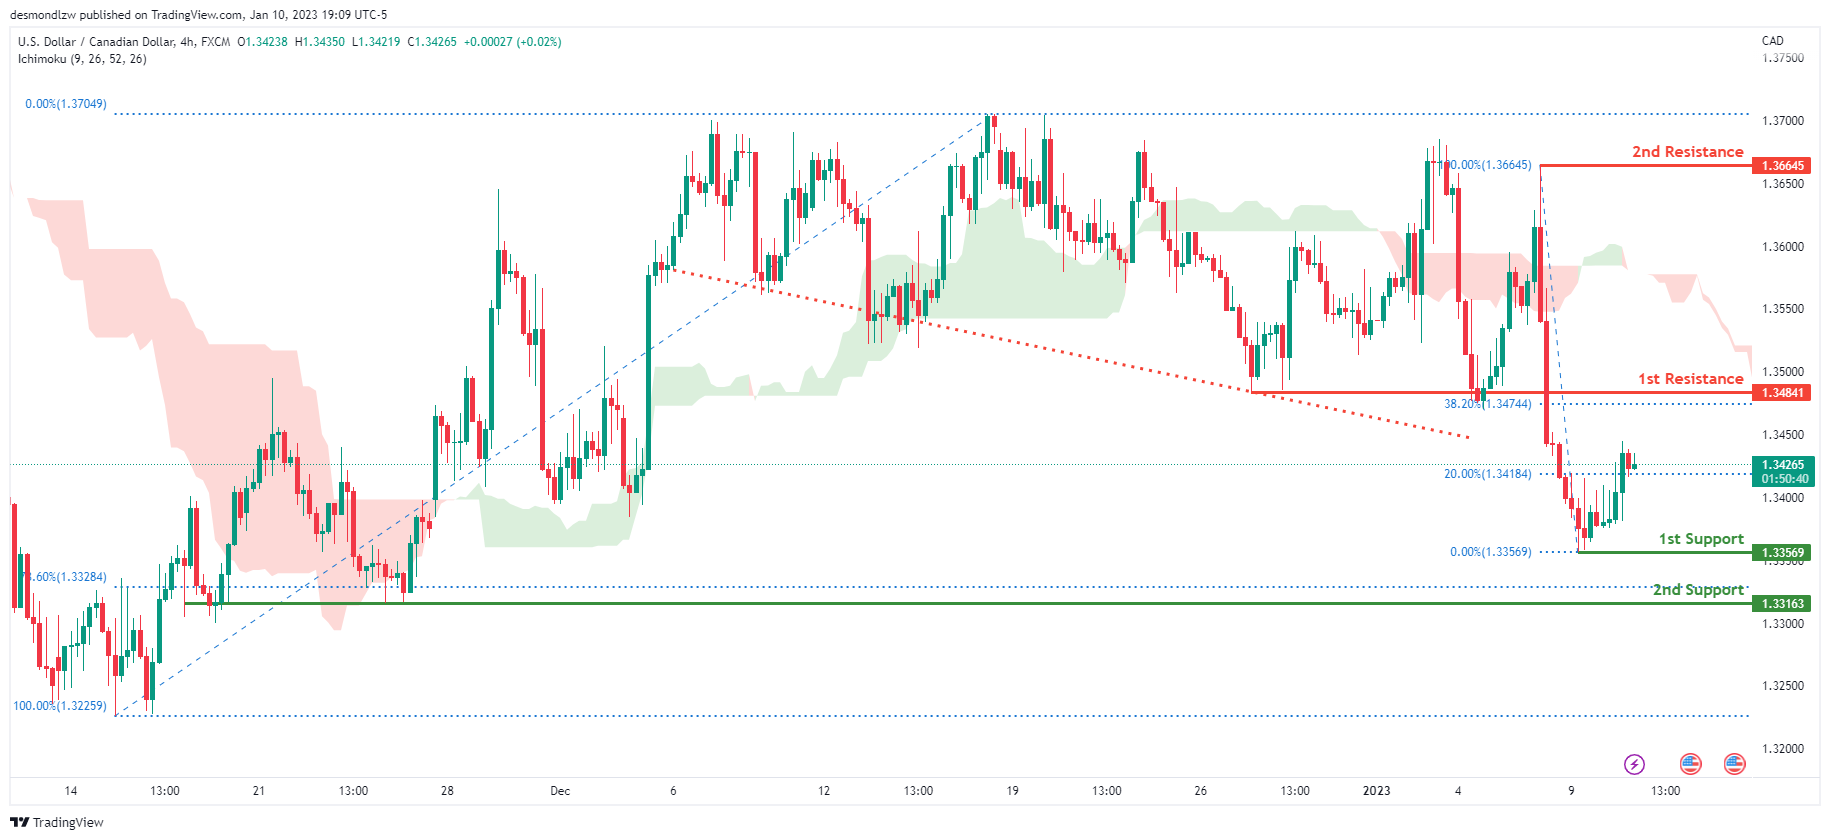
USD/CAD:
On the H4 chart, the overall bias for USDCAD is bearish. To add confluence to this, the price is below the Ichimoku cloud which indicates a bearish market. To add support to this bias, price has also broken under the descending trendline indicating strong bearish momentum. If this bearish momentum continues, expect the price to possibly head towards the 1st support at 1.33569, where the recent low is. In an alternative scenario, price could head back up to retest the 1st resistance at 1.34841, where the 38.2% Fibonacci line is.
Areas of consideration:
- H4 time frame, 1st resistance at 1.34841
- H4 time frame, 1st support at 1.33569
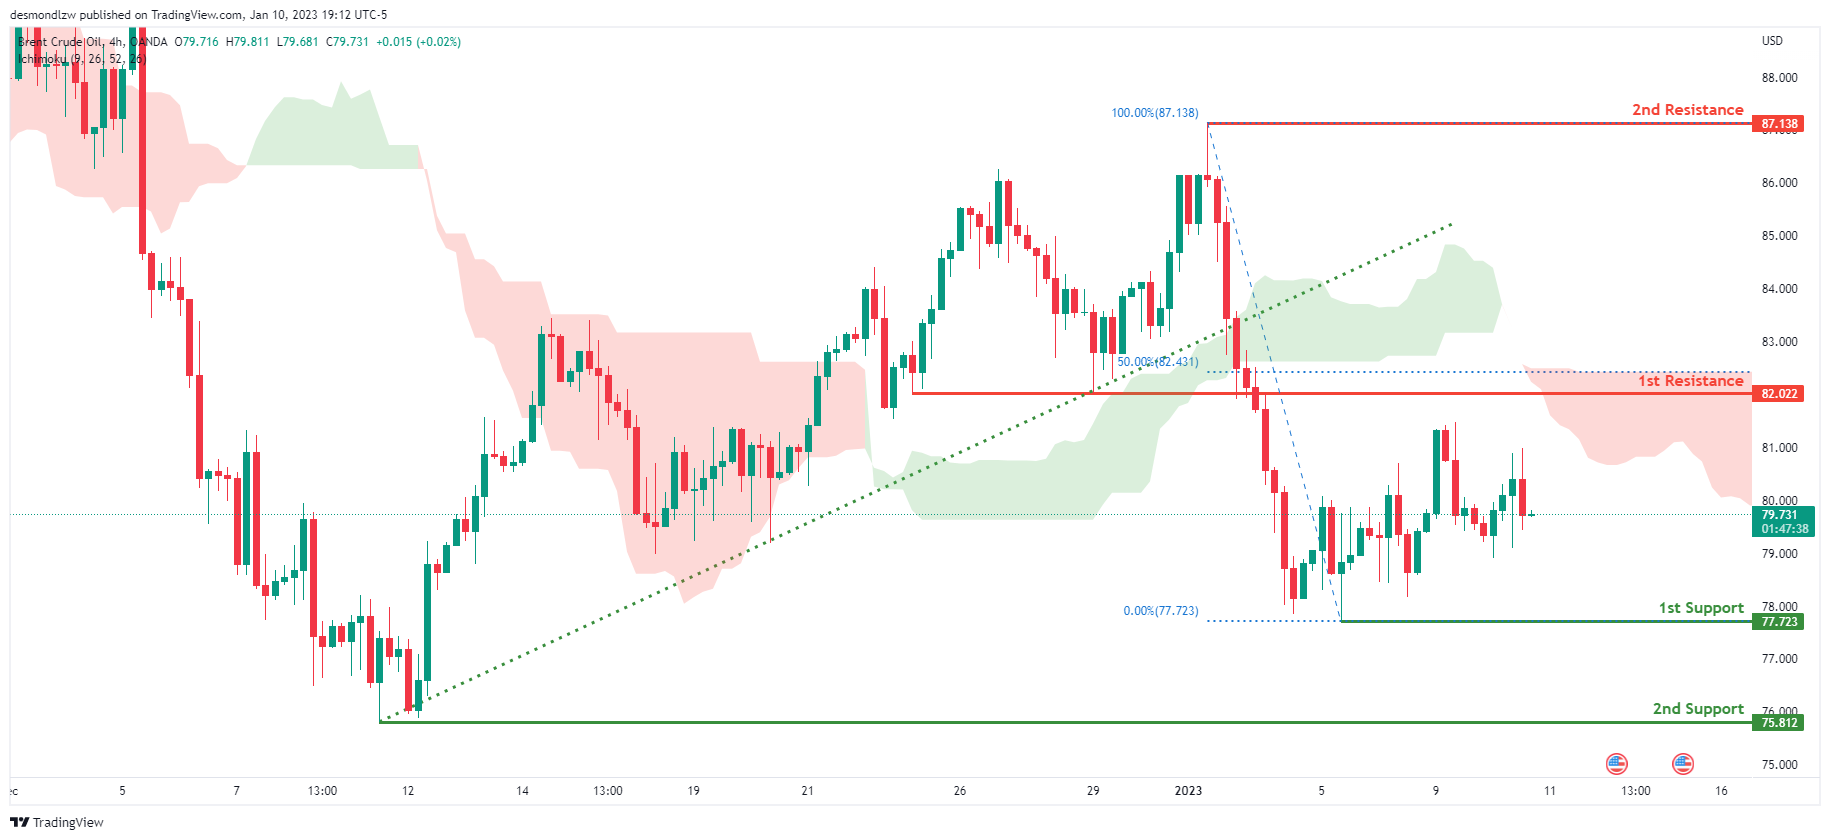
OIL:
Looking at the H4 chart, my overall bias for BCOUSD is bearish due to the current price crossing below the Ichimoku cloud, indicating a bearish market. Adding more confluence to this bias, price has also broken the ascending trend line. If this bearish momentum continues, expect the price to possibly continue heading towards the 1st support at 77.723, where the recent low is. In an alternate scenario, price could possibly head back up to retest the 1st resistance at 82.022, slightly below where the 50% Fibonacci line is
Areas of consideration:
- H4 time frame, 1st resistance at 82.022
- H4 time frame, 1st support at 77.723
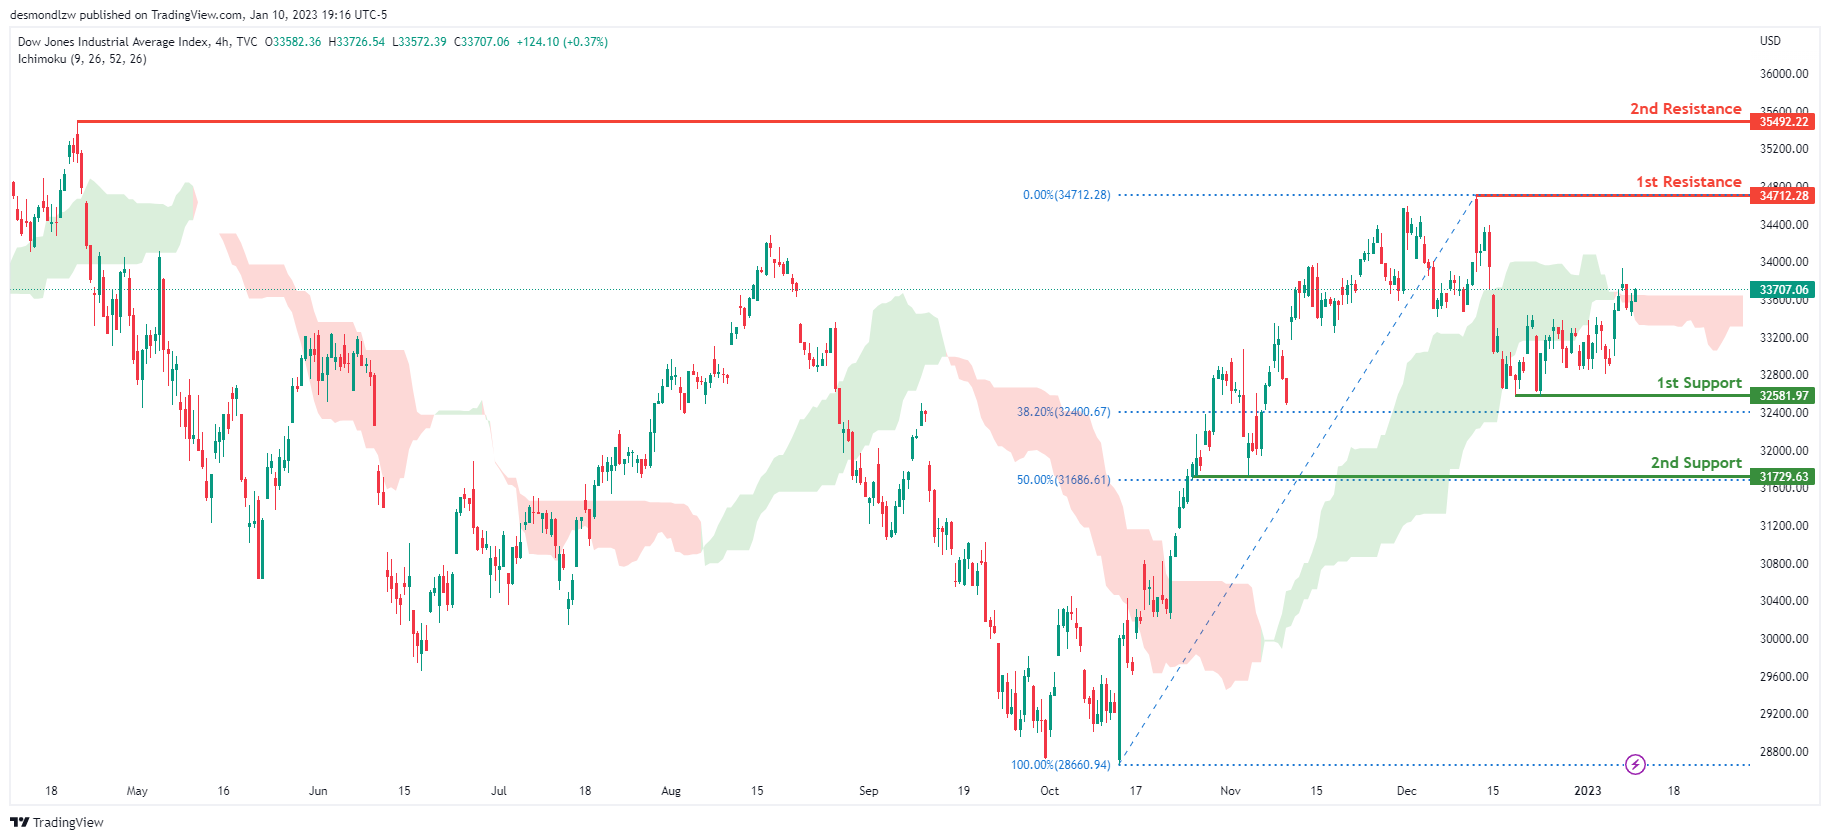
Dow Jones Industrial Average:
On the H4 chart, the overall bias for DJI is bearish. To add confluence to this, the price is crossing below the Ichimoku cloud which indicates a bearish market. If this bearish momentum continues, expect the price to head back down towards the 1st support at 32581.97, slightly above where the 38.2% Fibonacci line is. In an alternative scenario, price could possibly continue heading towards the 1st resistance line at 34712.28, where the recent swing high is.
Areas of consideration:
- H4 time frame, 1st support at 32581.97
- H4 time frame, 1st Resistance at 34712.28
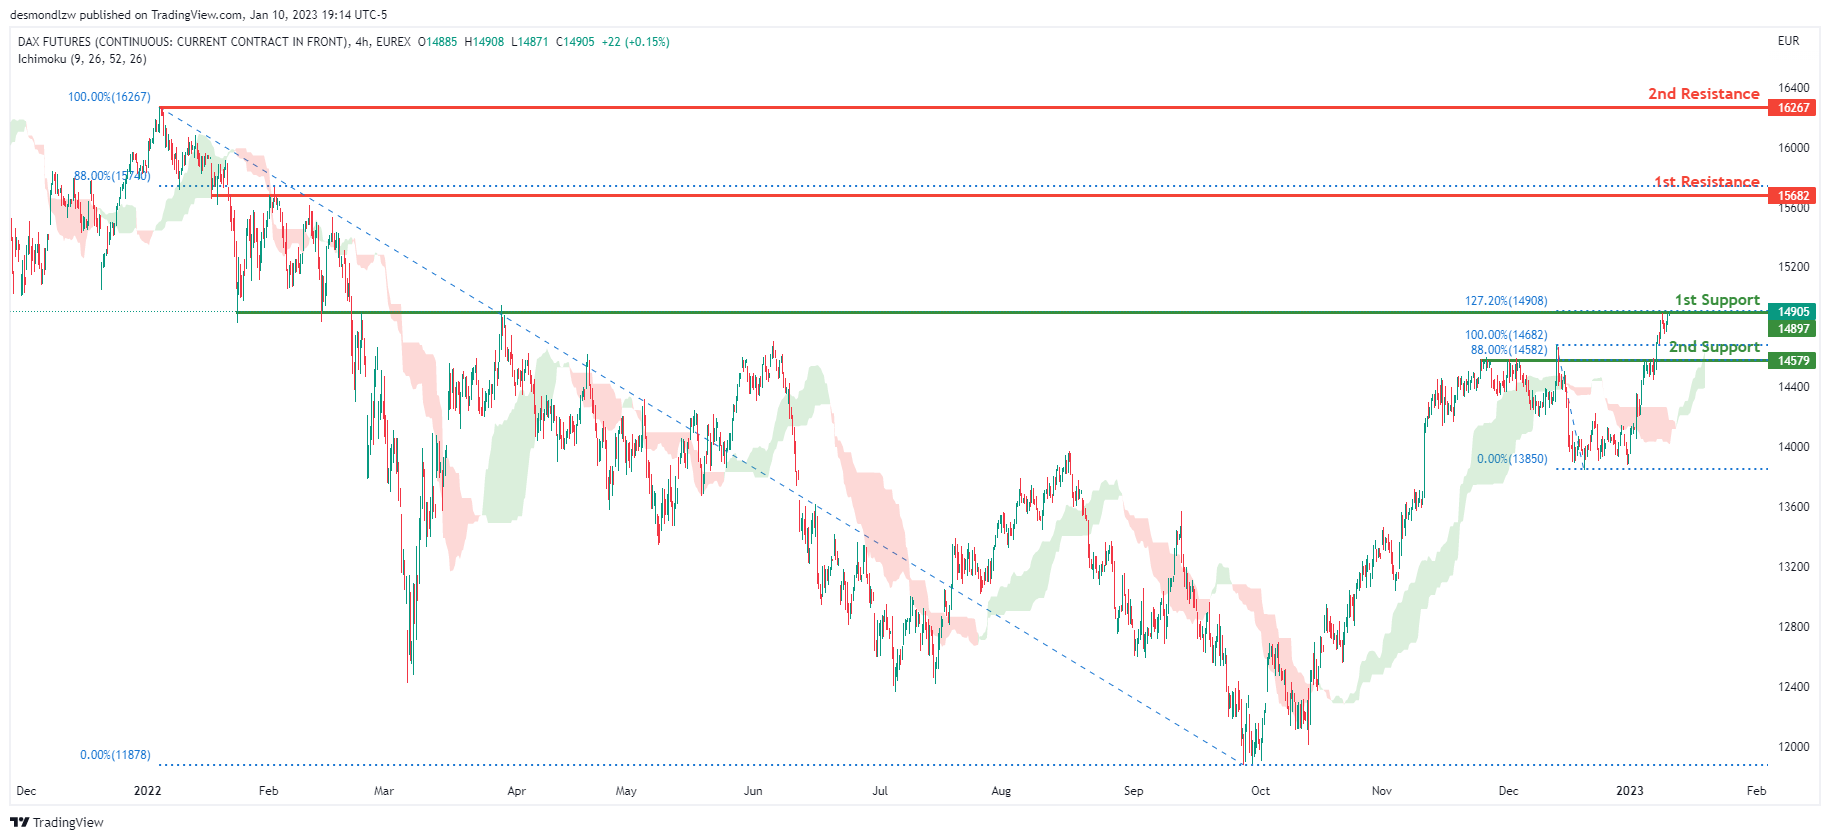
DAX:
Looking at the H4 chart, my overall bias for DAX is bullish due to the current price crossing above the Ichimoku cloud, indicating a bullish market. If this bullish momentum continues, expect the price to possibly head towards the 1st resistance line at 15682, where the 88% Fibonacci line is. In an alternative scenario, price could possibly head down to break the 1st support at 14897, where the 127.2% Fibonacci extension line is, before heading towards the 2nd support at 14579, where the 88% Fibonacci line is.
Areas of consideration:
- H4 time frame, 1st resistance is at 15682
- H4 time frame, 1st support is at 14897
- H4 time frame, 2nd support is at 14579
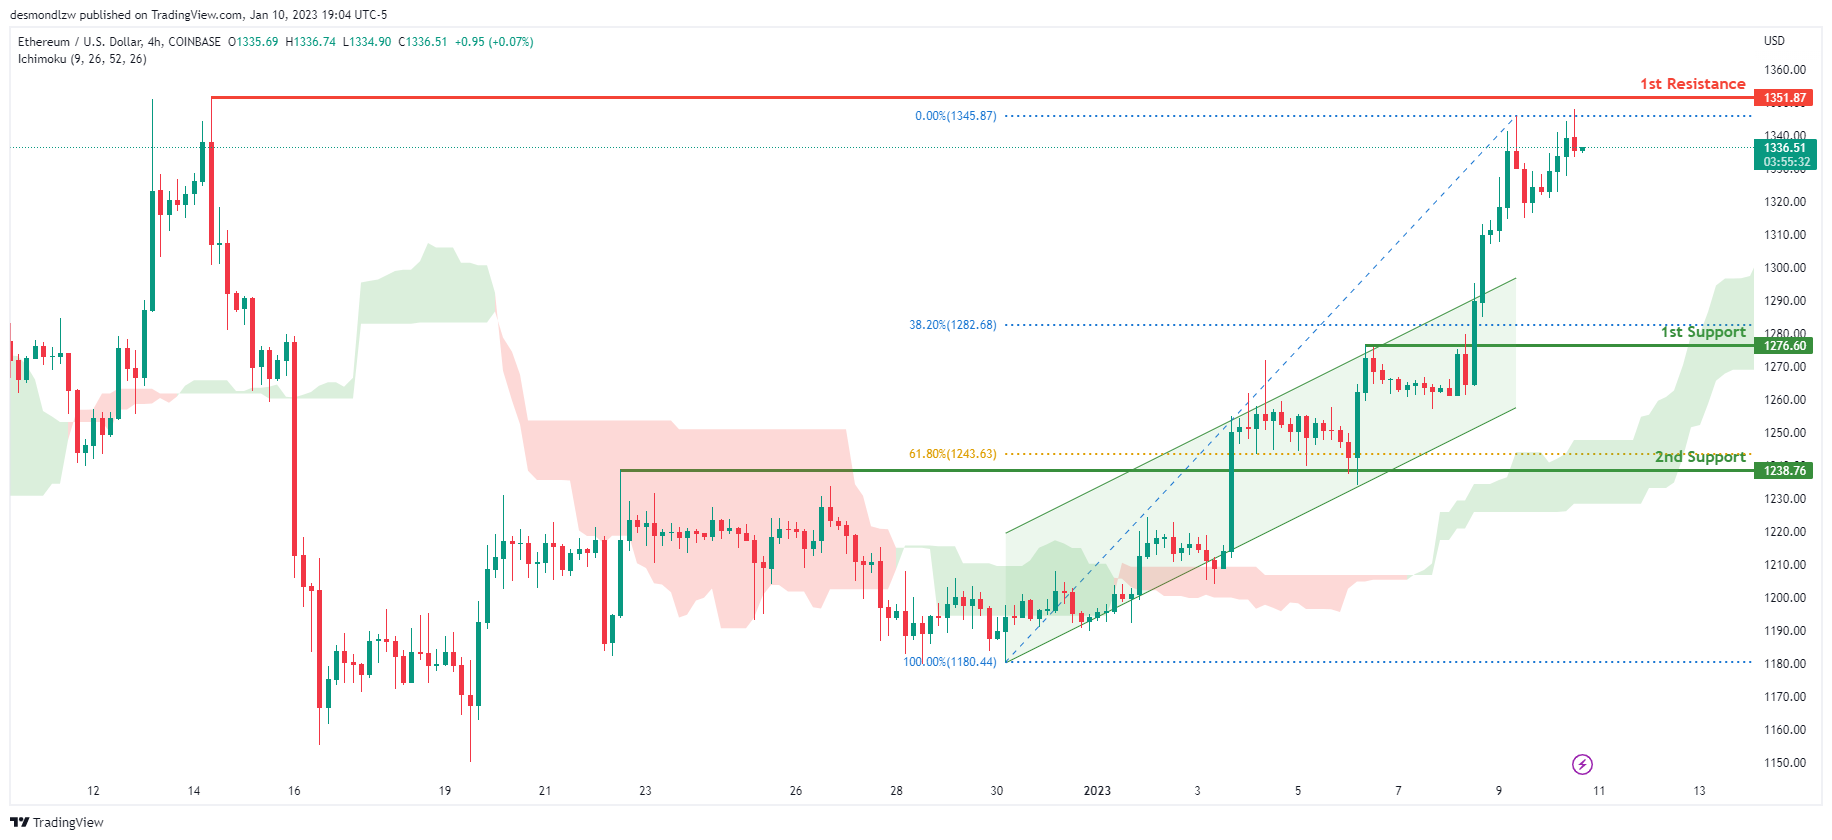
ETHUSD:
Looking at the H4 chart, my overall bias for ETHUSD is bullish due to the current price crossing above the Ichimoku cloud, indicating a bullish market. To add support to this bias, price is also broken upwards from an ascending channel. If this bullish momentum continues, expect the price to head towards the 1st resistance at 1351.87, where the previous swing high is. In an alternative scenario, price could head back down to retest the 1st support at 1276.60, where the 38.2% Fibonacci line is.
Areas of consideration:
- H4 time frame, 1st resistance of 1351.87
- H4 time frame, 1st support at 1276.60
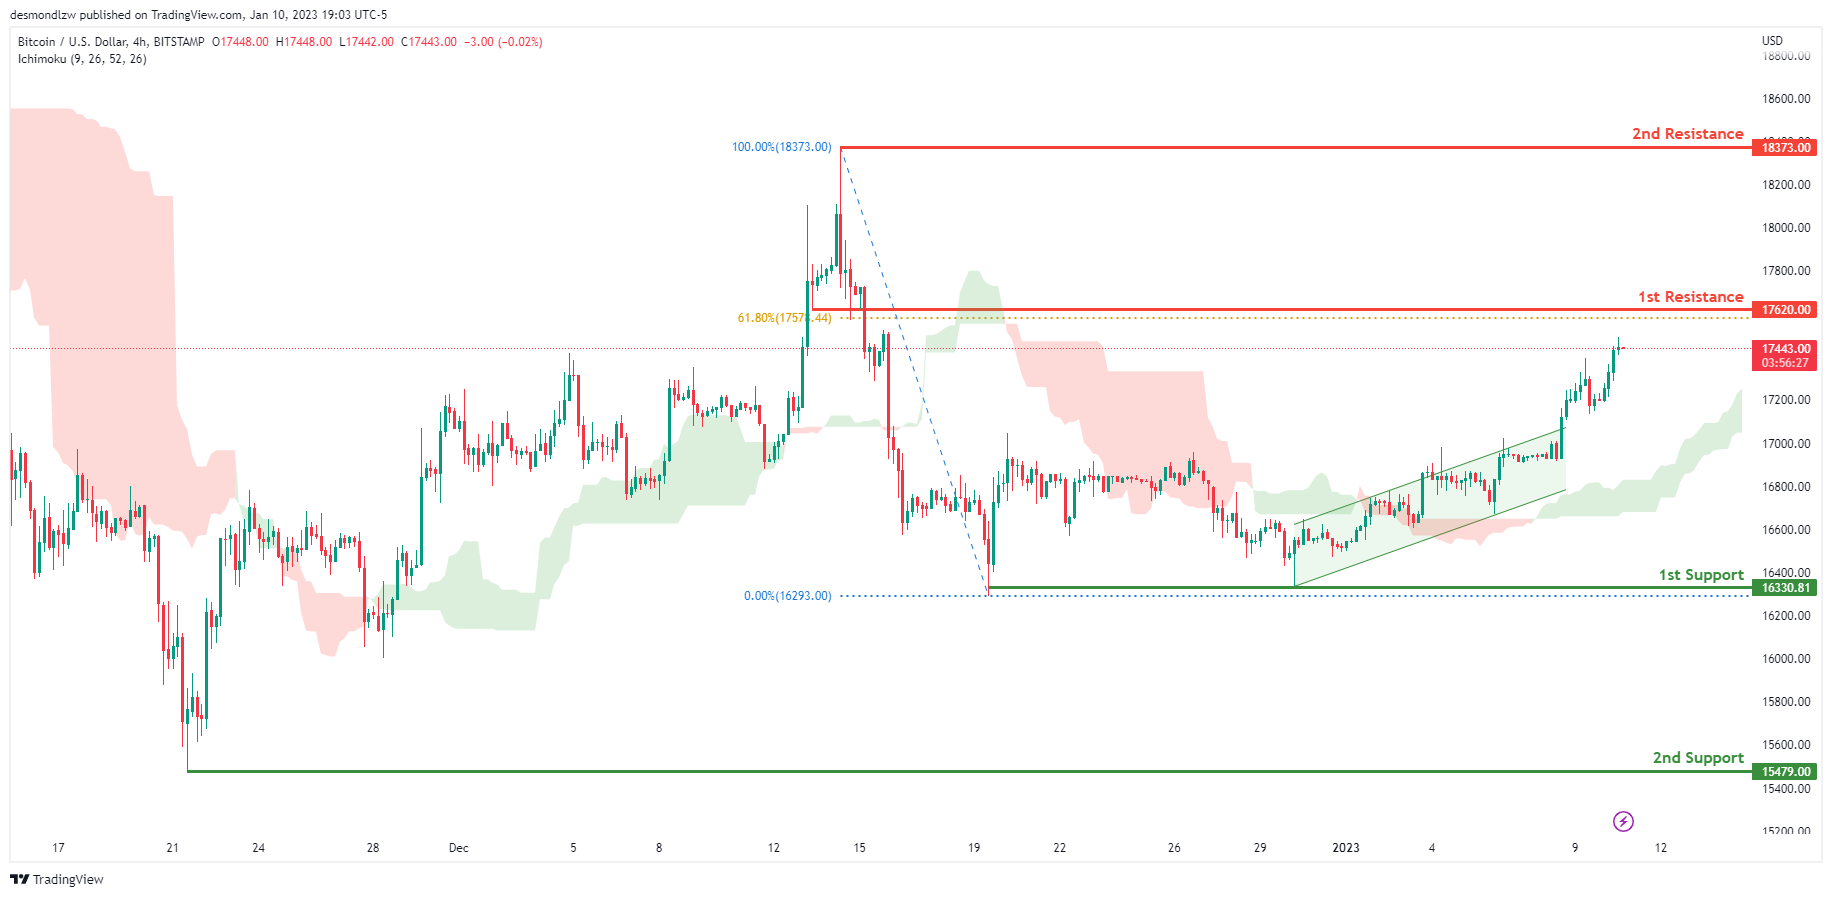
BTCUSD:
Looking at the H4 chart, my overall bias for BTCUSD is bullish due to the current price being above the Ichimoku cloud, indicating a bullish market. To add support to this bias, price is also within a bullish ascending channel. If this bullish momentum continues, expect the price to possibly continue heading towards the 1st resistance at 17620.00, where the 61.8% Fibonacci line is. In an alternative scenario, price could possibly head back down towards the 1st support at 16330.81, where the recent low and liquidity hotspot are.
Areas of consideration:
- H4 time frame, 1st resistance 17620.00
- H4 time frame, 1st support at 16330.81
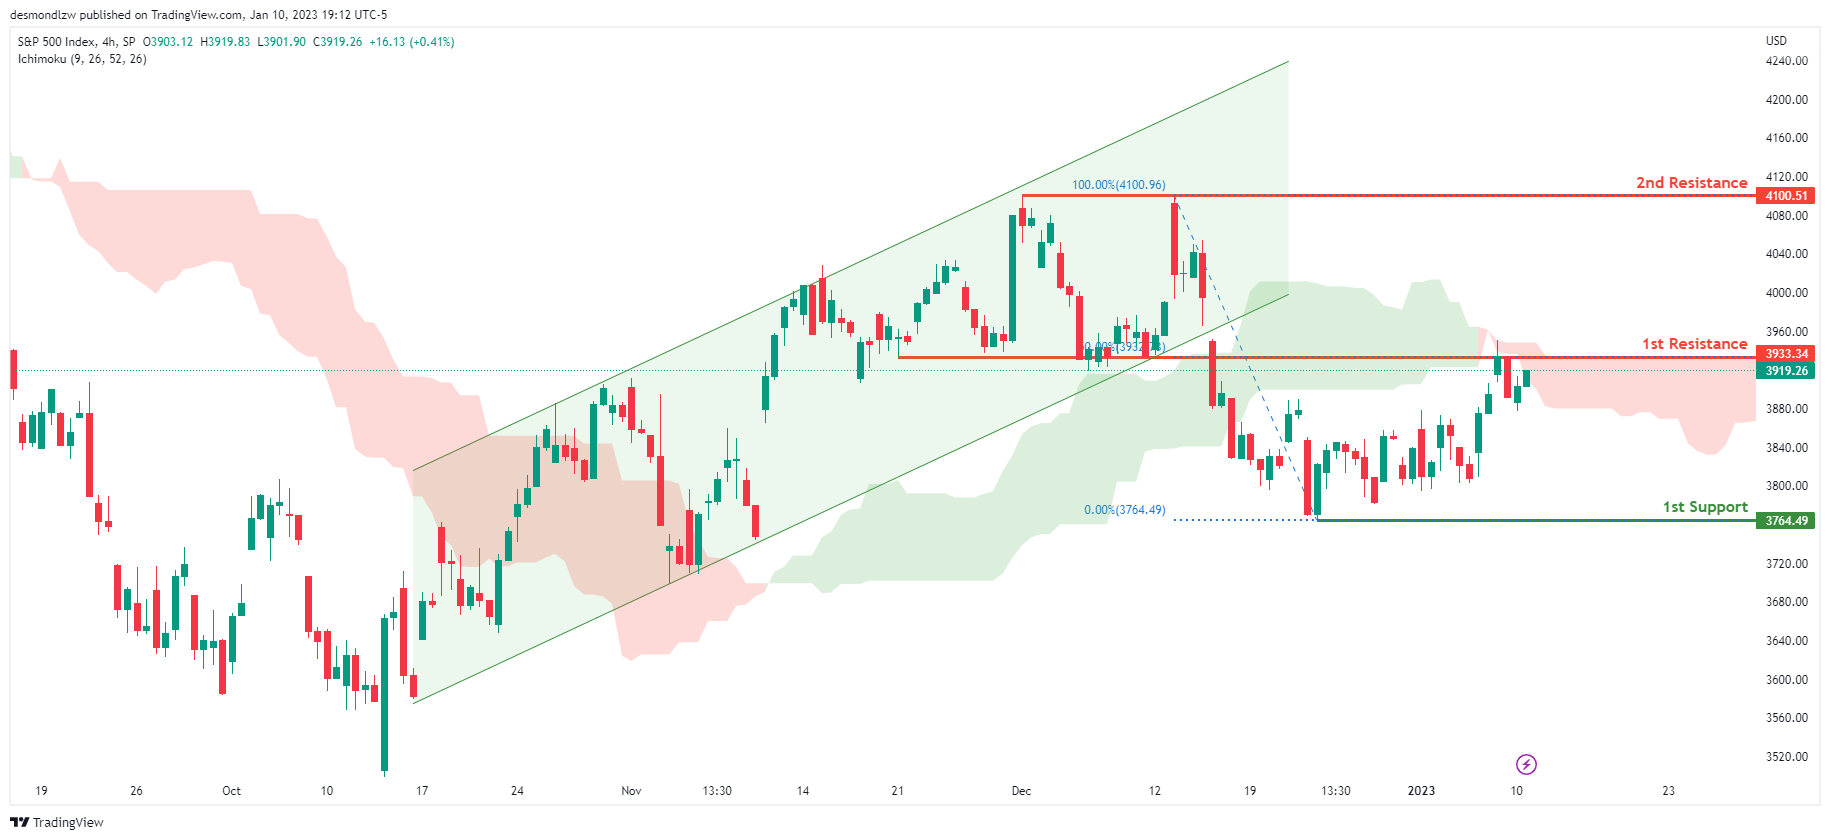
S&P 500:
Looking at the H4 chart, my overall bias for S&P500 is bearish due to the current price being below the Ichimoku cloud, indicating a bearish market. If this bearish momentum continues, expect the price to continue heading towards the 1st support at 3764.49, where the recent low is. In an alternative scenario, price could possibly head back up to retest the 1st resistance at 3933.34, where the 50% Fibonacci line is.
Areas of consideration:
- H4 time frame, 1st support at 3764.49
- H4 time frame, 1st resistance at 3933.34
The accuracy, completeness and timeliness of the information contained on this site cannot be guaranteed. IC Markets does not warranty, guarantee or make any representations, or assume any liability regarding financial results based on the use of the information in the site.
News, views, opinions, recommendations and other information obtained from sources outside of www.icmarkets.com, used in this site are believed to be reliable, but we cannot guarantee their accuracy or completeness. All such information is subject to change at any time without notice. IC Markets assumes no responsibility for the content of any linked site.
The fact that such links may exist does not indicate approval or endorsement of any material contained on any linked site. IC Markets is not liable for any harm caused by the transmission, through accessing the services or information on this site, of a computer virus, or other computer code or programming device that might be used to access, delete, damage, disable, disrupt or otherwise impede in any manner, the operation of the site or of any user’s software, hardware, data or property.