
Key risk events today:
US CPI m/m and Core CPI m/m; Crude Oil Inventories; FOMC Economic Projections; FOMC Statement and Federal Funds Rate; FOMC Press Conference.
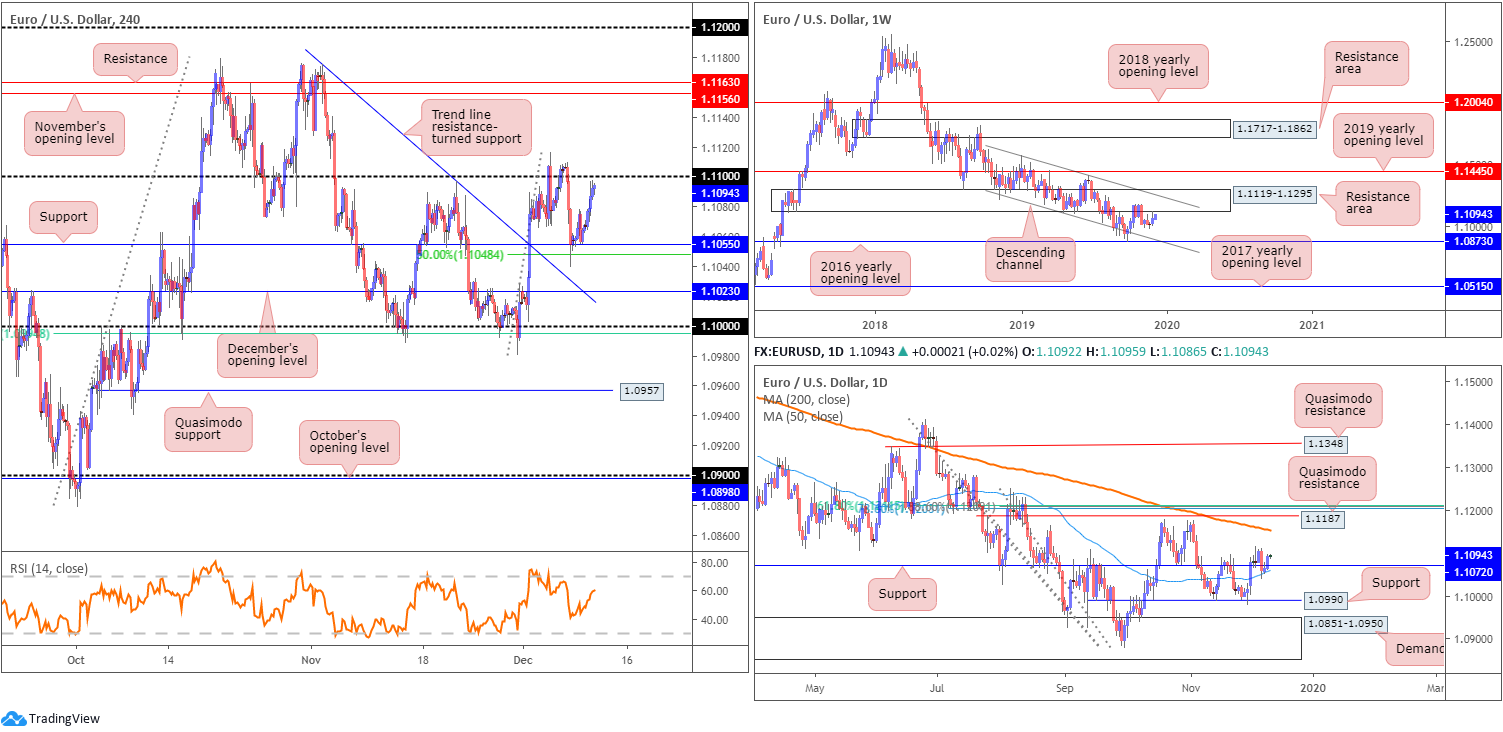
EUR/USD:
Europe’s shared currency pencilled in a reasonably solid performance against the buck Tuesday, adding more than 28 points, or 0.26%. Upbeat ZEW metrics for Germany, nevertheless, failed to excite traders. In terms of the US dollar index, the piece closed lower and tested 97.50 and, overall, remains capped by weekly trend line resistance, extended from the low 88.25.
H4 support priced in at 1.1055 and a 50.0% retracement ratio at 1.1048 continues to underpin the pair, with the H4 candles closing a few points south of the 1.11 handle. November’s opening level plotted at 1.1156, closely followed by resistance at 1.1163, are noted upside targets beyond 1.11 to be aware of. Note between 1.11 and 1.1163, limited supply is visible.
Price movement based on the weekly timeframe remains hovering south of a long-standing resistance area at 1.1119-1.1295. It might also interest some traders to note the beginning of November 2018 observed the pair launch a descending channel, formed from a high set at 1.1569 and a low of 1.1109. Downside moves from current price have the lower boundary of the descending channel to target, which unites closely with the 2016 yearly opening level at 1.0873.
Interestingly, daily action reclaimed resistance at 1.1072 in relatively robust fashion, generating support off the 50-day SMA (blue – 1.1060). Continued bidding may lead to an approach towards the 200-day SMA (1.1153), closely tailed by Quasimodo resistance at 1.1187.
Areas of consideration:
While a break of 1.11 represents a bullish indicator, with upside targets set around the 200-day SMA and H4 resistance highlighted above at 1.1163/1.1156, traders should remain aware that a long above 1.11 faces potential resistance from weekly supply at 1.1119-1.1295. Conservative traders may opt to wait and see if a retest at 1.11 forms, preferably in the shape of a H4 bullish candlestick configuration, following the breakout higher. This not only helps identify buyer intent, it also provides entry and risk levels to work with (helping to judge potential risk/reward metrics).
An alternative scenario may be H4 price whipsaws through 1.11, trips buy stops, and collects weekly sellers from supply for a turn lower. A close back beneath 1.11 after testing supply could, therefore, be a possible bearish theme worthy of consideration.
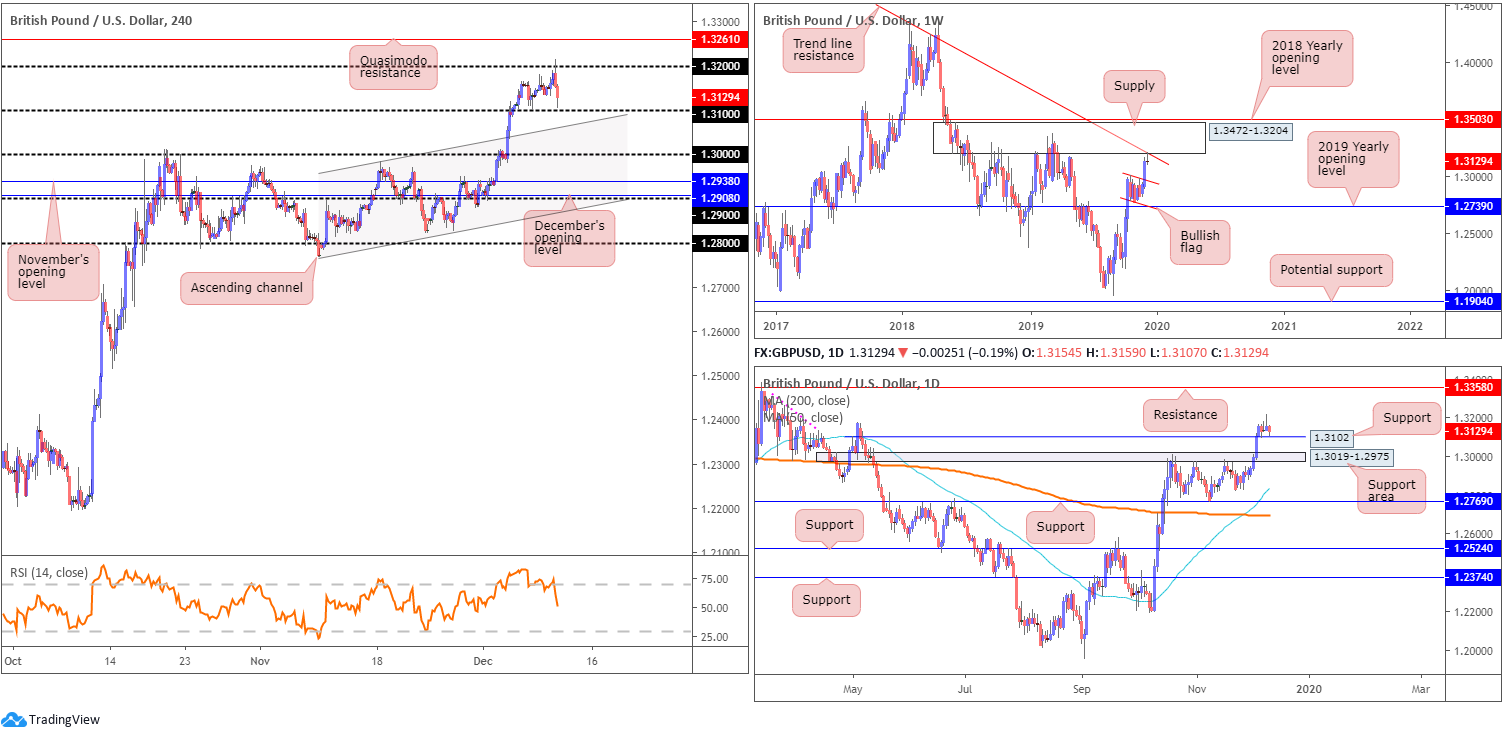
GBP/USD:
GBP/USD fell sharply in recent hours, following the latest YouGov poll. The YouGov MRP Model showed Conservatives on track for a 28-seat majority vs. previous forecast of a 68-seat majority.
The combination of political drivers, stop running above 1.32 on the H4 timeframe (not only did this move likely trip buy stops from traders attempting to fade the round number, breakout buyers also felt the sting) and weekly supply at 1.3472-1.3204 entering the fight, which merges with long-term trend line resistance, etched from the high 1.5930, guided the pound to lower levels.
As of current price, H4 is establishing intraday support ahead of 1.31. South of here, we also have a channel resistance-turned support worthy of note, extended from the high 1.2984. Daily price also displays support at 1.3102, a prior Quasimodo resistance level.
Areas of consideration:
Well done to any readers who managed to short 1.32 as this, given its connection with weekly supply, was a noted barrier for possible selling opportunities in previous reports.
Going forward, GBP/USD trades at a critical juncture. The noted weekly supply will likely weigh on any buying, while active buyers from 1.31 on the H4, along with daily support at 1.3102, could form a defence.
Intraday, a fakeout through 1.31 into H4 channel support highlighted above may materialise. A H4 close back above 1.31 will help confirm this bullish theme for a possible run back to 1.32. Keep in mind, however, entering long from this angle places the position in direct contact with potential weekly selling.
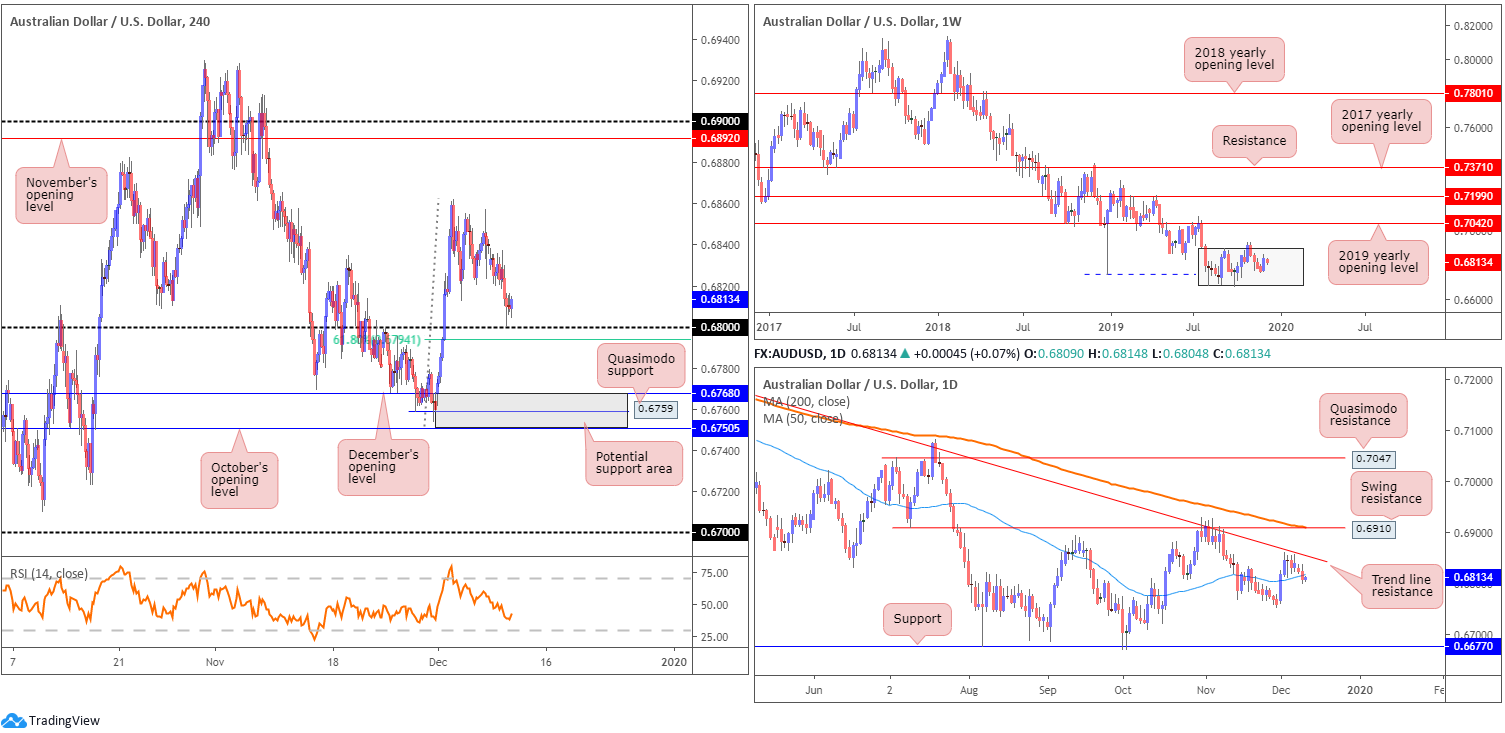
AUD/USD:
The Australian dollar ceded further ground to the greenback Tuesday, notching losses of more than 14 points, or 0.21%, as global trade uncertainty remains a key driver in this market.
Technical research based on the H4 timeframe this morning shows the pullback from the December 03 high 0.6862 recently crossed swords with the 0.68 handle, and mildly pared losses into the close. A few points south of the round number lies a 61.8% Fibonacci retracement ratio at 0.6794. Also of interest is the support area at 0.6750/0.6768 (comprised of October’s opening level at 0.6750, Quasimodo support at 0.6759 and December’s opening level at 0.6768).
Higher-timeframe action continues to emphasise a ranging condition on the weekly timeframe between 0.6894/0.6677 (light grey). With the primary downtrend in play since early 2018, a breakout lower is favoured. Daily price, on the other hand, crossed below the 50-day SMA (blue – 0.6817), following a topping formation just south of long-term trend line resistance, extended from the high 0.7393. This highlights the 0.6754 November 29 low, and notable support coming in at 0.6677.
Areas of consideration:
In the event we break through 0.68 today, traders’ crosshairs will likely be fixed on 0.6750/0.6768 for a potential bounce higher. Owing to its lack of higher-timeframe confluence, nevertheless, traders are urged to consider waiting for additional bullish confirmation before pulling the trigger. This could be something as simple as a bullish candlestick configuration.
Traders long from 0.68, on the other hand, currently face resistance from the 50-day SMA. A daily close back above this line adds weight to further buying from 0.68, with an attack at tops around 0.6850 likely then in store.
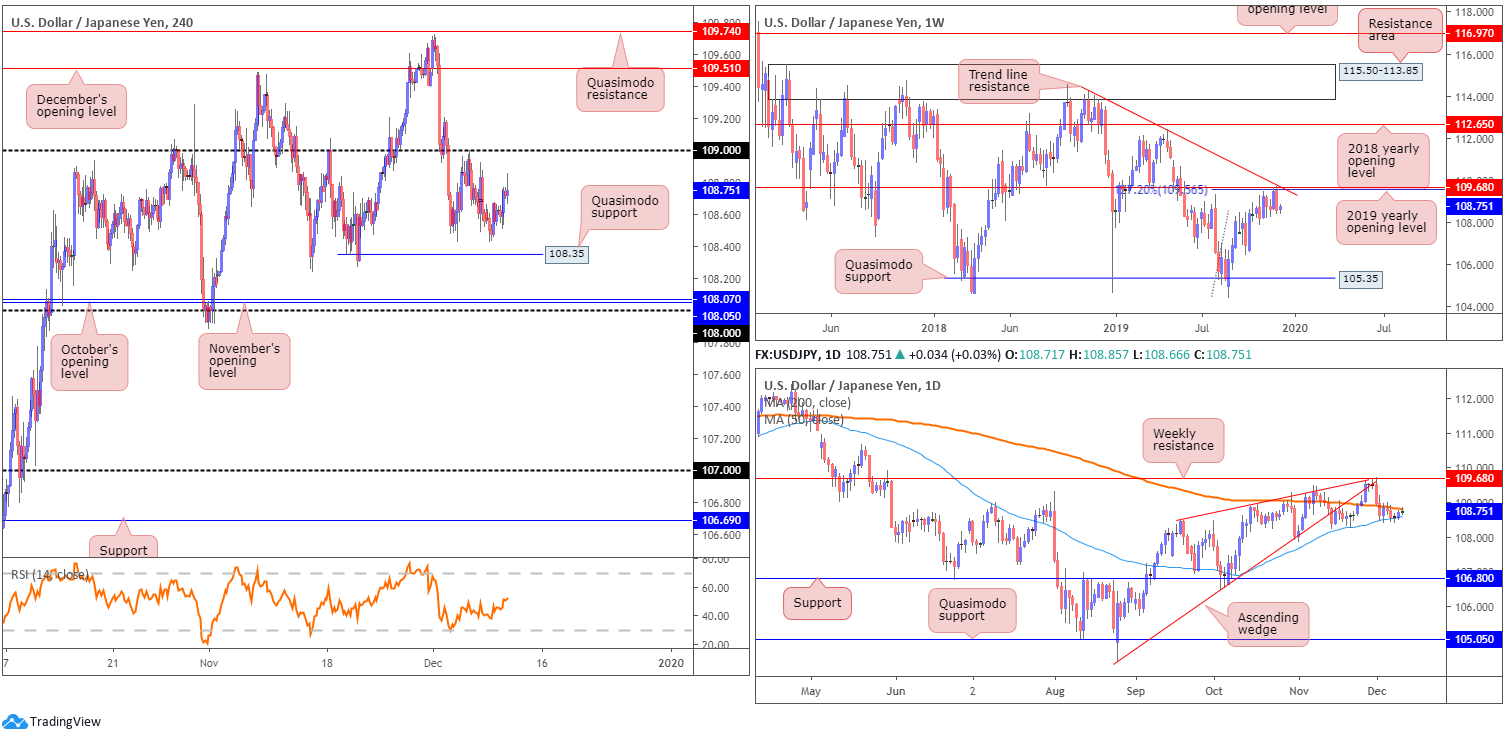
USD/JPY:
Despite global uncertainty affecting flows, USD/JPY remained relatively stable Tuesday.
As highlighted in previous reports, weekly price produced a bearish engulfing pattern last week, based off a collection of notable resistances: a 127.2% Fibonacci ext. point at 109.56 (taken from the low 104.44), resistance formed at 109.68, the 2019 yearly opening level and trend line resistance, extended from the high 114.23. Aside from the 106.48 September 30 swing low, limited support is evident on the weekly timeframe until shaking hands with Quasimodo support at 105.35.
Meanwhile, daily action remains sandwiched between the 50/200-day SMAs (blue – 108.59/orange – 108.80). Areas outside of this range can be seen around weekly resistance mentioned above at 109.68, and daily support coming in from 106.80.
H4 activity continues to hold south of the 109 handle. Quasimodo support at 108.35 rests close by, shadowed by the 108 handle and November and October’s opening levels at 108.05 and 108.07, respectively. A move through 109 has December’s opening level in view at 109.51, as well as Quasimodo resistance at 109.74.
Areas of consideration:
Although weekly price suggests further losses could be on the cards, entering short in this market while daily price is in a phase of consolidation between the two said SMAs is likely to deter many traders. Once, or indeed if, a daily close south of the 50-day SMA occurs, technical selling will likely weigh on market movement. This could potentially be actionable this week.
A H4 close north of 109, on the other hand, may generate additional bidding, with eyes on December’s opening level at 109.51 as the initial upside target. By entering long above 109, nonetheless, you’re essentially competing against potential selling out of the weekly timeframe. For that reason, strict trade management is a must.
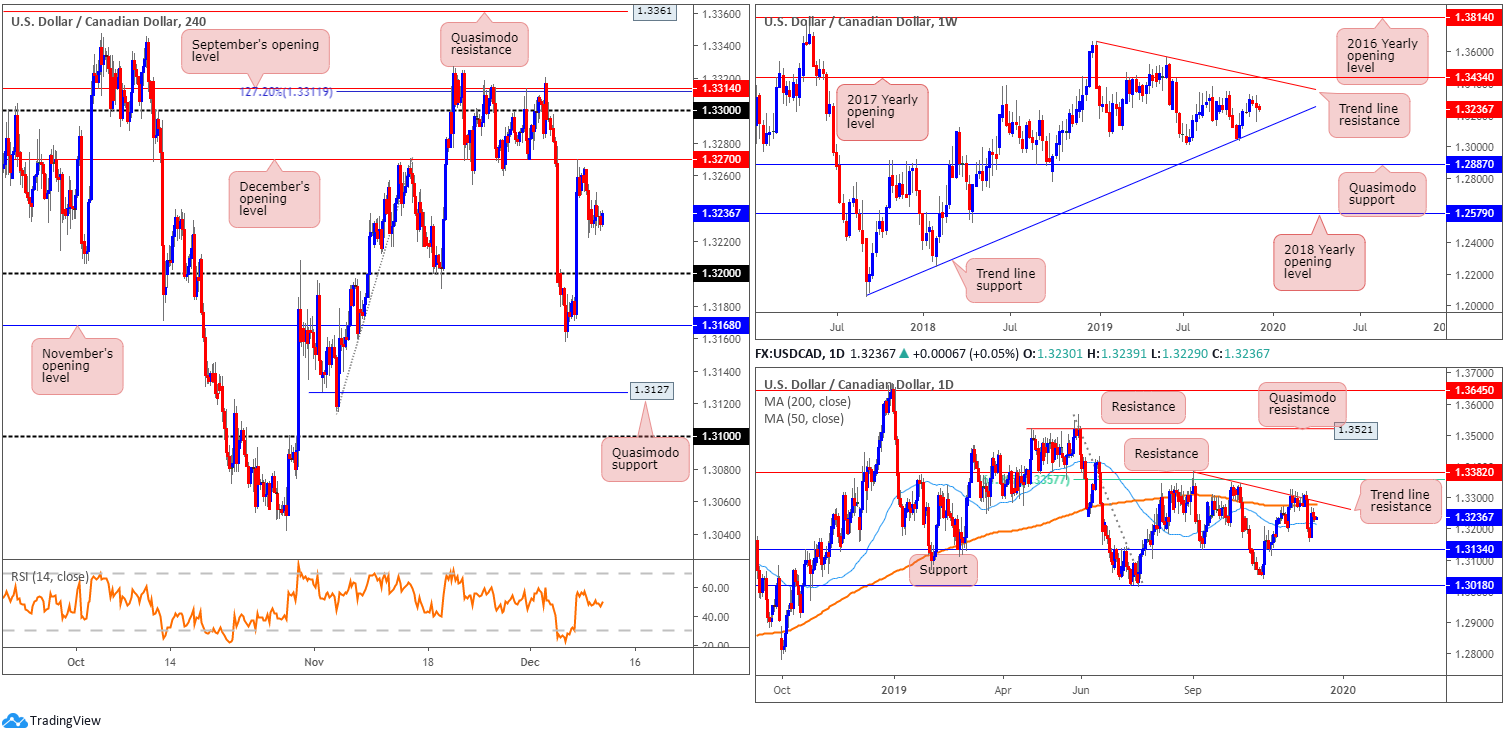
USD/CAD:
The US dollar wrapped up a shade lower against the Canadian dollar Tuesday, as H4 movement appears to be losing traction following Monday’s push south of December’s opening level at 1.3270.
The key technical observation on the weekly timeframe, as underscored in recent writing, consists of a trend line support, extended from the low 1.2061, tops around 1.3342, the 2017 yearly opening level at 1.3434 and a trend line resistance, taken from the peak at 1.3661. Overall, the immediate trend faces north since bottoming in September 2017, though this move could also be considered a deep pullback in a larger downtrend from the 1.4689 peak in early January 2016.
A closer reading of the daily timeframe has the unit stationed below a local trend line resistance, extended from the high 1.3382. Interestingly, the 200-day SMA (orange – 1.3276) is also seen converging closely with the descending line. A few points south of price, we also have the 50-SMA (blue – 1.3214) that may offer support this week, closely followed by another layer of support at 1.3134. At the same time, a break north could lead to an approach towards a 61.8% Fibonacci retracement value at 1.3357, followed by resistance at 1.3382.
Although H4 structure exhibits scope to press lower until reaching 1.32, daily price, as stressed above, has the 50-day SMA circling around 1.3214.
Areas of consideration:
Monday’s report stated that based on Friday’s to-the-point reaction off December’s opening level at 1.3270, which formed a reasonably notable H4 bearish candle, short sellers will likely be attempting to sell this market. Those who went short based on current structure, therefore, ended both Monday and Tuesday in profit. As stated above, the 50-day SMA is considered the initial downside target for sellers, followed by the 1.32 handle.
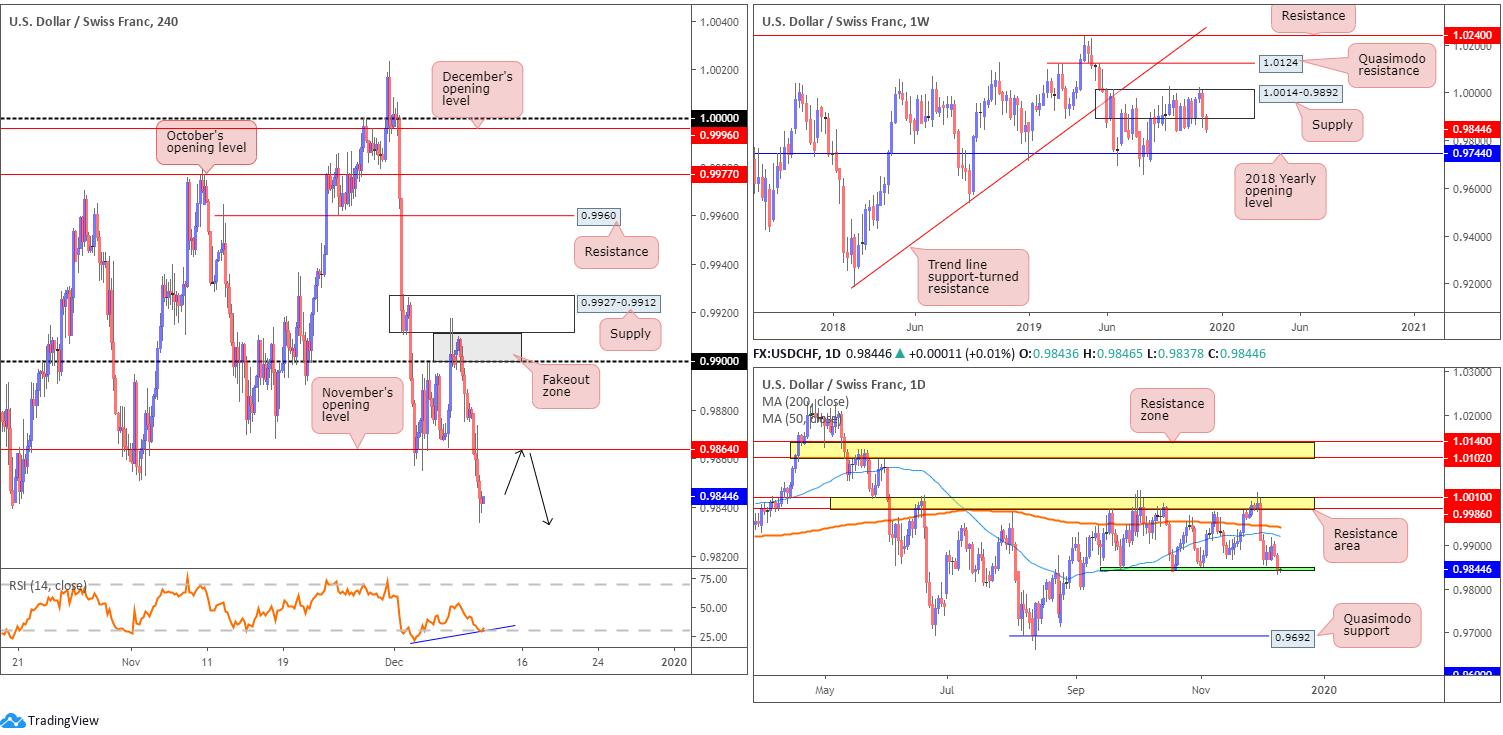
USD/CHF:
USC/CHF continued to spiral south Tuesday, as persistent trade uncertainty underpinned the Swiss franc’s safe-haven demand.
Traders who read recent technical reports on USD/CHF may recall the following piece (Italics):
A H4 fakeout zone is present between the round number 0.99 and H4 supply at 0.9927-0.9912. It is common knowledge stop-loss orders congregate around psychological levels. Therefore, a break through 0.99 will trip buy stops from not only sellers attempting to fade 0.99, but also those attempting to catch the breakout. This provides liquidity for bigger players to sell into from the noted supply and bring price lower. As such, the current supply area remains a worthy contender for any technician’s watchlist. Well done to any readers who managed to take advantage of the reaction out of H4 supply at 0.9927-0.9912.
Tuesday witnessed additional selling materialise, drawing the H4 candles beyond November’s opening level 0.9864 to lows of 0.9833. Despite seller strength, a correction is likely to take shape today/this week, as not only is the H4 relative strength index (RSI) producing bullish divergence out of oversold territory, daily price also recently crossed paths with the lower edge of a 3-month range at 0.9845. This may prompt a retest to the underside of 0.9864.
Areas of consideration:
Traders who remain short this market may consider unloading a portion of their position today, in light of daily price testing support around 0.9845.
With weekly supply at 1.0014-0.9892 exhibiting scope to approach the 2018 yearly opening level at 0.9744, however, a retest at the underside of December’s opening level drawn from 0.9864 could provide a platform for additional shorts.
In order to help avoid a whipsaw through 0.9864, traders will likely search for additional candle confirmation before pulling the trigger – think shooting star or a bearish engulfing pattern, for example.
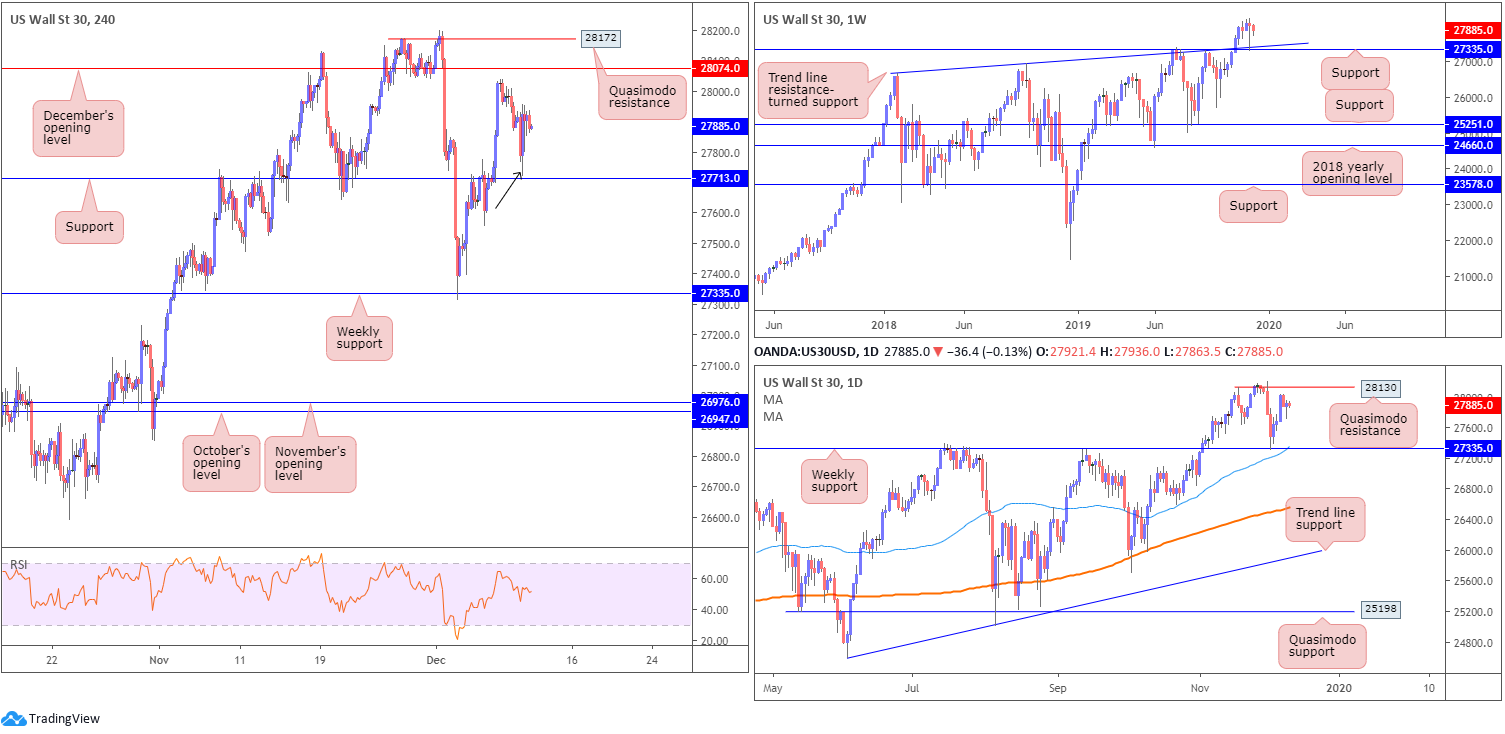
Dow Jones Industrial Average:
US stocks dipped Tuesday as a looming US/China trade deadline dampened investor sentiment. The Dow Jones Industrial Average erased 27.88 points, or 0.10%; the S&P 500 declined 3.44 points, or 0.11% and the tech-heavy Nasdaq 100 dropped 8.45 points, or 0.10%.
Technically, H4 price came within striking distance of support at 27713 Tuesday and turned higher. As you can see, this level of support has boasted reasonably significant history since the beginning of November, therefore, further buying towards December’s opening level at 28074 may come to fruition.
Tuesday’s technical briefing underlined the following regarding the current H4 support (italics):
A retest at H4 support 27713 is certainly a plausible scenario today, which if holds in the form of a H4 bullish candlestick signal, will likely entice buyers into the market. Entry/risk levels can be determined according to the candlestick’s parameters, with upside targets set at December’s opening level at 28074, daily Quasimodo resistance at 28130 and H4 Quasimodo resistance at 28172.
From the weekly timeframe, traders are left with last week’s strong hammer candlestick formation (considered a strong buy signal at troughs), formed at the retest of support drawn from 27335, along with trend line support etched from the high 26670.
Areas of consideration:
The recent H4 bullish outside candlestick formation (black arrow) may have enticed buyers into the market yesterday, given it formed just north of H4 support mentioned above at 27713. However, considering its size, risk/reward metrics are unfavourable to the first upside target: 28074. As such, should a retest of H4 support occur again today, though this time forming a smaller, more manageable, candlestick configuration, a long remains a worthy contender.
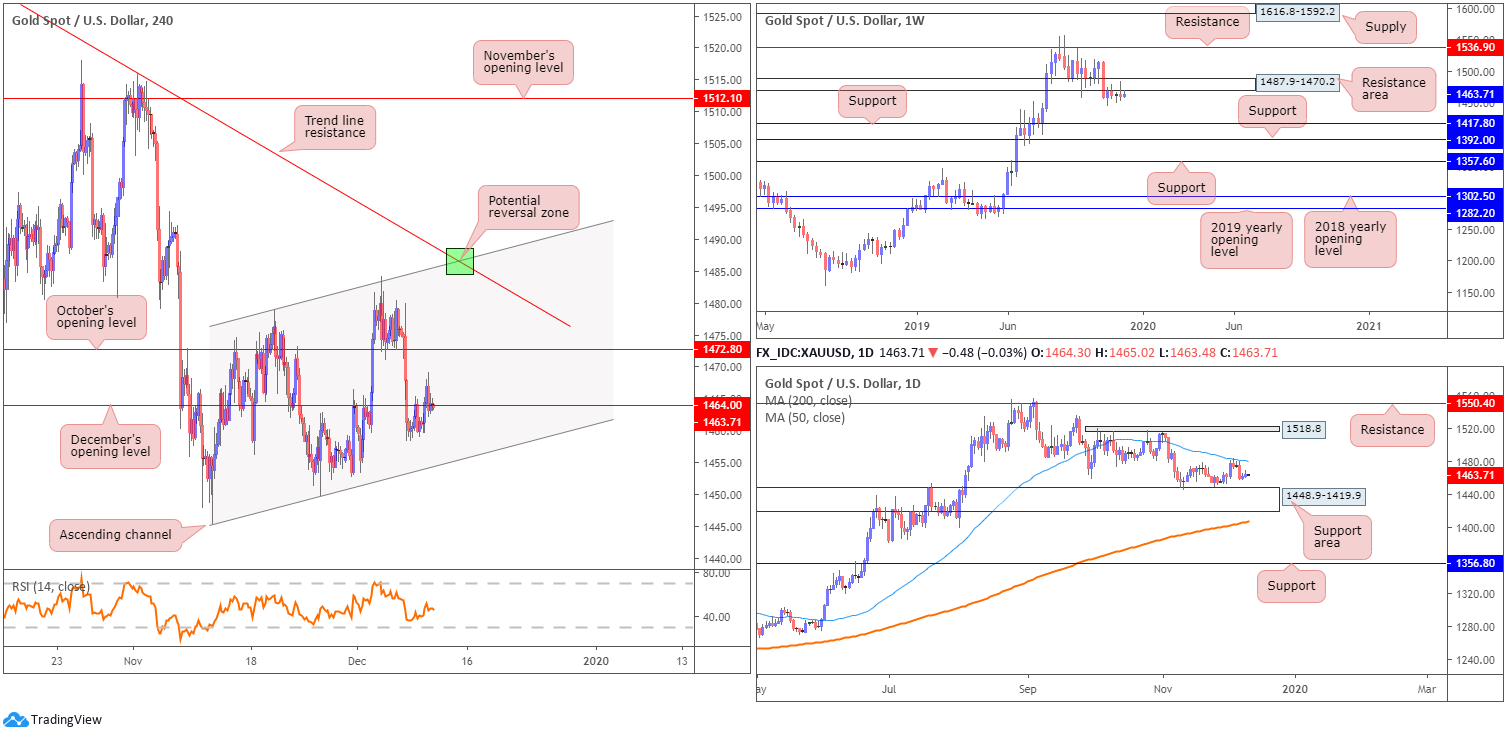
XAU/USD (GOLD):
XAU/USD spot prices remained unmoved Tuesday, ranging no more than $9.
December’s opening level on the H4 timeframe at 1464.0 gave way in recent trade, as prices tested highs of 1469.1. Directly overhead, another layer of resistance resides at 1472.8, October’s opening level, with a break of this barrier opening upside to trend line resistance, extended from the high 1557.1, which also happens to merge with channel resistance, taken from the high 1478.8.
The point both H4 trend lines merge (green) is an area active sellers may look to make an appearance, should we reach this far north.
From the weekly timeframe, price action maintains a position south of the resistance area at 1487.9-1470.2. Further rejection off the underside of this base potentially sets the long-term stage for a move towards two layers of support at 1392.0 and 1417.8, whereas a break north could approach resistance at 1536.9. Overall, the primary trend has faced a northerly trajectory since bottoming in early December 2015.
Daily movement remains beneath the 50-day SMA (blue – 1480.2), though also trades a few points north of a support area coming in at 1448.9-1419.9.
Areas of consideration:
With room to navigate lower ground on the weekly timeframe, longer-term flow may witness further downside materialise over the coming weeks. The ideal sell on the H4 timeframe, as highlighted above, rests at the point both H4 trend lines merge. This also converges closely with the 50-day SMA value.
Shorter term, nevertheless, bearish themes may still emerge from October’s opening level at 1472.8, however, support could develop off 1464.0.
The accuracy, completeness and timeliness of the information contained on this site cannot be guaranteed. IC Markets does not warranty, guarantee or make any representations, or assume any liability regarding financial results based on the use of the information in the site.
News, views, opinions, recommendations and other information obtained from sources outside of www.icmarkets.com.au, used in this site are believed to be reliable, but we cannot guarantee their accuracy or completeness. All such information is subject to change at any time without notice. IC Markets assumes no responsibility for the content of any linked site.
The fact that such links may exist does not indicate approval or endorsement of any material contained on any linked site. IC Markets is not liable for any harm caused by the transmission, through accessing the services or information on this site, of a computer virus, or other computer code or programming device that might be used to access, delete, damage, disable, disrupt or otherwise impede in any manner, the operation of the site or of any user’s software, hardware, data or property.


