
Key risk events today:
UK GDP m/m; UK Manufacturing Production m/m; BoC Monetary Policy Report, Rate Statement, Overnight Rate and Press Conference; Fed Chair Powell Testifies; MPC Member Tenreyro Speaks; FOMC Member Bullard Speaks; FOMC Meeting Minutes.
EUR/USD:
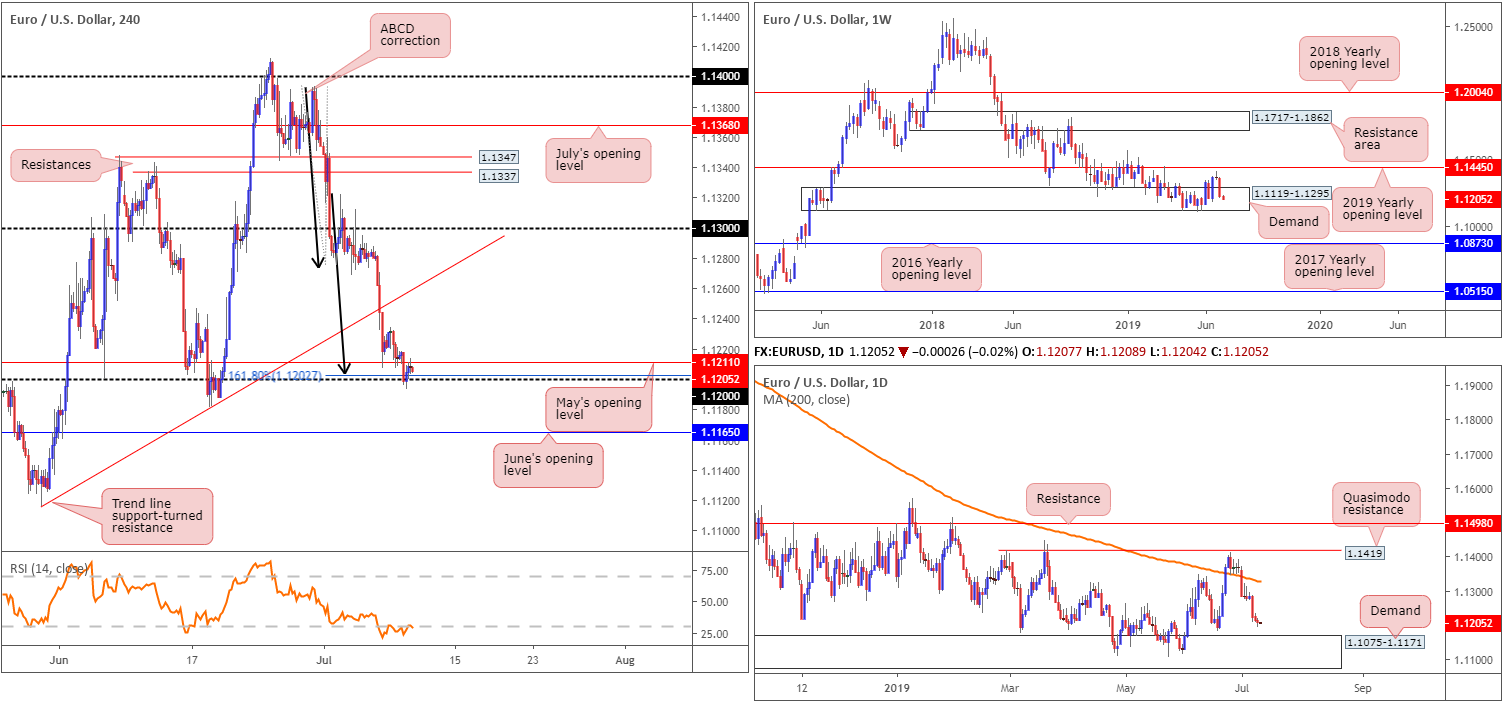
As dovish ECB chatter increased, the shared currency continued to explore lower ground against its US counterpart Tuesday, consequently registering its third consecutive daily loss. Latest moves witnessed H4 candles whipsaw through key figure 1.12 by 7 points, potentially tripping sell stops, both from buyers looking to fade the psychological barrier and sellers attempting a breakout play. Although 1.12 boasts additional support from a 161.8% ABCD (black arrows) correction at 1.1202, May’s opening level at 1.1211 now serves as resistance. As a result of this, the possibility of a move sub 1.12 has increased, with June’s opening level at 1.1165 being the next downside target on the H4 scale to have noted.
Higher-timeframe analysis reveals weekly players continue to chew through buyers within a long-standing demand area at 1.1119-1.1295. A break of this zone has the 2016 yearly opening level at 1.0873 (support) in sight. A closer reading of daily movement, nonetheless, shows room to press as far south as notable demand at 1.1075-1.1171, formed on May 17, 2017. Note this area is glued to the underside of weekly demand mentioned above at 1.1119-1.1295.
Areas of consideration:
The possibility of additional buying out of 1.12 is still present, though not until May’s opening level at 1.1211 is engulfed. Traders still interested in 1.12 as support, therefore, are best to wait for a H4 close to form above 1.1211 (preferably along with a successful retest motion) to form before considering longs, targeting H4 trend line support-turned resistance extended from the low 1.1116.
Traders are also encouraged to keep June’s opening level in mind at 1.1162 for a possible bounce, given its association with the top edge of daily demand at 1.1171, should we reach this far south.
GBP/USD:
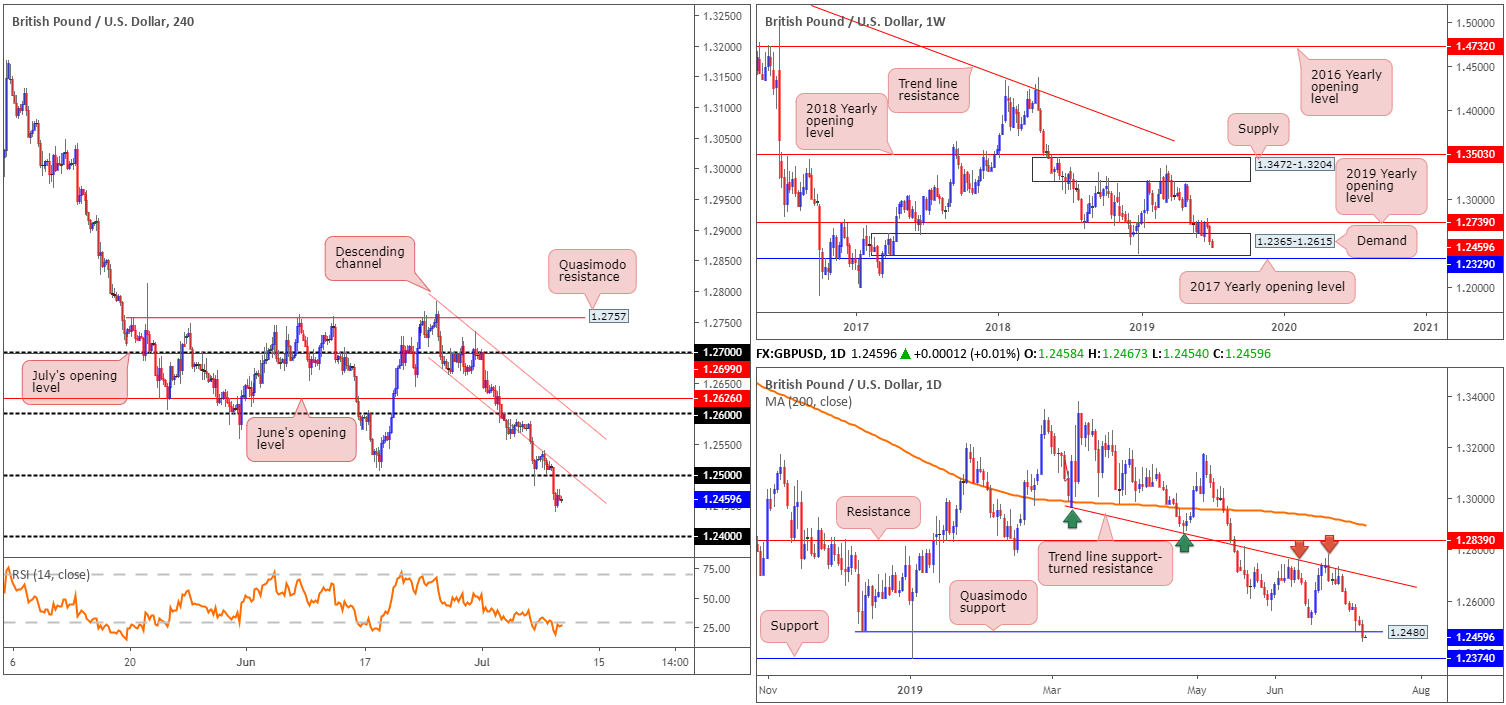
No-deal Brexit fears and dovish BoE expectations continued to weigh on the British pound Tuesday, down 0.41% vs. the dollar. Sterling was also weaker on the back of the House Speaker not selecting an amendment that would put a hurdle in the way of a no-deal Brexit and BRC data continuing to show challenges the UK economy faces in Q2.
Downside movement increased amid early Europe after clipping beneath 1.25 as sell stops triggered further selling. As can be seen from the H4 timeframe this morning, this has exposed 1.24 as the next viable floor in this market, though a retest at the underside of 1.25 is also a possibility, seeing as it aligns closely with channel support-turned resistance extended from the low 1.2662.
From the weekly timeframe, sellers continue to drive deeper into the walls of long-standing demand at 1.2365-1.2615, which could eventually lead to a break south towards the 2017 yearly opening level at 1.2329 (support). Daily action, on the other hand, crossed beneath Quasimodo support at 1.2480 yesterday, highlighting the possibility of a run to daily support at 1.2374.
Areas of consideration:
Keeping it simple this morning, the research team notes the underside of 1.25 offers a stable platform for sellers today, targeting 1.24 as the initial take-profit zone. Not only does 1.25 merge closely with H4 channel support-turned resistance, it boasts additional resistance from 1.2480 on the daily timeframe: the daily Quasimodo support which is now likely to act as resistance. As round numbers are prone to fakeouts, traders are encouraged to wait for additional candlestick confirmation before pulling the trigger. Not only will this help identify seller intent, it’ll also provide entry and risk levels to work with.
AUD/USD:
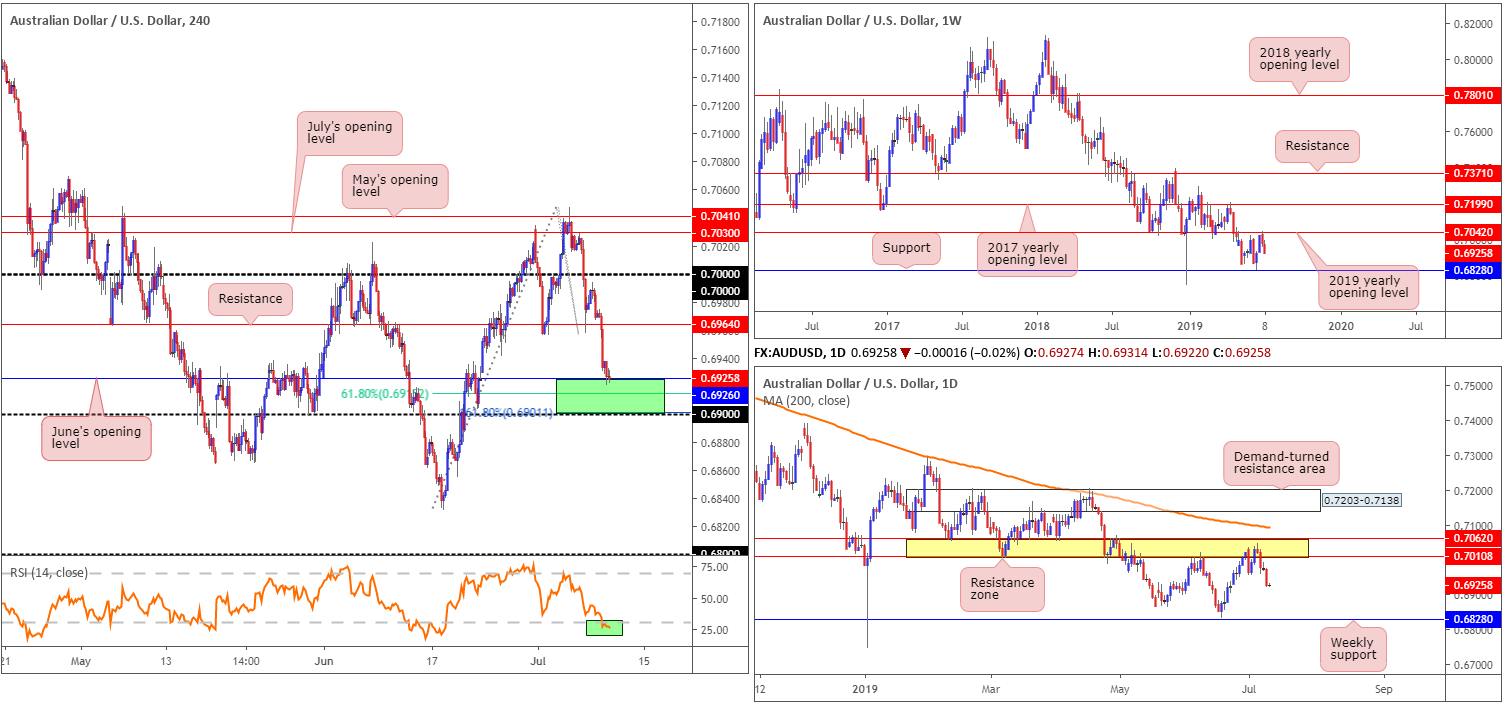
The Australian dollar came under pressure against the US dollar in the early hours of Asia Tuesday after the National Australia Bank’s business confidence dropped to 2 in June from 7 in May. Further downside was observed amid Europe, partially on the back of USD bidding, consequently drawing the H4 candles towards June’s opening level at 0.6926 in US trade.
With June’s opening level currently offering support on the H4 timeframe, traders may also wish to acknowledge nearby support lurking at a 61.8% Fibonacci retracement value drawn from 0.6915. In addition to this, we also have the 0.69 handle close by which merges with a 161.8% Fibonacci ext. at 0.6901.
In light of where the market stands on the higher timeframes, further downside is possible this week.
From the weekly timeframe, Monday’s weekly report had the following to say:
Breaking a two-week bullish phase, of which involved a strong full-bodied bullish candle, price action tested the 2019 yearly opening level at 0.7042 (resistance) and rotated lower last week. Technically speaking, a response from 0.7042 is not surprising, having seen it serve well as support on a number of occasions in the past. Continued selling from this point has support coming in at 0.6828 in sight.
In conjunction with weekly structure, daily flow also stresses a bearish tone at the moment:
A closer reading of price action on the daily timeframe reveals two layers of resistance at 0.7062/0.7010, collectively forming a robust resistance zone (yellow). Assuming sellers remain in the driving seat, the next downside target on the daily timeframe can also be seen around the weekly support mentioned above at 0.6828.
Areas of consideration:
The area shaded in green on the H4 timeframe between 0.69 and 0.6926 offers short-term support, confirmed by the H4 RSI testing oversold waters. However, deciphering how much ‘oomph’ this area holds is difficult, knowing both weekly and daily timeframes suggest further selling. In situations such as these, the safest route for buyers on the H4 timeframe is to wait and see how H4 action behaves. Should a bullish candlestick form within the said H4 green zone, this could be a sufficient signal for a short-term bounce to H4 resistance at 0.6964, though expecting much more than this is chancy, given higher-timeframe flow.
If further downside is seen today and we cross beneath 0.69, selling this market to weekly support at 0.6828 may be the way forward. Traders can either sell the breakout candle and position protective stop-loss orders above the upper shadow, or wait and see if a retest at 0.69 forms, preferably by way of a H4 bearish candlestick configuration (entry and risk can be determined according to this structure).
USD/JPY:
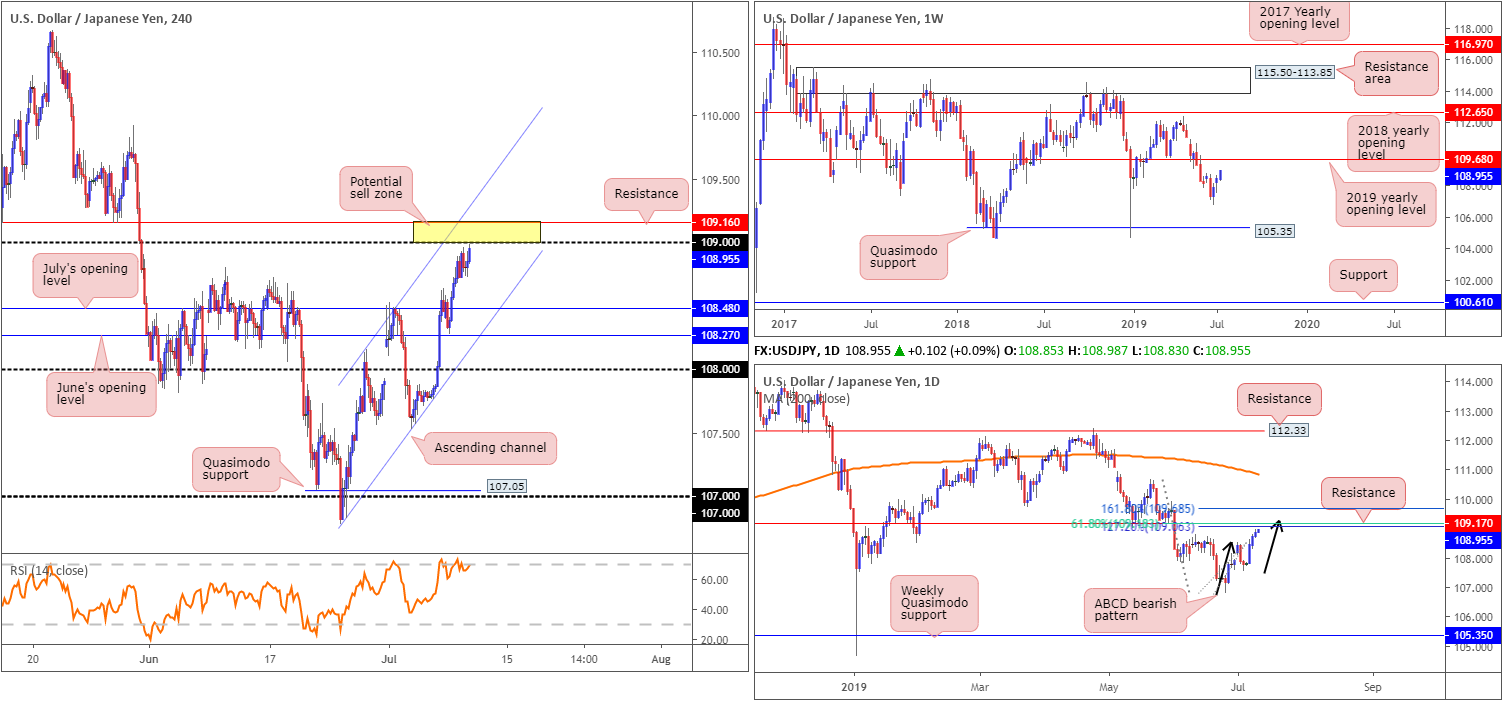
Coming in from the top this morning, traders can see weekly price poised to approach resistance at 109.68 by way of the 2019 yearly opening level. Note yearly opening levels tend to offer a bounce at the very least.
Before reaching 109.68, however, technical studies on the daily timeframe shows potential resistance around 109.17. What gives this level extra credibility is the merging ABCD bearish pattern (black arrows) at 109.30, the 127.2% Fibonacci ext. at 109.06 and a 61.8% Fibonacci retracement value at 109.18. For traders searching for a medium-term move short this week, this area may be an option with protective stop-loss orders positioned above the 161.8% Fibonacci ext. point at 109.68 (essentially denoting the 2019 yearly opening level on the weekly timeframe).
Closer analysis of price action on the H4 timeframe has the candles treading water just south of the 109 handle, which happens to align closely with resistance at 109.16 and a nearby channel resistance taken from the high 108.13.
Areas of consideration:
Representing a similar outlook to Tuesday’s briefing, the research team notes potential resistance emerging from the 109 handle today. This level, alongside H4 channel resistance taken from the high 108.13, H4 resistance at 109.16 (yellow) and daily resistance at 109.17 as well as its associated Fibonacci resistances, offers a reasonably well-defined base for selling opportunities.
H4 traders looking to sell 109.16/109 may want to consider placing stop-loss orders above the noted H4 channel resistance, whereas daily traders eyeing 109.68/109.06, as already underlined above, might opt for larger stop-loss placement above 109.68.
USD/CAD:
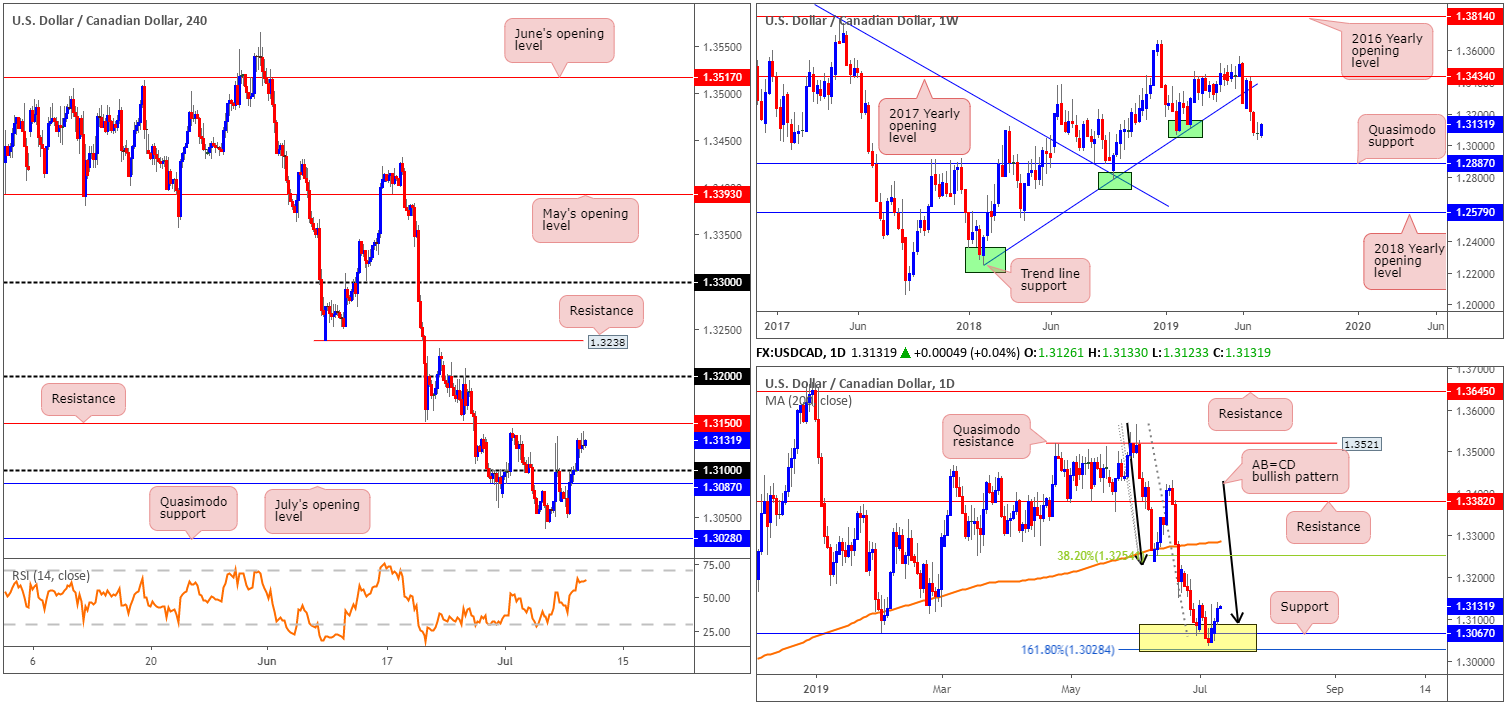
Bolstered by broad-based USD strength, the USD/CAD carved out its third consecutive daily gain Tuesday, up 0.23%. Technically, this lifted the pair beyond 1.31 to a few points south of H4 resistance at 1.3150. This was a noted move to watch for in Tuesday’s briefing:
Buying from the current daily support area (see below) is an option today, though waiting for the H4 candles to close above 1.31 and retest the level as support, preferably in the form of a bullish candlestick configuration as this sets a foundation to allocate entry and risk levels, is likely the safer route to longs in this market. This would likely unlock the door towards H4 resistance at 1.3150 as an initial take-profit zone on the H4 timeframe, though according to daily structure, specifically the AB=CD formation, the next upside target can be seen around the 38.2% Fibonacci resistance at 1.3254.
Why the research team favoured the daily support area between 1.3028/1.3089 (yellow) is due to it being formed by an AB=CD (black arrows) formation at 1.3089, a support at 1.3067 and a 161.8% Fibonacci extension at 1.3028 (forms part of the AB=CD structure).
Traders may have also noticed upon breaking 1.31 to the upside, the H1 candles retested the number as support and eventually formed a bullish inside candlestick signal. Well done to any of our readers who managed to jump aboard yesterday’s move.
Areas of consideration:
While further buying to at least the H4 resistance at 1.3150 is a strong possibility today, further upside to the 38.2% Fibonacci resistance at 1.3254 on the daily timeframe is a challenge due to weekly price action:
Following two consecutive weeks of selling, shaped by near-full-bodied bearish candles, price action paused last week by way of an indecision candle. Despite the interruption, limited support is evident on the weekly timeframe until reaching as far south as a Quasimodo formation at 1.2887.
As such, traders long the USD/CAD above 1.31 may want to consider reducing risk to breakeven once/if H4 resistance at 1.3150 enters the mix and liquidating a portion of the position.
USD/CHF:
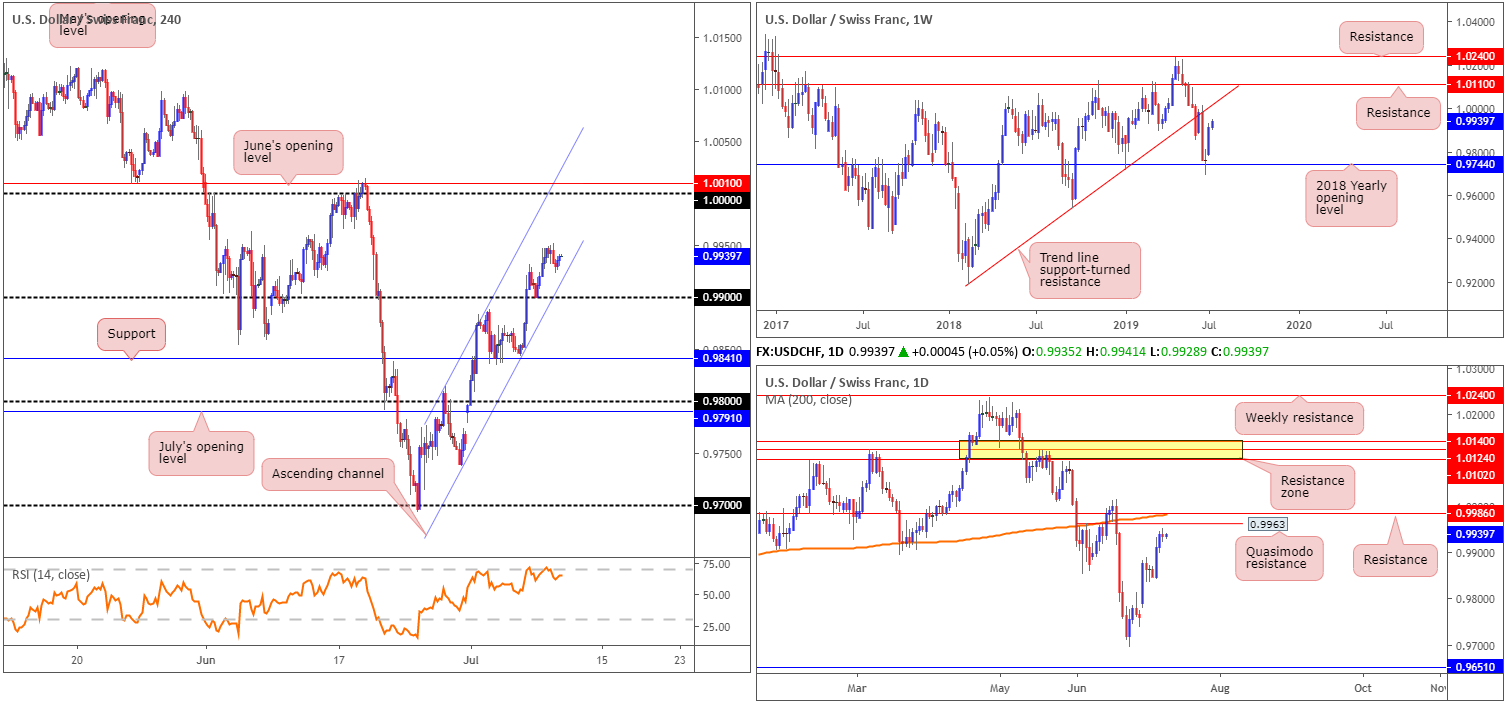
Despite the US dollar index exploring higher terrain Tuesday, albeit marginally, the USD/CHF retreated around 20-points from near three-week tops at 0.9951. On the whole, though, price action concluded the session unchanged, forming a clear-cut indecision candlestick on the daily timeframe.
Room seen to move higher on all three timeframes this week (see below) opened up a potential buying opportunity on the retest of 0.99 as support. The retest of this psychological barrier has 0.9963 to target as the initial take-profit zone (daily resistance).
Well done to any of our readers who managed to long 0.99 and remain in the position.
On to the higher timeframes, Monday’s report had the following to say:
Following a period of indecision off the 2018 yearly opening level at 0.9744, the US dollar turned higher against the safe-haven Swiss franc last week. Further upside, according to technical studies on the weekly timeframe, is a possibility this week, targeting trend line support-turned resistance extended from the low 0.9187.
In terms of where the market stands on the daily timeframe in regard to upside targets, Quasimodo resistance at 0.9963 is in the firing range, closely shadowed by the 200-day SMA and another layer of resistance at 0.9986. It might also be worth noting this area of daily resistance is situated south of the weekly trend line resistance by about 30 points.
Areas of consideration:
Traders still long from 0.99, the initial upside target remains at daily resistance drawn from 0.9963.
Owing to price recently extending higher:
Selling opportunities within 1.0010/0.9963, although a reasonably wide zone, is a possibility today, owing to it holding a number of notable resistance structures:
- Daily Quasimodo resistance at 0.9963.
- The 200-day SMA around 0.9986.
- Daily resistance at 0.9986.
- 0000 (parity) sited on the H4 timeframe.
- June’s opening level at 1.0010 also on the H4 timeframe.
- H4 channel resistance etched from the high 0.9814.
Dow Jones Industrial Average:
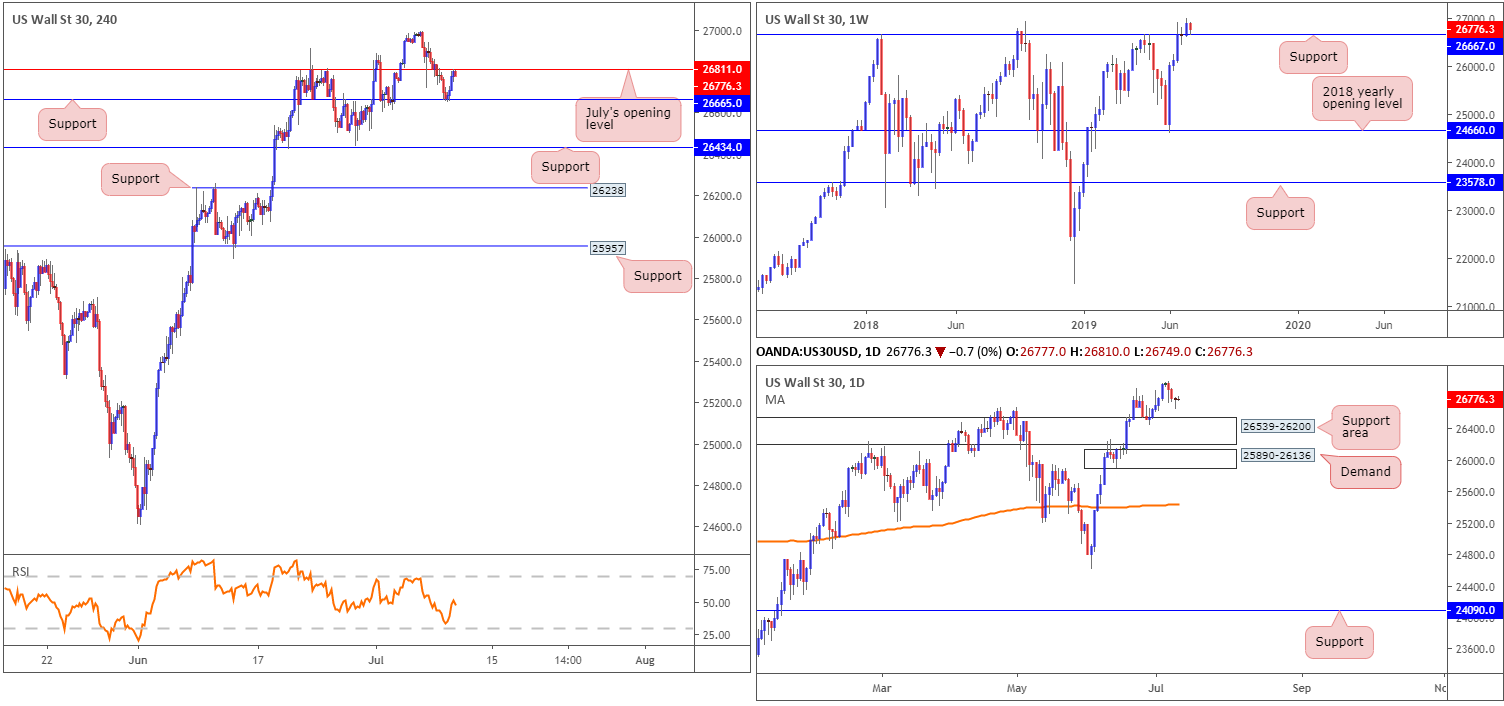
US equities concluded Tuesday’s session mixed, a day ahead of congressional testimony by Federal Reserve Chairman Jerome Powell. The Dow Jones Industrial Average lost 0.08%, while the S&P 500 added 0.12% alongside the tech-heavy Nasdaq 100 rallying 0.53%.
From a technical standpoint, weekly flow remains buoyed by support at 26667. Continued buying from this angle could witness the index approach fresh all-time highs this week. Supporting the current weekly support is daily price recently chalking up a hammer candlestick formation yesterday. The concern, however, is daily price shows room to press lower towards a support area at 26539-26200.
Examining the market’s action on the H4 timeframe, we can see the unit rebounded from support at 26665 Tuesday, though is now facing potential resistance drawn from July’s opening level at 26811. In the event we climb above this barrier today, this could suggest a possible attempt at the all-time high 26995.
Areas of consideration:
With the index strongly entrenched within an uptrend at present, buying this market seems a reasonable approach. Following a H4 close forming above July’s opening level at 26811, the unit will be free to explore higher ground, according to the technical studies presented. A successful retest at 26811 as support, of course, would be even better, allowing traders to base entry and risk levels on the rejecting candlestick’s structure. The first upside target from here is set around the all-time high 26995, with the expectation of eventually breaking beyond this point to virgin territory.
XAU/USD (GOLD):
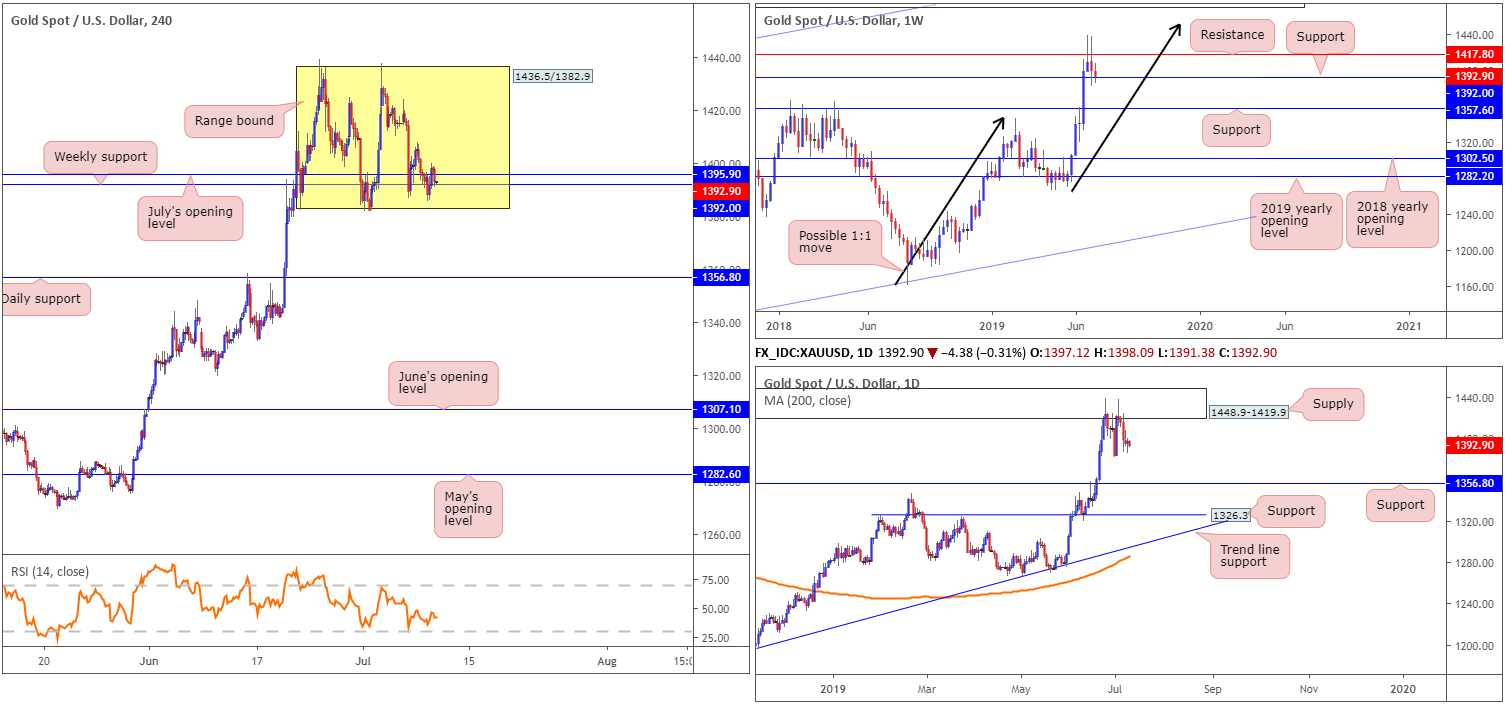
Kicking things off from the weekly timeframe this morning, traders will see the current candle touching gloves with support at 1392.0, after failing to sustain gains above resistance at 1417.8. In the event price action pulls beneath 1392.0, support at 1357.6 is next in the firing range.
The story on the daily timeframe has the candles testing the lower edge of a supply zone at 1448.9-1419.9. Note the weekly resistance level at 1417.8 resides just beneath the said supply zone. Further downside from here has the support level at 1356.8 to target, a touch lower than weekly support at 1357.6.
Since June 24, the H4 candles have been busy carving out a consolidation zone between 1436.5/1382.9, with weekly support highlighted above at 1392.0 bolstering the lower edge of the region. With limited movement seen this week thus far, price action remains lurking around the lower edge of the said range.
Areas of consideration:
Technically, the yellow metal remains entrenched within a strong uptrend at the moment. Structurally, weekly price is seen testing support at 1392.0. Daily price, however, shows room to move lower from supply at 1448.9-1419.9 until reaching support at 1356.8, and the H4 candles are teasing the lower edge of its respective range.
On account of the above, traders may witness a short-term run higher within the H4 range, though weekly resistance at 1417.8 and also the underside of daily supply at 1419.9 could hamper a test of its upside limit.
Unless you’re comfortable buying with weekly resistance set close by at 1417.8, opting to remain on the sidelines may be the better path to take right now.
The accuracy, completeness and timeliness of the information contained on this site cannot be guaranteed. IC Markets does not warranty, guarantee or make any representations, or assume any liability with regard to financial results based on the use of the information in the site.
News, views, opinions, recommendations and other information obtained from sources outside of www.icmarkets.com.au, used in this site are believed to be reliable, but we cannot guarantee their accuracy or completeness. All such information is subject to change at any time without notice. IC Markets assumes no responsibility for the content of any linked site.
The fact that such links may exist does not indicate approval or endorsement of any material contained on any linked site. IC Markets is not liable for any harm caused by the transmission, through accessing the services or information on this site, of a computer virus, or other computer code or programming device that might be used to access, delete, damage, disable, disrupt or otherwise impede in any manner, the operation of the site or of any user’s software, hardware, data or property.


