
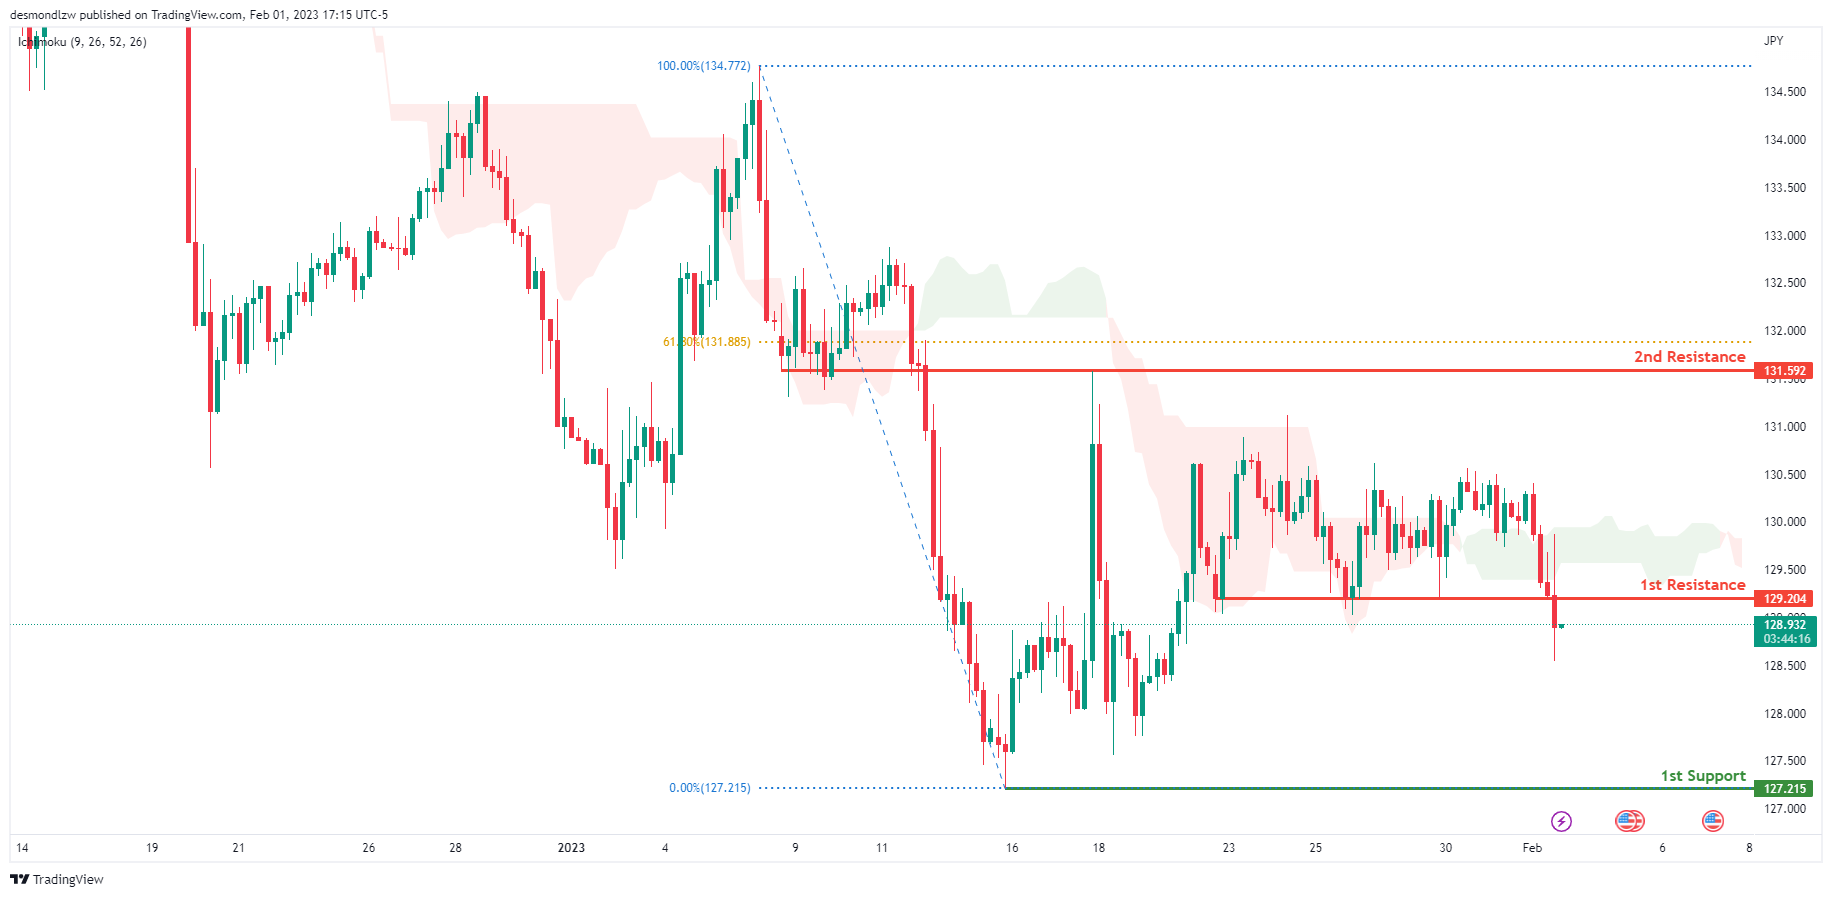
USD/JPY:
Looking at the H4 chart, my overall bias for USDJPY is bearish due to the current price crossing below the Ichimoku cloud, indicating a bearish market. If this bearish momentum continues, expect the price to possibly continue heading towards the 1st support at 127.215, where the previous swing low is. In an alternate scenario, price could possibly head back down to retest the 1st resistance at 129.204, where the overlap resistance is.
Areas of consideration:
- H4 time frame, 1st resistance at 129.204
- H4 time frame, 1st support at 127.215
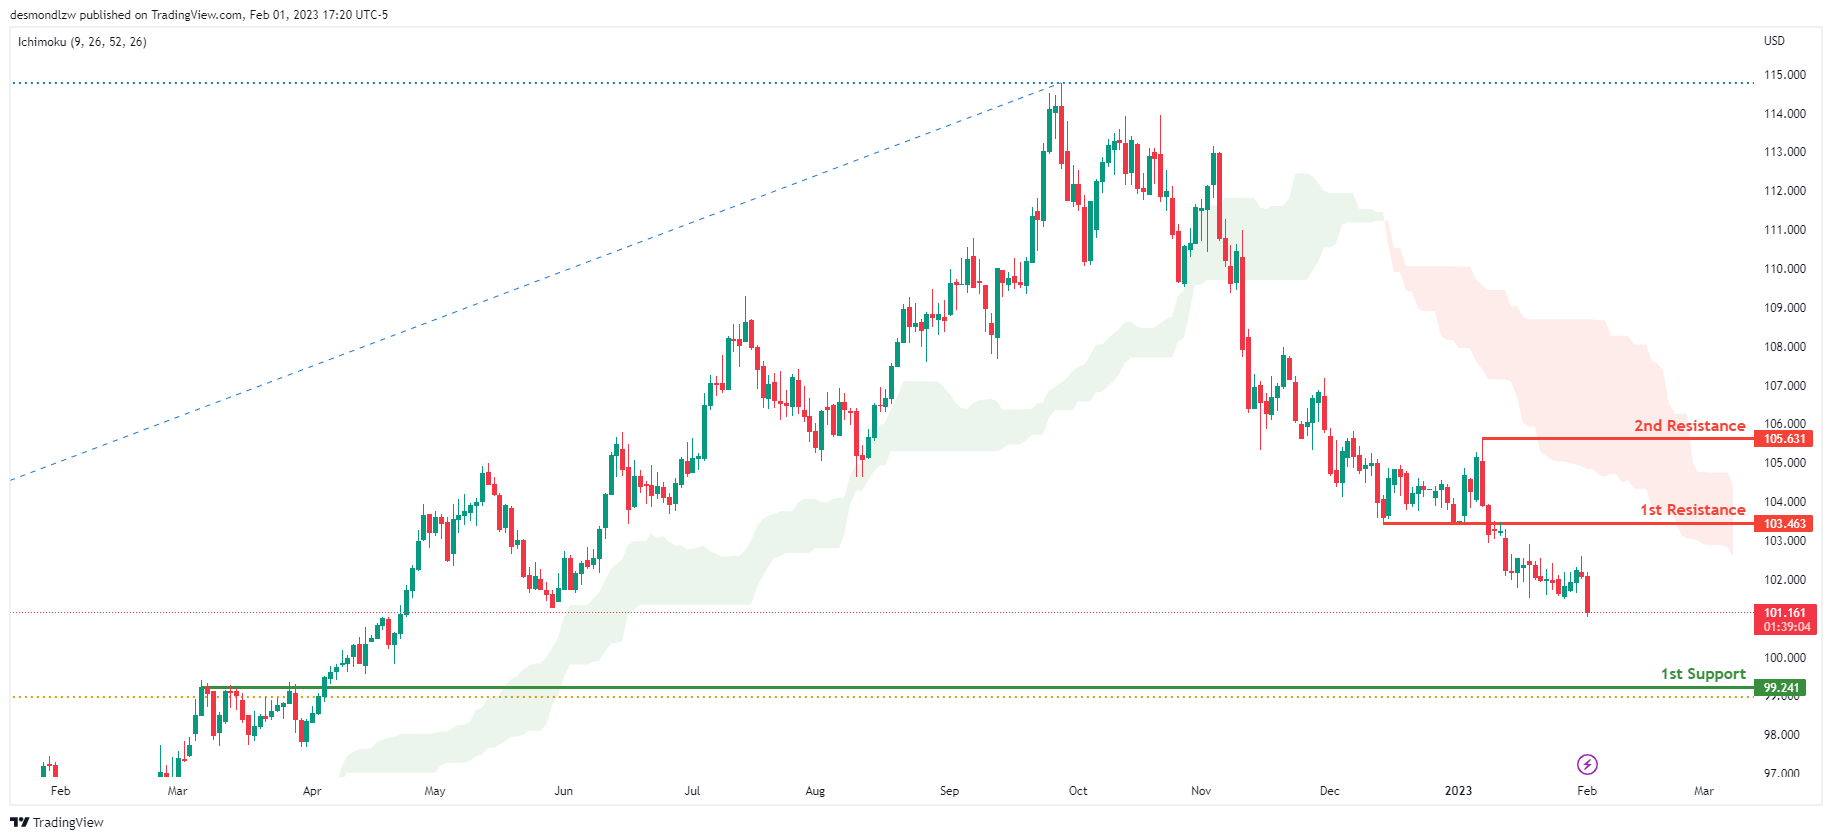
DXY:
Looking at the Daily chart, my overall bias for DXY is bearish due to the current price crossing below the Ichimoku cloud, indicating a bearish market. If this bearish momentum continues, expect the price to possibly continue heading towards the 1st support at 99.241, where the 61.8% Fibonacci line and overlap support is. In an alternative scenario, price could head back up to retest the 1st resistance at 103.463, where the overlap resistance and 50% Fibonacci line is.
Areas of consideration:
- H4 time frame, 1st resistance at 103.463
- H4 time frame, 1st support at 99.241
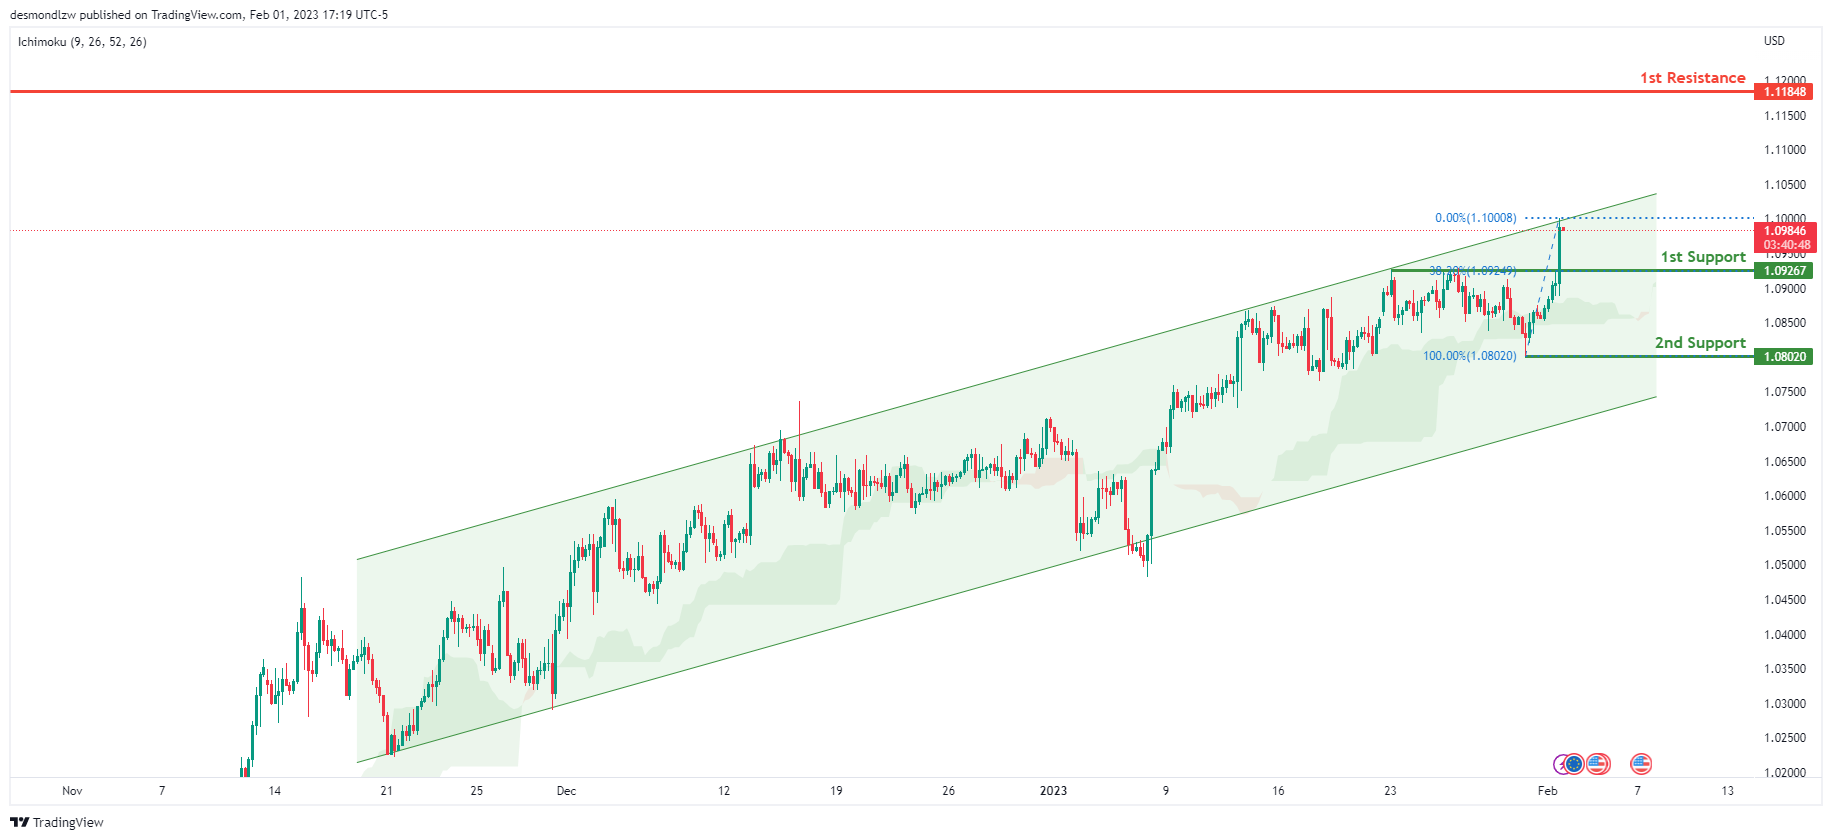
EUR/USD:
Looking at the H4 chart, my overall bias for EURUSD is bullish due to the current price crossing above the Ichimoku cloud, indicating a bullish market structure. To add confluence to this bias, price is also within an ascending channel. If this bullish momentum continues, expect the price to possibly continue heading towards the 1st resistance at 1.11848, where the previous swing high is. In an alternate scenario, price could possibly head back down to retest the 1st support level at 1.09267, where the 38.2% Fibonacci line is.
Areas of consideration :
- H4 1st resistance at 1.11848
- H4 1st support at 1.09267
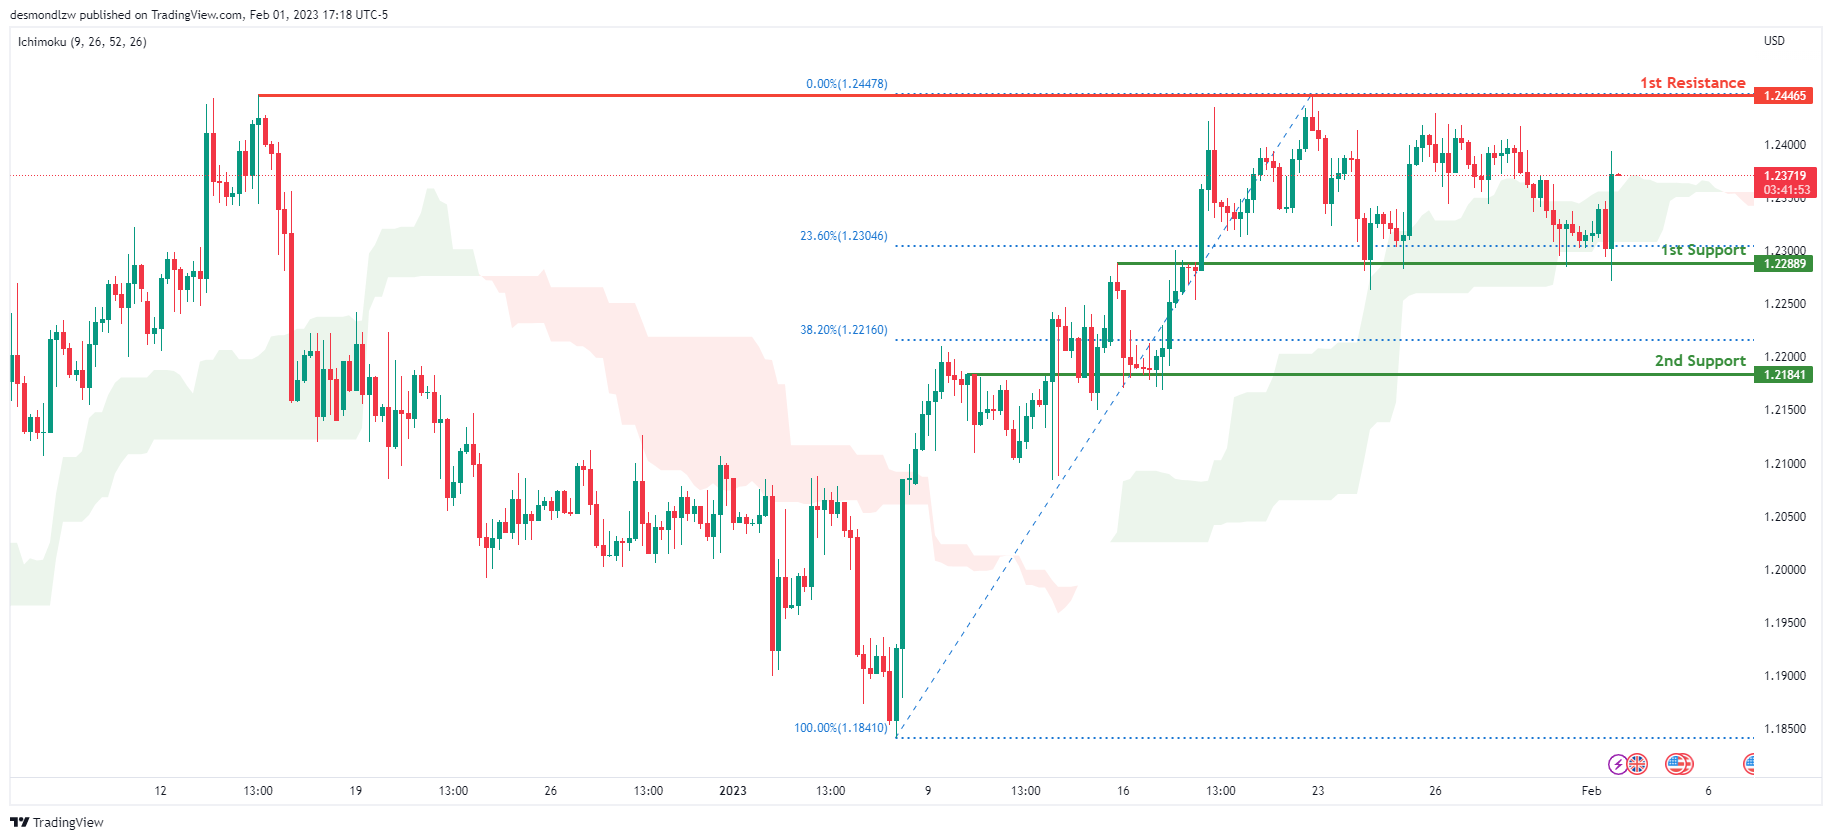
GBP/USD:
Looking at the H4 chart, my overall bias for GBPUSD is bullish due to the current price crossing above the Ichimoku cloud, indicating a bullish market. If this bullish momentum continues, expect the price to possibly continue to head back up towards the 1st resistance line at 1.24465, where the previous swing high is. In an alternate scenario, price could break the 1st support at 1.22889, where the 23.6% Fibonacci line is, before heading towards the 2nd support at 1.21841, where the overlap support and 38.2% Fibonacci line is.
Areas of consideration:
- H4 1st resistance at 1.24465
- H4 1st support at 1.22889
- H4 2nd support at 1.21841
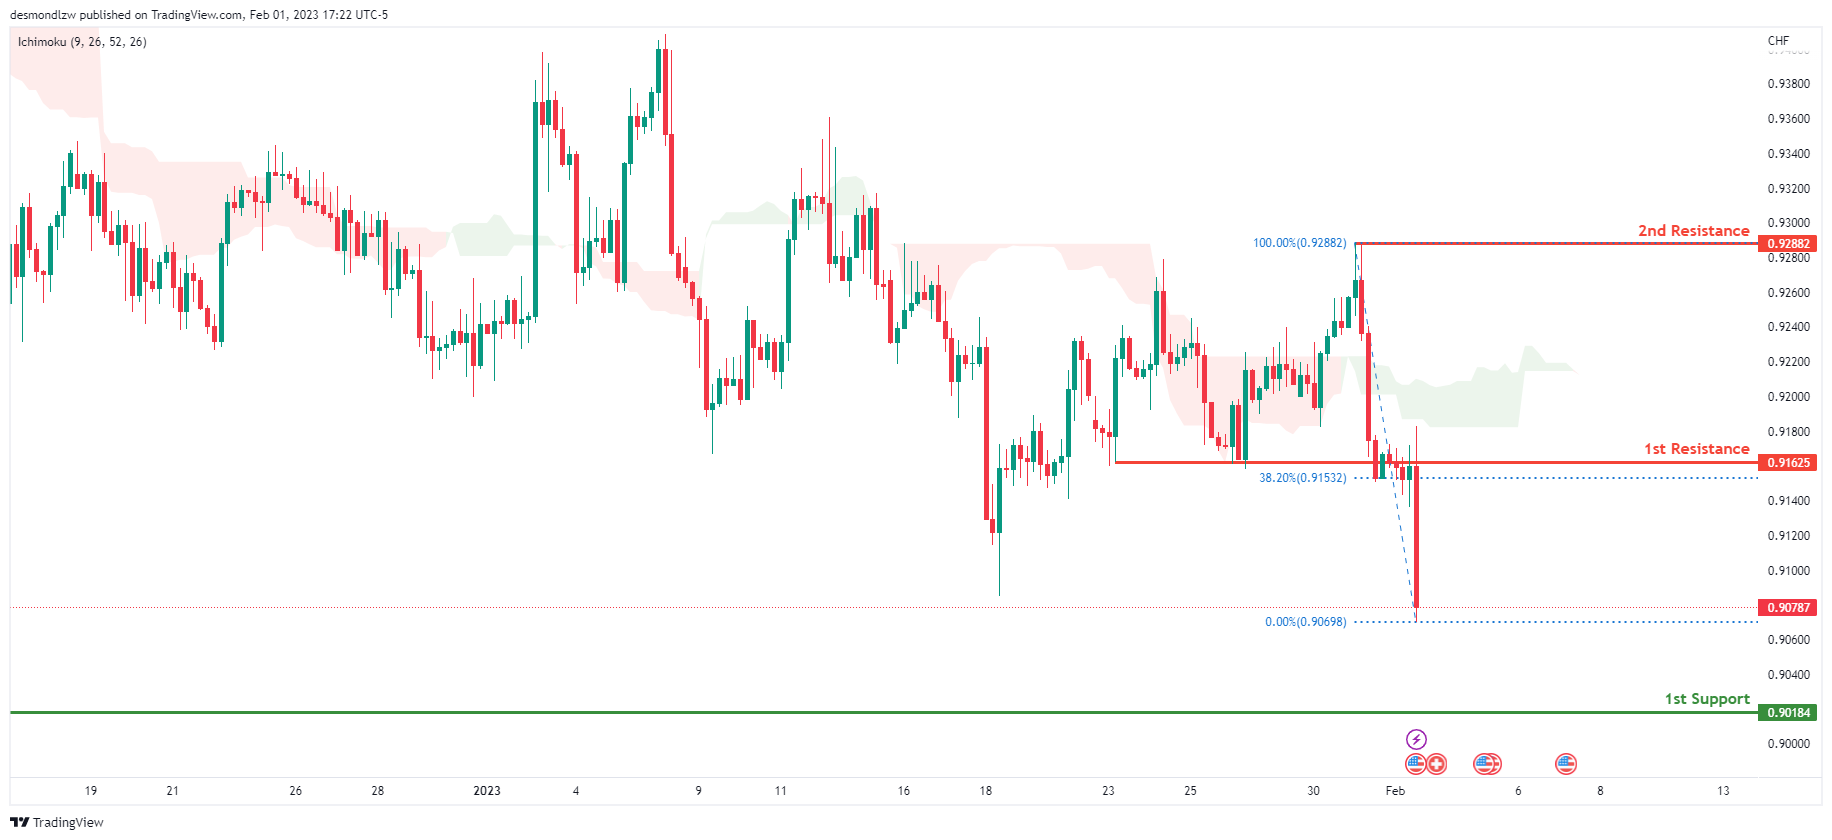
USD/CHF:
Looking at the H4 chart, my overall bias for USDCHF is bearish due to the current price being below the Ichimoku cloud, indicating a bearish market. If the current bearish trend continues, expect the price to possibly continue to head towards the 1st support at 0.90184, where the previous swing low is. In an alternative scenario, price could possibly head back up to retest the 1st resistance at 0.91625, where the 38.2% Fibonacci line is.
Areas of consideration
- H4 1st support at 0.90184
- H4 1st resistance at 0.91625
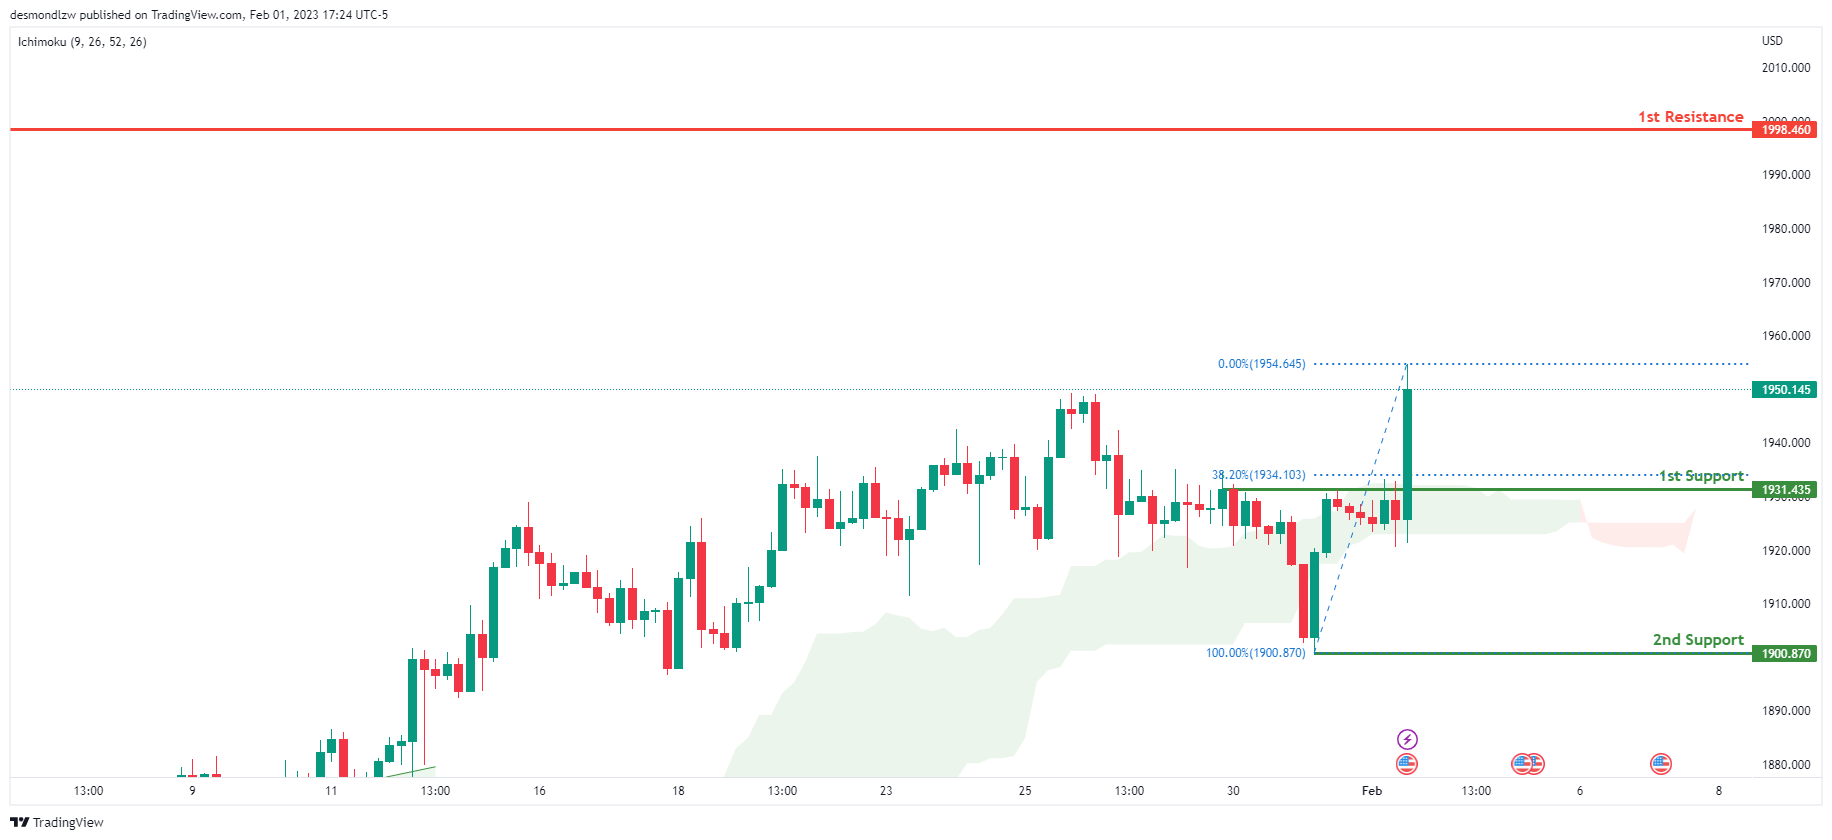
XAU/USD (GOLD):
Looking at the H4 chart, my overall bias for XAUUSD is bullish due to the current price crossing above the Ichimoku cloud, indicating a bullish market. If this bullish momentum continues, expect the price to possibly continue heading towards the 1st resistance at 1998.460, where the previous swing high is. In an alternative scenario, price could possibly head back down to retest the 1st support at 1931.435 where the 38.2% Fibonacci line is.
Areas of consideration:
- H4 time frame, 1st resistance at 1998.460
- H4 time frame, 1st support at 1931.435
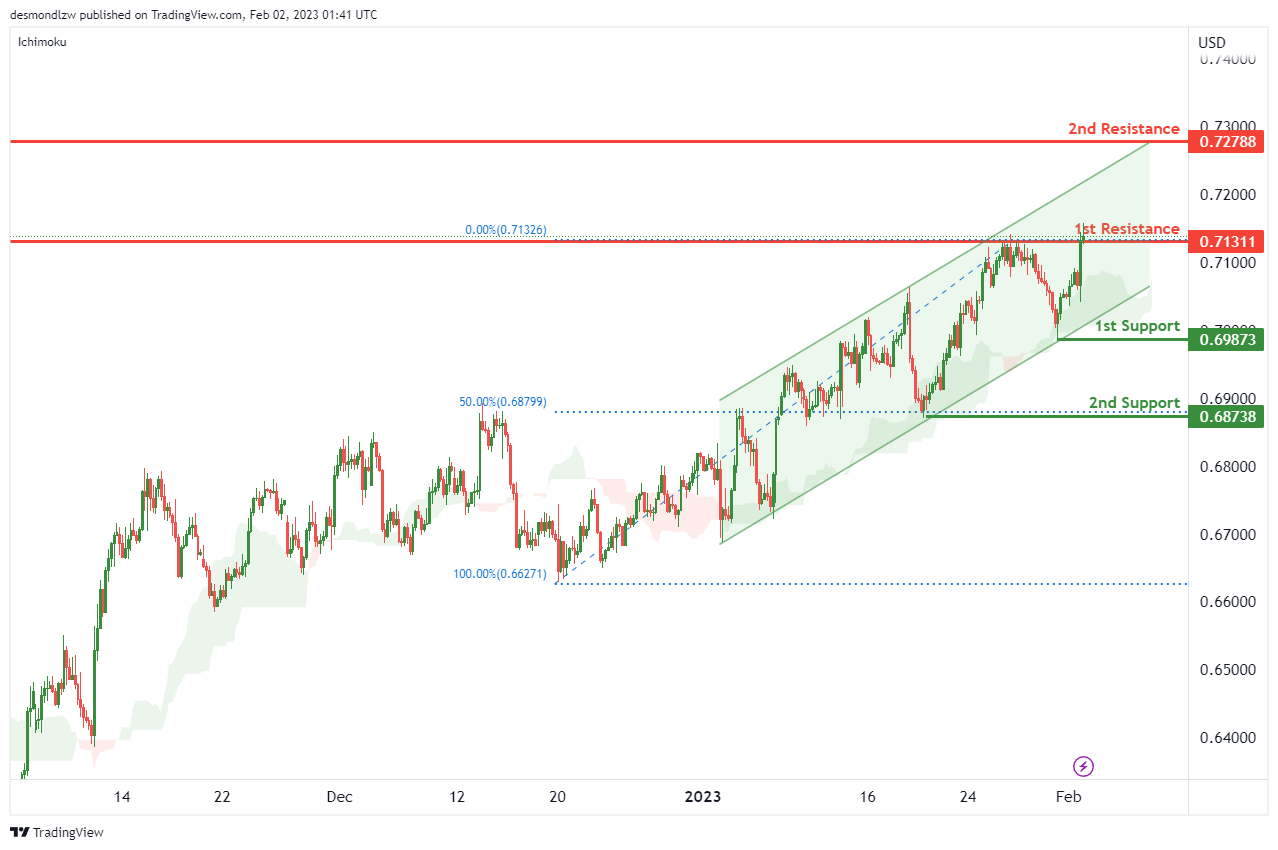
AUD/USD:
Looking at the H4 chart, my overall bias for AUDUSD is bullish due to the current price being above the Ichimoku cloud. There is an ascending channel which adds confluence to my bias.
If this momentum continues, as the current price had been broke the 1st resistance at 0.71311, expect the price to head towards the 2nd resistance level at 0.72788 which is the previous swing high.
In an alternate scenario, the price could possibly go back up towards the 1st support level at 0.69873 which is the recent swing low, before it heading down to the 2nd support at 0.68738 which is line with the 50% Fibonacci line.
Areas of consideration
- H4. 2nd resistance at 0.72788
- H4. 1st resistance at 0.71311
- H4, 1st support at 0.69873
- H4, 2nd support at 0.68738
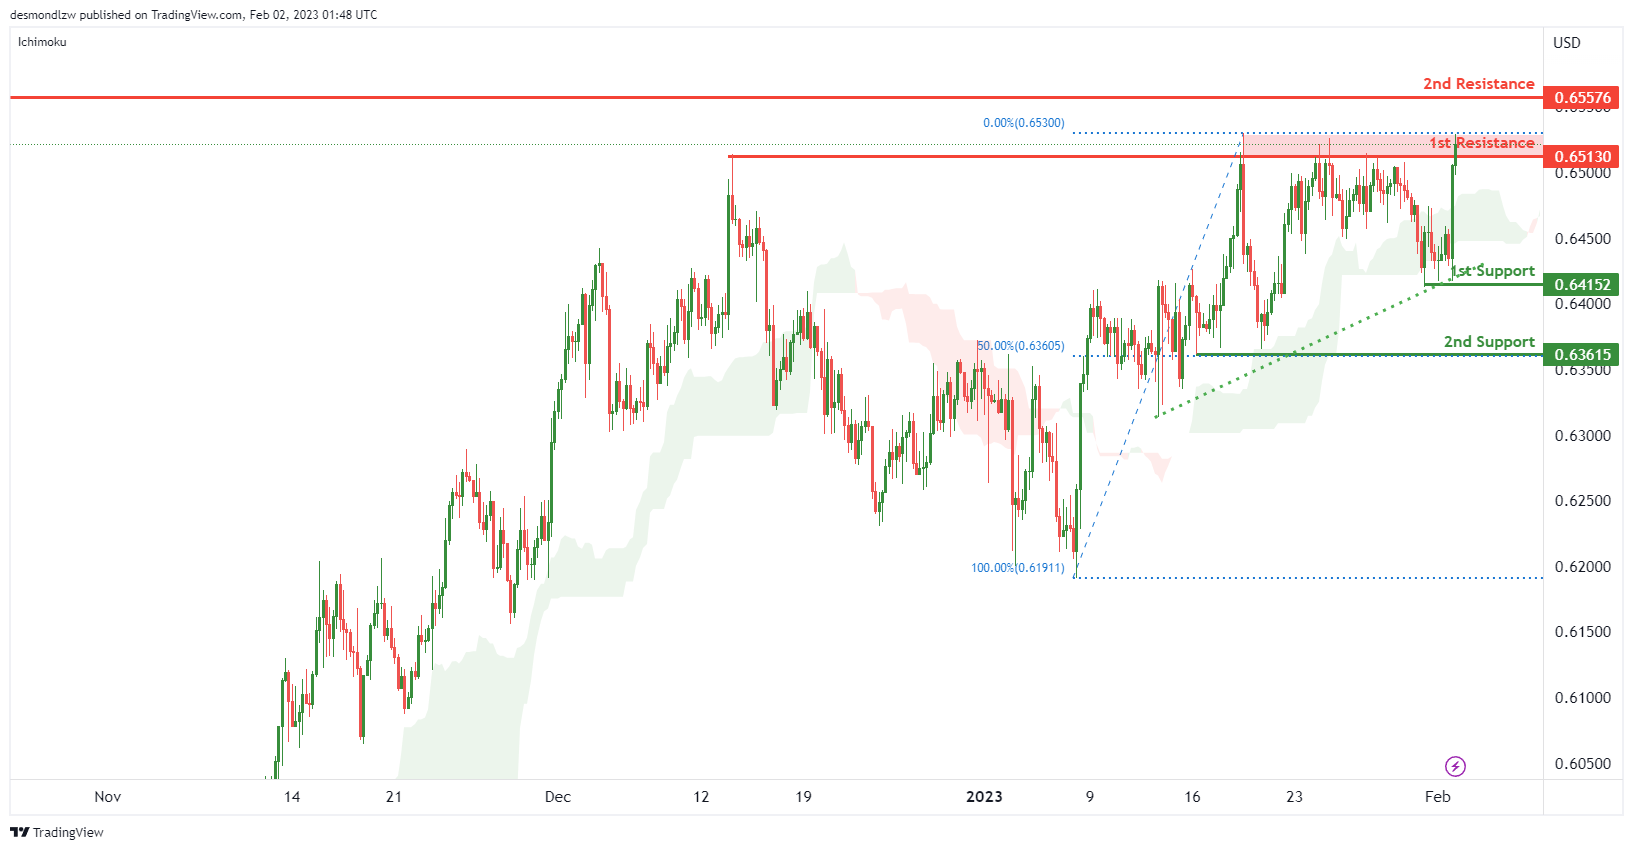
NZD/USD:
Looking at the H4 chart, my overall bias for NZDUSD isbullish . As the current price is above the Ichimoku cloud, and ascending trendline adds on confluence to my bias. Expecting the price is break through the 1st resistance zone at 0.65130 before heading toward the 2nd resistance level at 0.65576 which is the previous swing high.
In an alternate scenario, price could possibly head back toward the 1st support level at 0.64152. Once the it breaks 1st support level, the price is down to the 2nd support level at 0.63615 which is in line with 50% Fibonacci retracement.
Areas of consideration:
- H4 time frame, 2nd resistance at 0.65576
- H4 time frame, 1st resistance at 0.65130
- H4 time frame, 1st support at 0.64152
- H4 time frame, 1st support at 0.63615
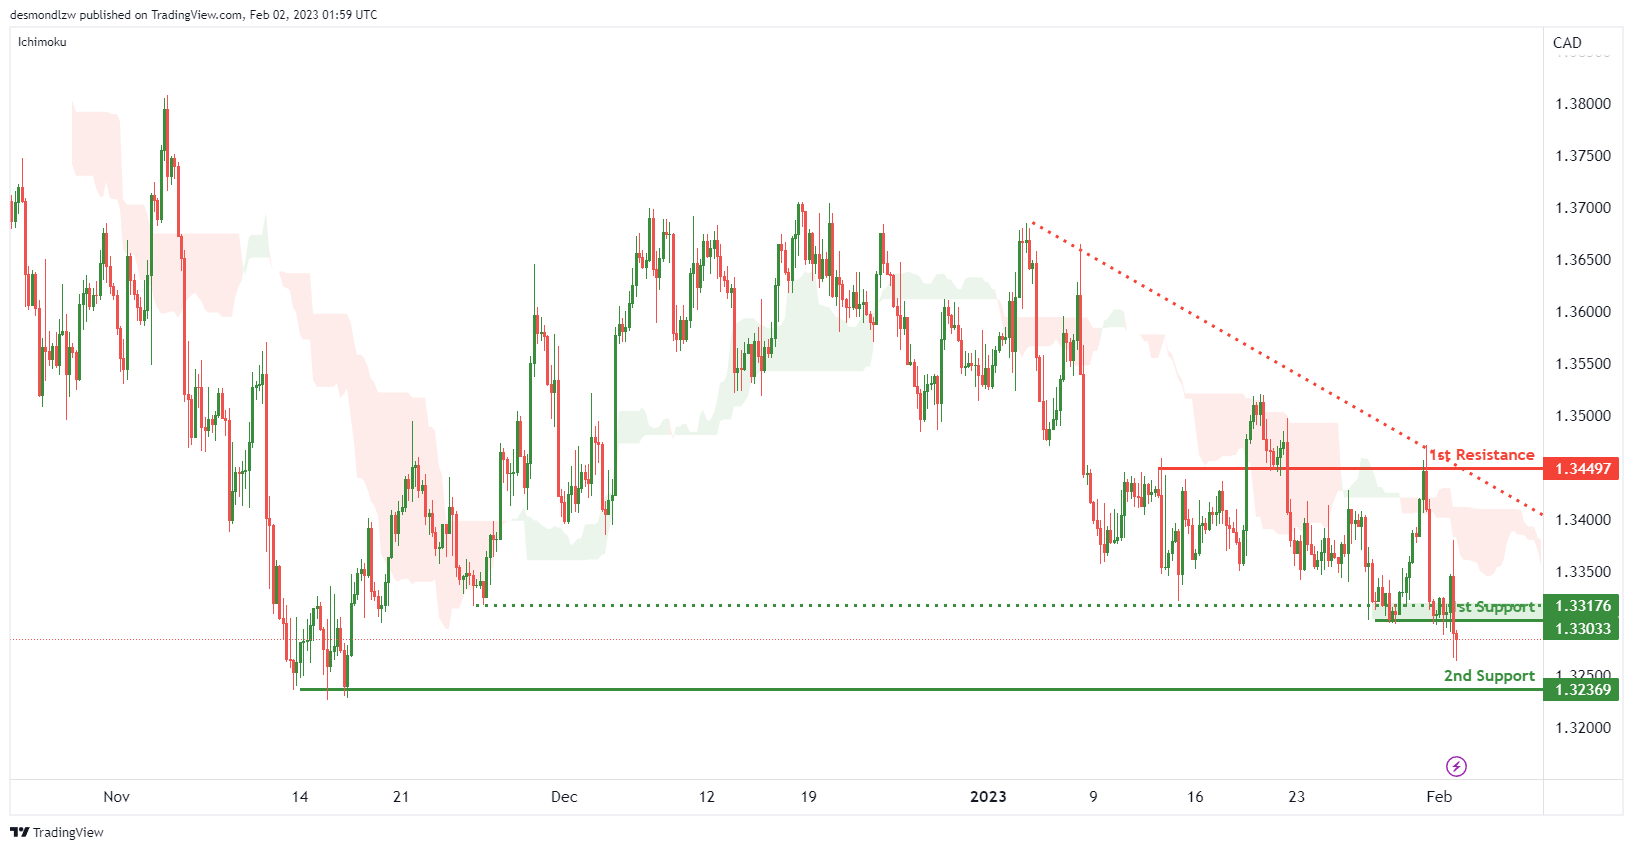
USD/CAD:
Looking at the H4 chart, my overall bias for USDCAD is bearish, as the current price is below the Ichimoku cloud, and the 1st support line at 1.33033 has been broken. There is an descending trend line created. Expecting the price is heading down to the 2nd support level at 1.32369 which is the recent swing low.
In an alternative scenario, the price could possibly head up to the 1st resistance at 1.34497 which is the recent swing high.
Areas of consideration:
- H4 time frame, 1st resistance at 1.34497
- H4 time frame, 1st support at 1.33033
- H4 time frame, 2nd support at 1.32369
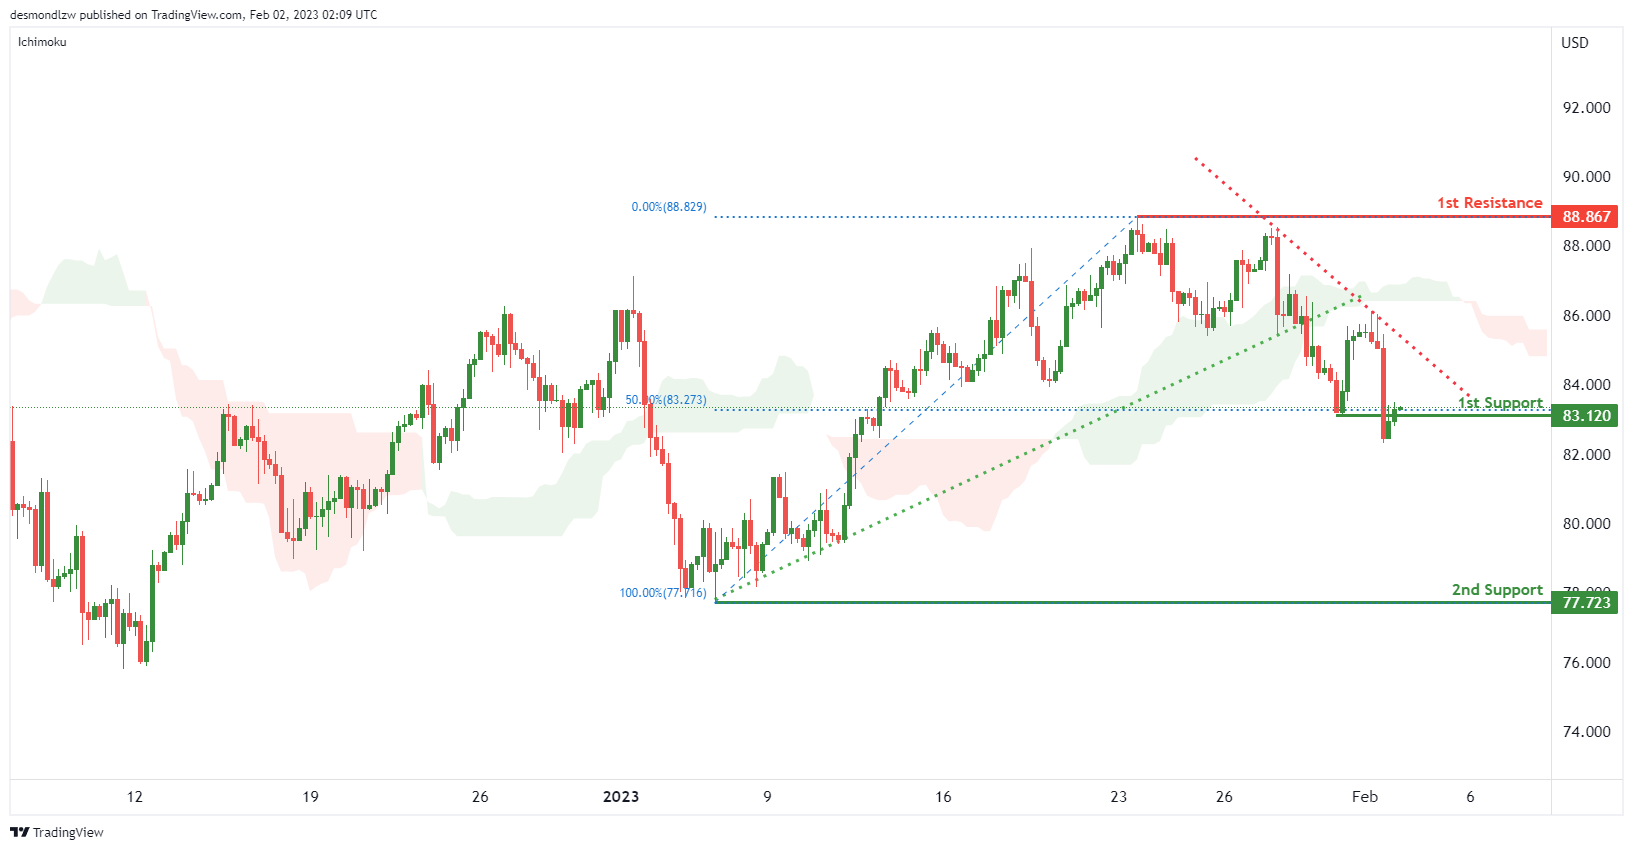
OIL:
Looking at the H4 chart, my overall bias for BOC is slightly bearish.as the current price is below the Ichimoku cloud, and a descending trendline add confluence to my bias. Expecting the price is fluctuate around the 1st support level at 83.120, before it head down to the 2nd support 77.723.
In an alternate scenario, the price could possibly head up towards the 1st resistance level at 88.829 which is the recent swing high.
Areas of consideration:
- H4 time frame, 1st resistance at 88.829
- H4 time frame,1st support at 83.120 ,
- H4 time frame, 2nd support at 77.723.
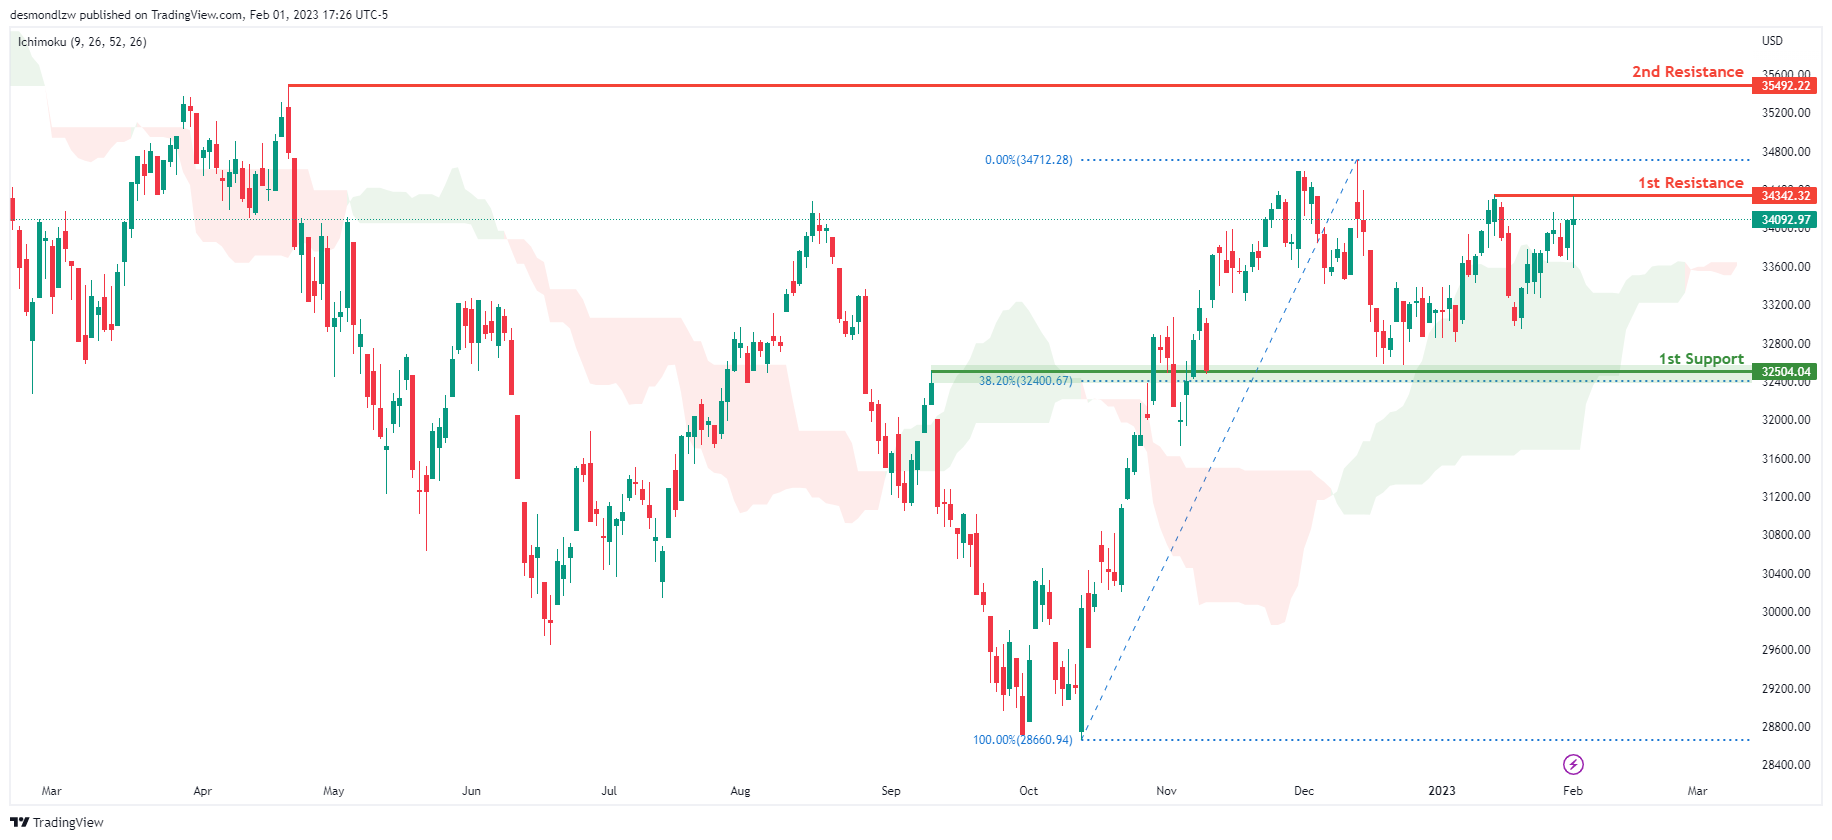
Dow Jones Industrial Average:
On the Daily chart, the overall bias for DJI is bullish. To add confluence to this, the price is crossing above the Ichimoku cloud which indicates a bullish market. If this bullish momentum continues, expect the price to possibly continue heading towards the 1st resistance line at 34342.32, where the recent swing high is. In an alternative scenario, price could possibly head back down towards the 1st support at 32581.97, slightly above where the 38.2% Fibonacci line is.
Areas of consideration:
- H4 time frame, 1st support at 32581.97
- H4 time frame, 1st Resistance at 34342.32
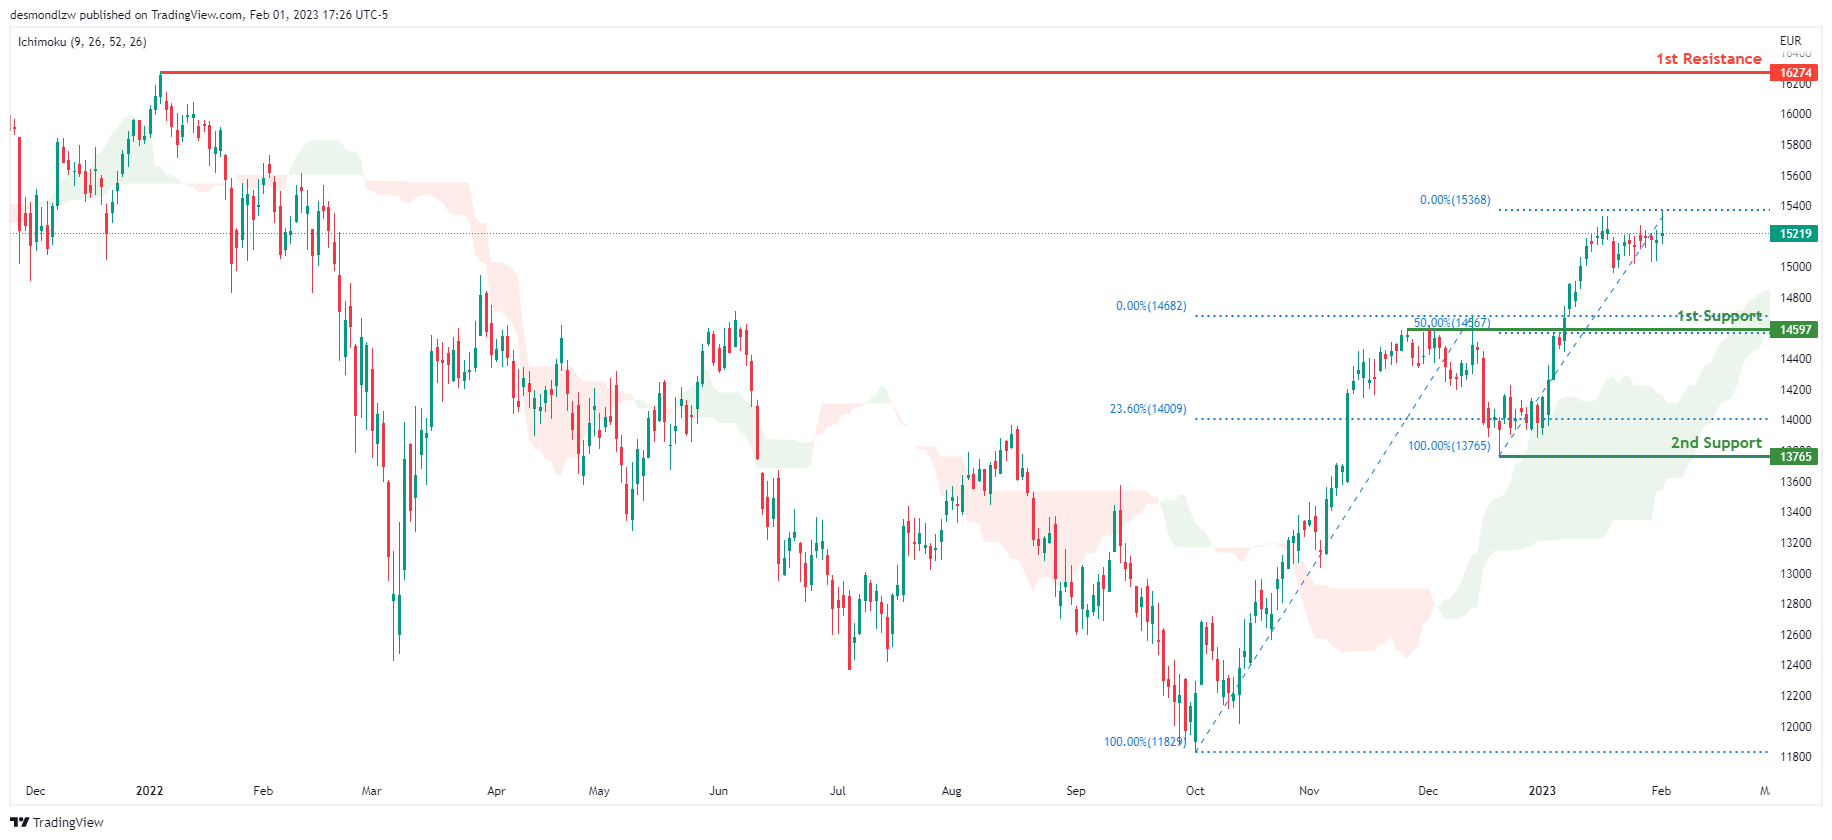
DAX:
Looking at the Daily chart, my overall bias for DAX is bullish due to the current price crossing above the Ichimoku cloud, indicating a bullish market. If this bullish momentum continues, expect the price to possibly head towards the 1st resistance line at 16274, where the previous swing high is. In an alternative scenario, price could possibly head down to retest the 1st support at 14597, where the 50% Fibonacci line is.
Areas of consideration:
- H4 time frame, 1st resistance is at 16274
- H4 time frame, 1st support is at 14597
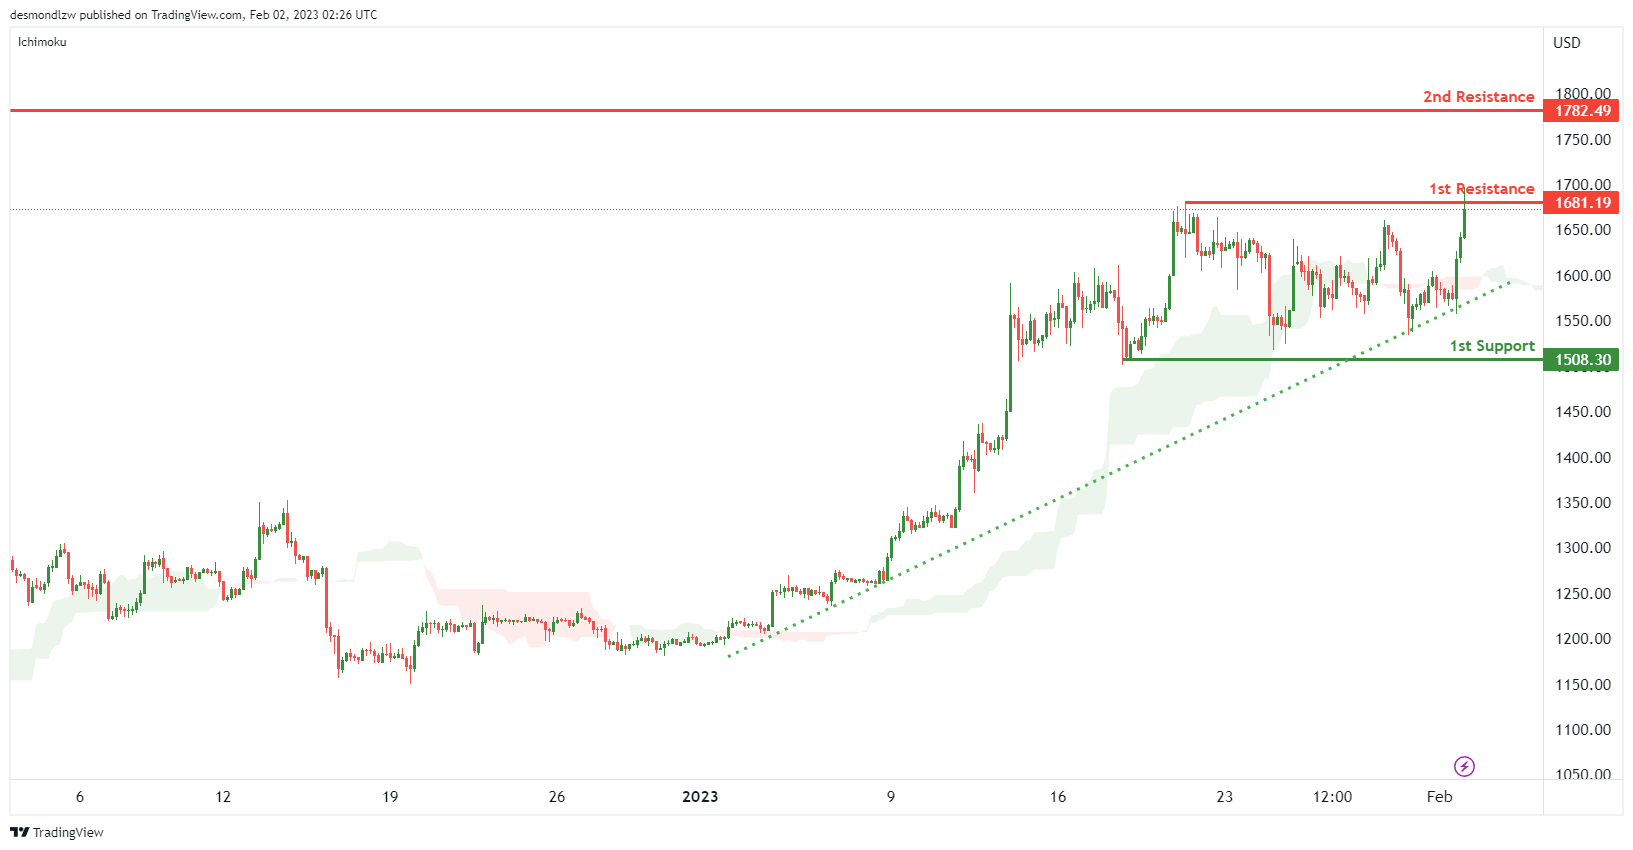
ETHUSD:
Looking at the H4 chart, my overall bias for ETHUSD is slightly bullish, the strong ascending trend line has been created. Expecting the price break the 1st resistance line at 1681.19 which is the recent swing high, before it head towards the 2nd resistance 1782.49.
In an alternate scenario, the price may go down to the 1st support at 1508.30 which is the recent swing low.
Areas of consideration:
- H4 time frame, 2nd resistance of 1782.49
- H4 time frame, 1st resistance of 1681.19
- H4 time frame, 1st support at 1508.30
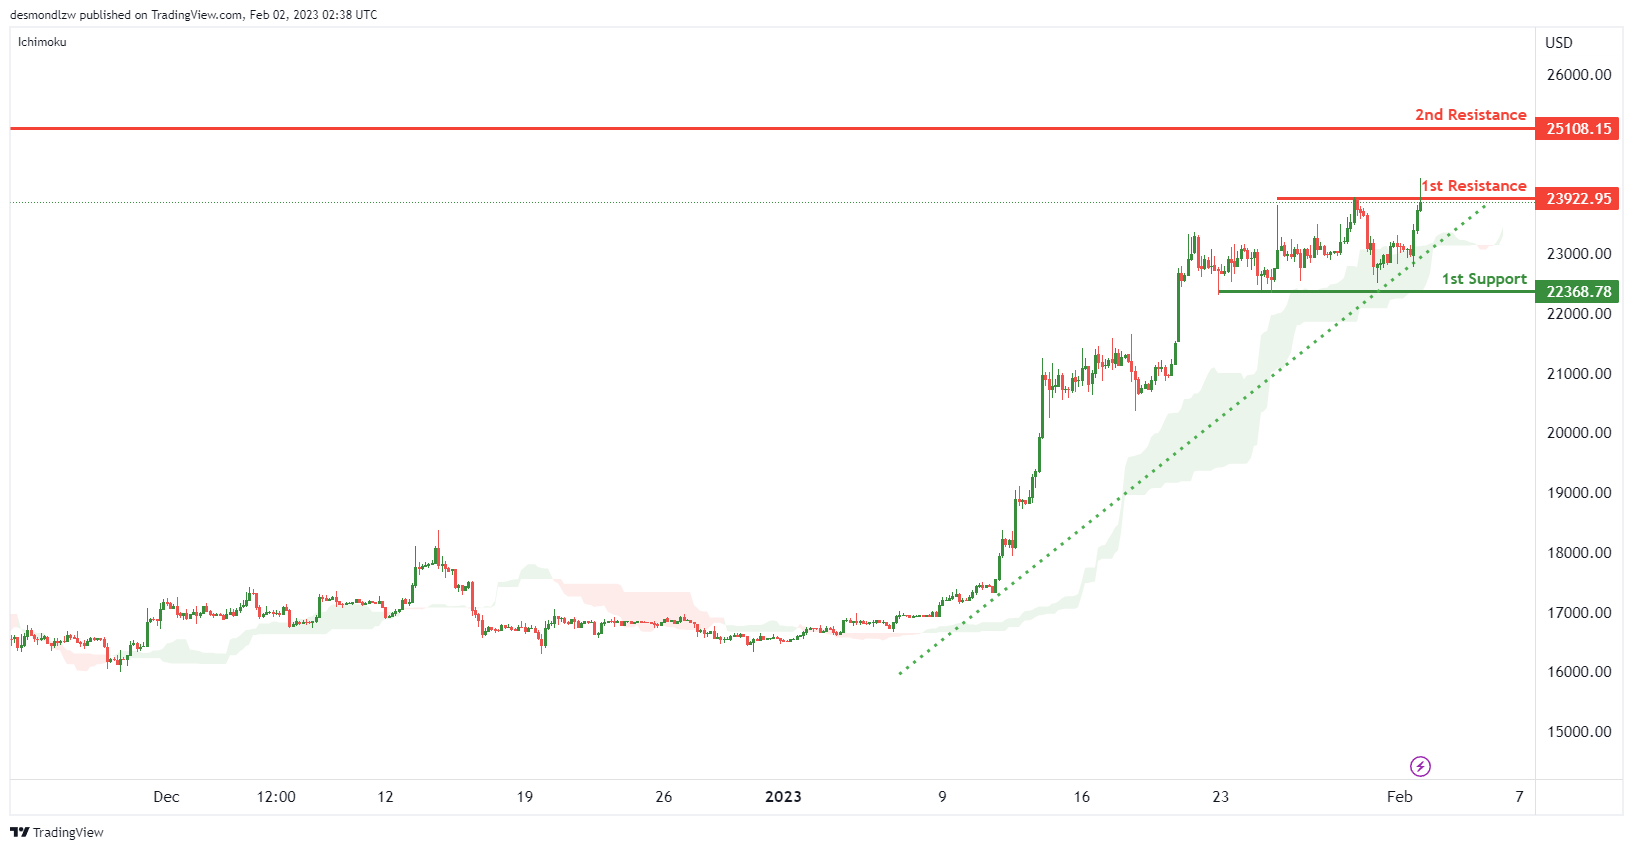
BTCUSD:
Looking at the H4 chart, my overall bias for BTCUSD is bullish. There is an ascending channel was created, expecting the price to break the 1st resistance line at 23922.95 which is the recent overlap resistance, before it heading towards the 2nd resistance at 25108.15 which is the previous swing high.
In an alternative scenario, the price could possibly head down to the 1st support at 22368.78 which is the overlap support.
Areas of consideration:
- H4 time frame, 2nd resistance 25108.15
- H4 time frame, 1st resistance 23922.95
- H4 time frame, 1st support at 22368.78
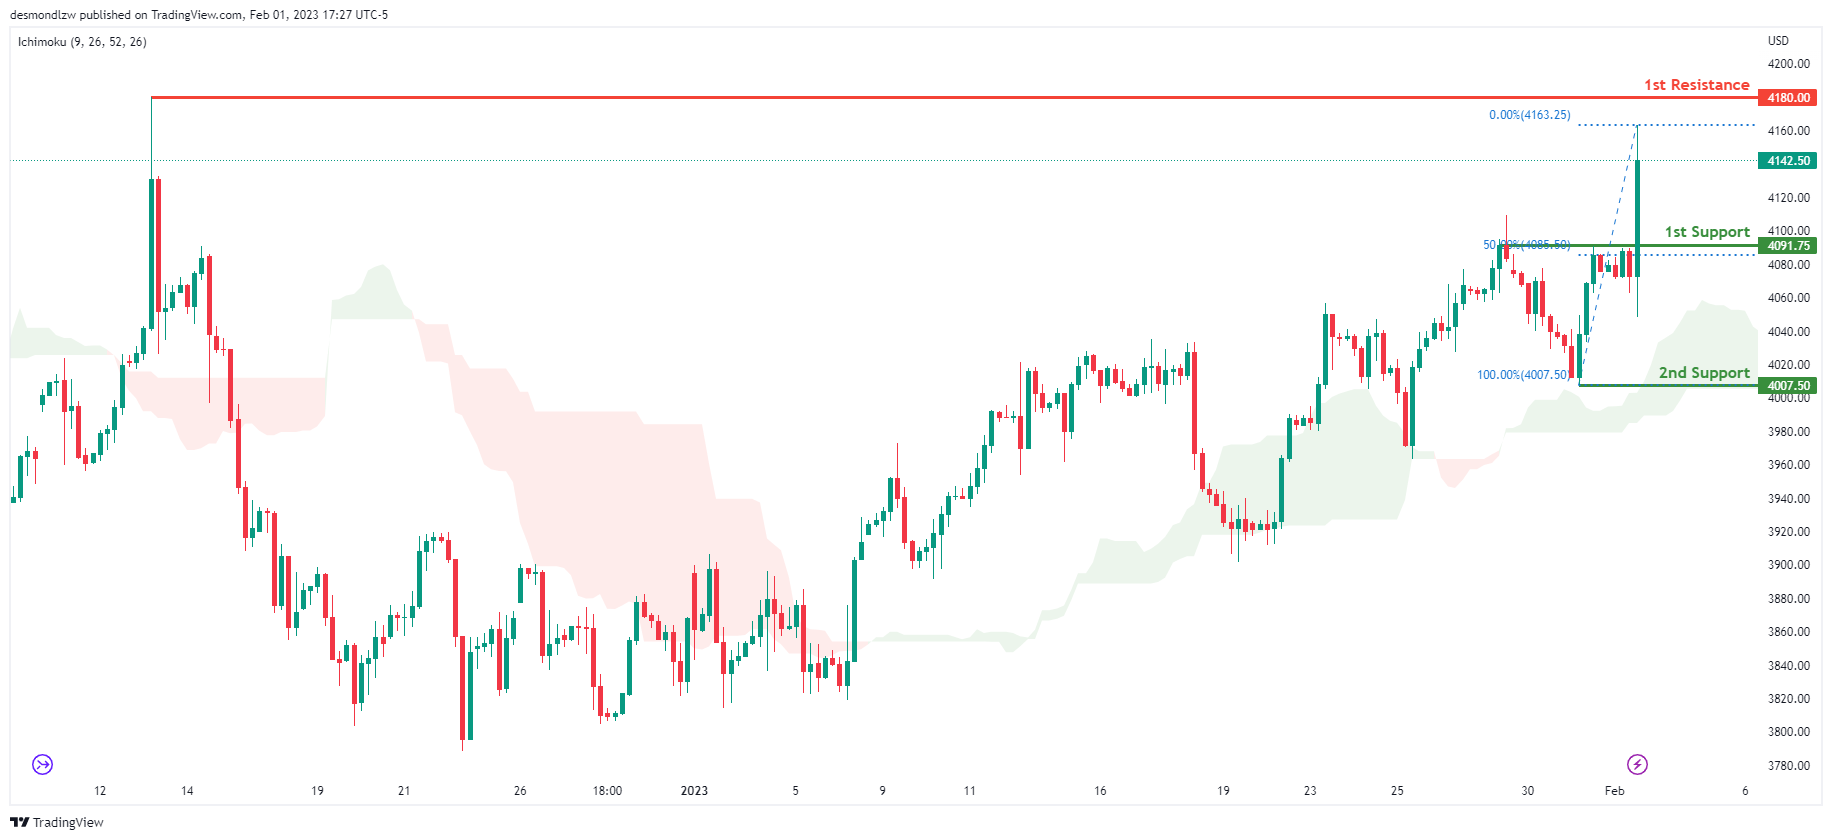
S&P 500:
Looking at the H4 chart, my overall bias for S&P500 is bullish due to the current price being above the Ichimoku cloud, indicating a bullish market. If this bullish momentum continues, expect the price to possibly continue heading towards the 1st resistance at 4180.00, where the previous swing high is. In an alternative scenario, price could possibly head back down to retest the 1st support at 4091.75, where the 50% Fibonacci line is.
Areas of consideration:
- H4 time frame, 1st support at 4091.75
- H4 time frame, 1st resistance at 44180.00
The accuracy, completeness and timeliness of the information contained on this site cannot be guaranteed. IC Markets does not warranty, guarantee or make any representations, or assume any liability regarding financial results based on the use of the information in the site.
News, views, opinions, recommendations and other information obtained from sources outside of www.icmarkets.com, used in this site are believed to be reliable, but we cannot guarantee their accuracy or completeness. All such information is subject to change at any time without notice. IC Markets assumes no responsibility for the content of any linked site.
The fact that such links may exist does not indicate approval or endorsement of any material contained on any linked site. IC Markets is not liable for any harm caused by the transmission, through accessing the services or information on this site, of a computer virus, or other computer code or programming device that might be used to access, delete, damage, disable, disrupt or otherwise impede in any manner, the operation of the site or of any user’s software, hardware, data or property.


