
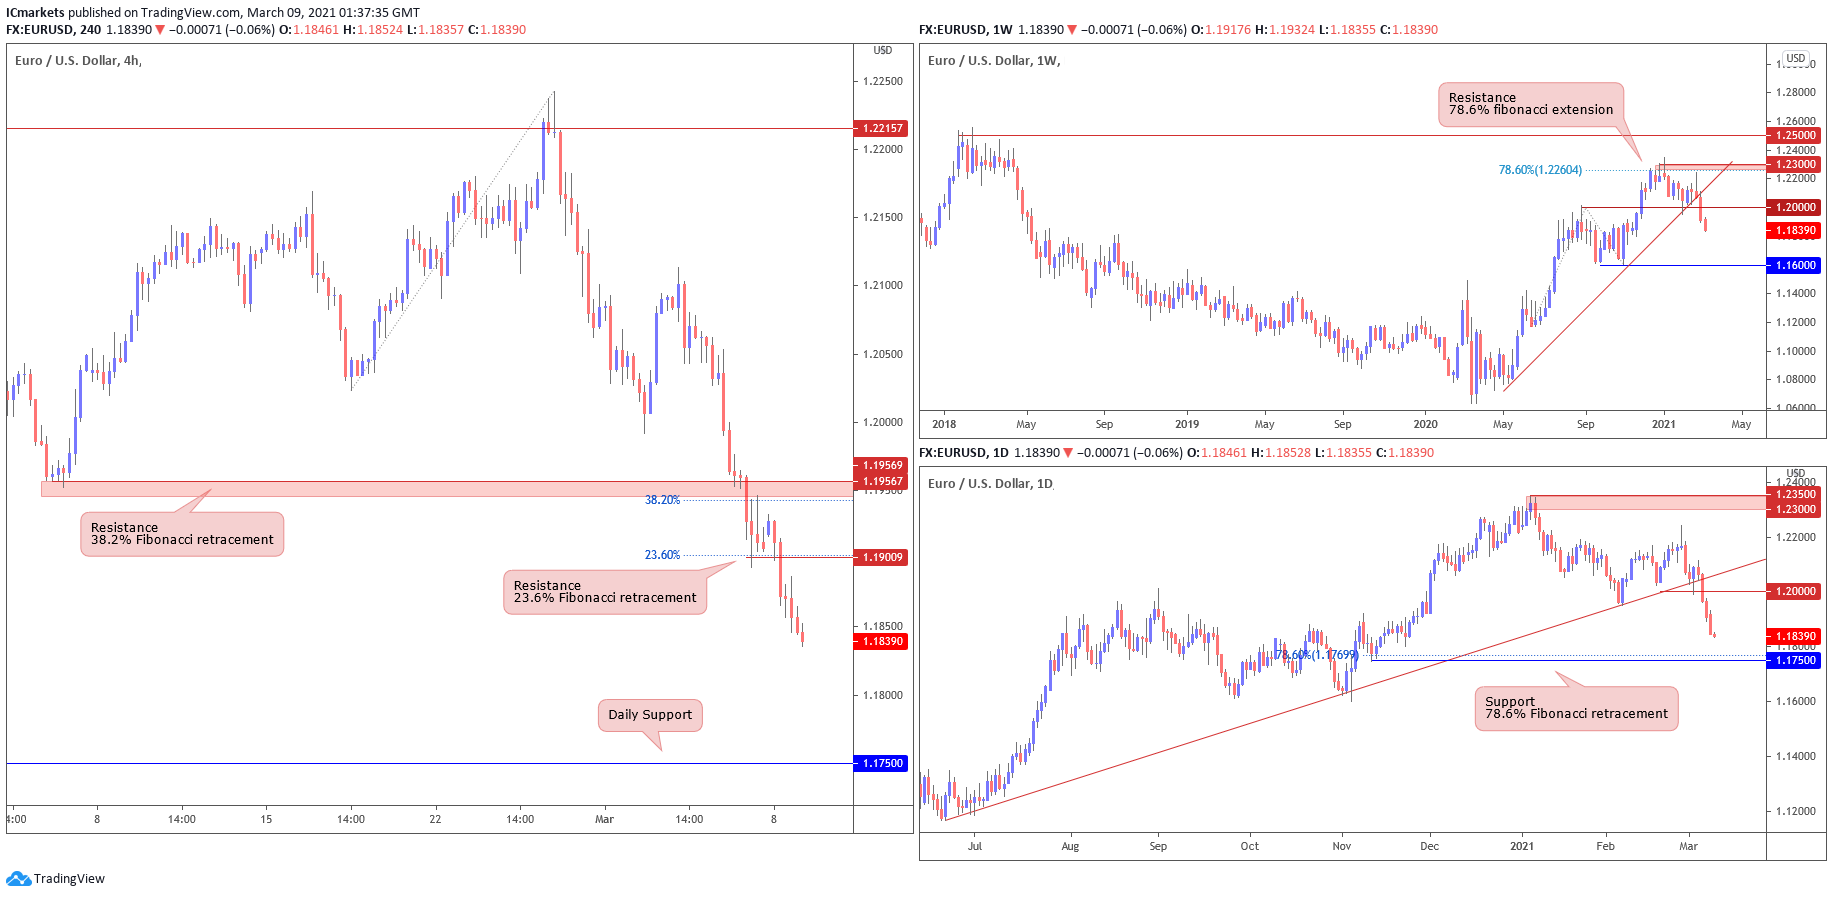
EUR/USD:
Looking at the weekly chart, we can see that prices broke our ascending trend line and key support level at 1.20000, where we could see a further downside before prices reach the next support target at 1.16000, which coincides with graphical swing low support level. The daily time frame echoes the same bearish view as well and we could see a further downside below our resistance level at 1.2000, with 1.17500 as the next support target.
On the H4 timeframe, prices are facing bearish pressure from our resistance level at 1.19009, in line with the 23.6% fibonacci retracement. We could see a further drop below our H4 resistance level to test our daily support level at 1.17500.
Areas of consideration:
- 17500 support area found on Daily time frame
- 19009 resistance level found on H4 time frame
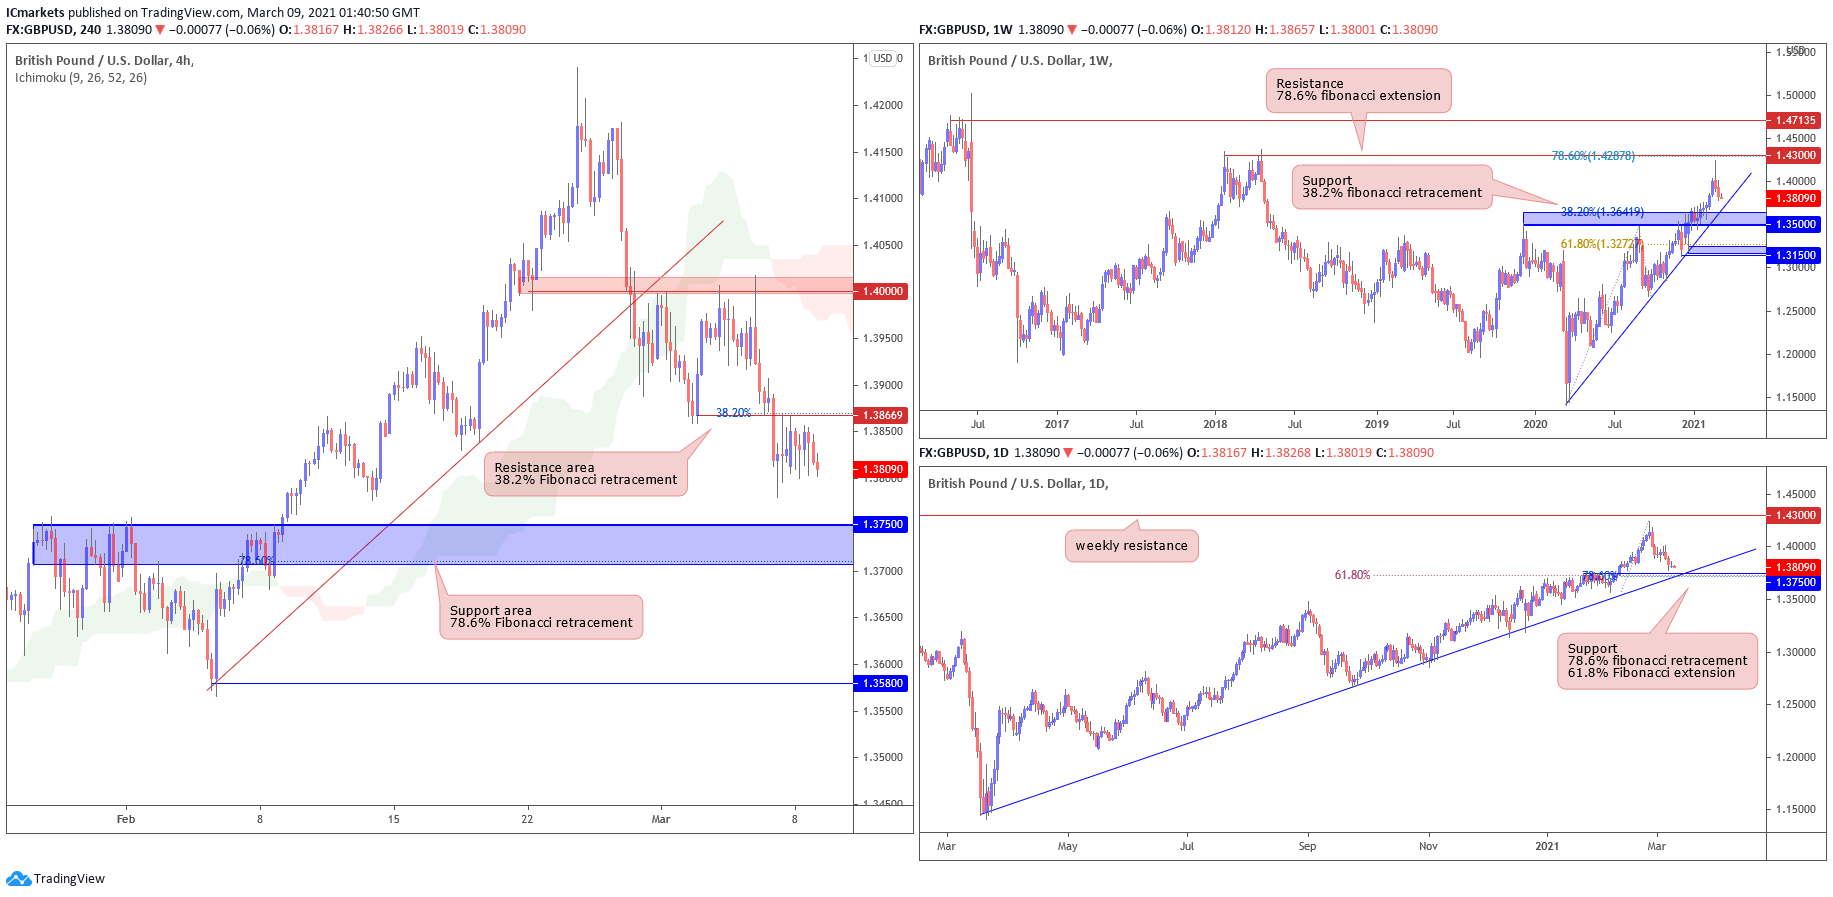
GBP/USD:
Looking at the weekly chart, we can see that prices are approaching our ascending trend line and weekly support area at 1.35000 where we could see a further downside before it reaches our support level, in line with the graphical pullback support area and 38.2% Fibonacci retracement. On the daily time frame, prices are approaching our support area at 1.37500, which coincides with the 78.6% Fibonacci retracement, 61.8% fibonacci extension and ascending trend line. Both time frames echo the same view that we could be seeing further downside before prices reach our support area.
On the H4 timeframe, prices are facing bearish pressure from our resistance area at 1.38669, in line with our graphical pullback resistance area and 38.2% fibonacci retracement. We could see a further drop below this level to test our next support level at 1.37500, which is the key support level found on the daily time frame. This support level is also in line with the horizontal pullback support level and 78.6% fibonacci retracement.
Areas of consideration:
- 38669 resistance area found on H4 time frame
- 37500 support area found on H4 timeframe
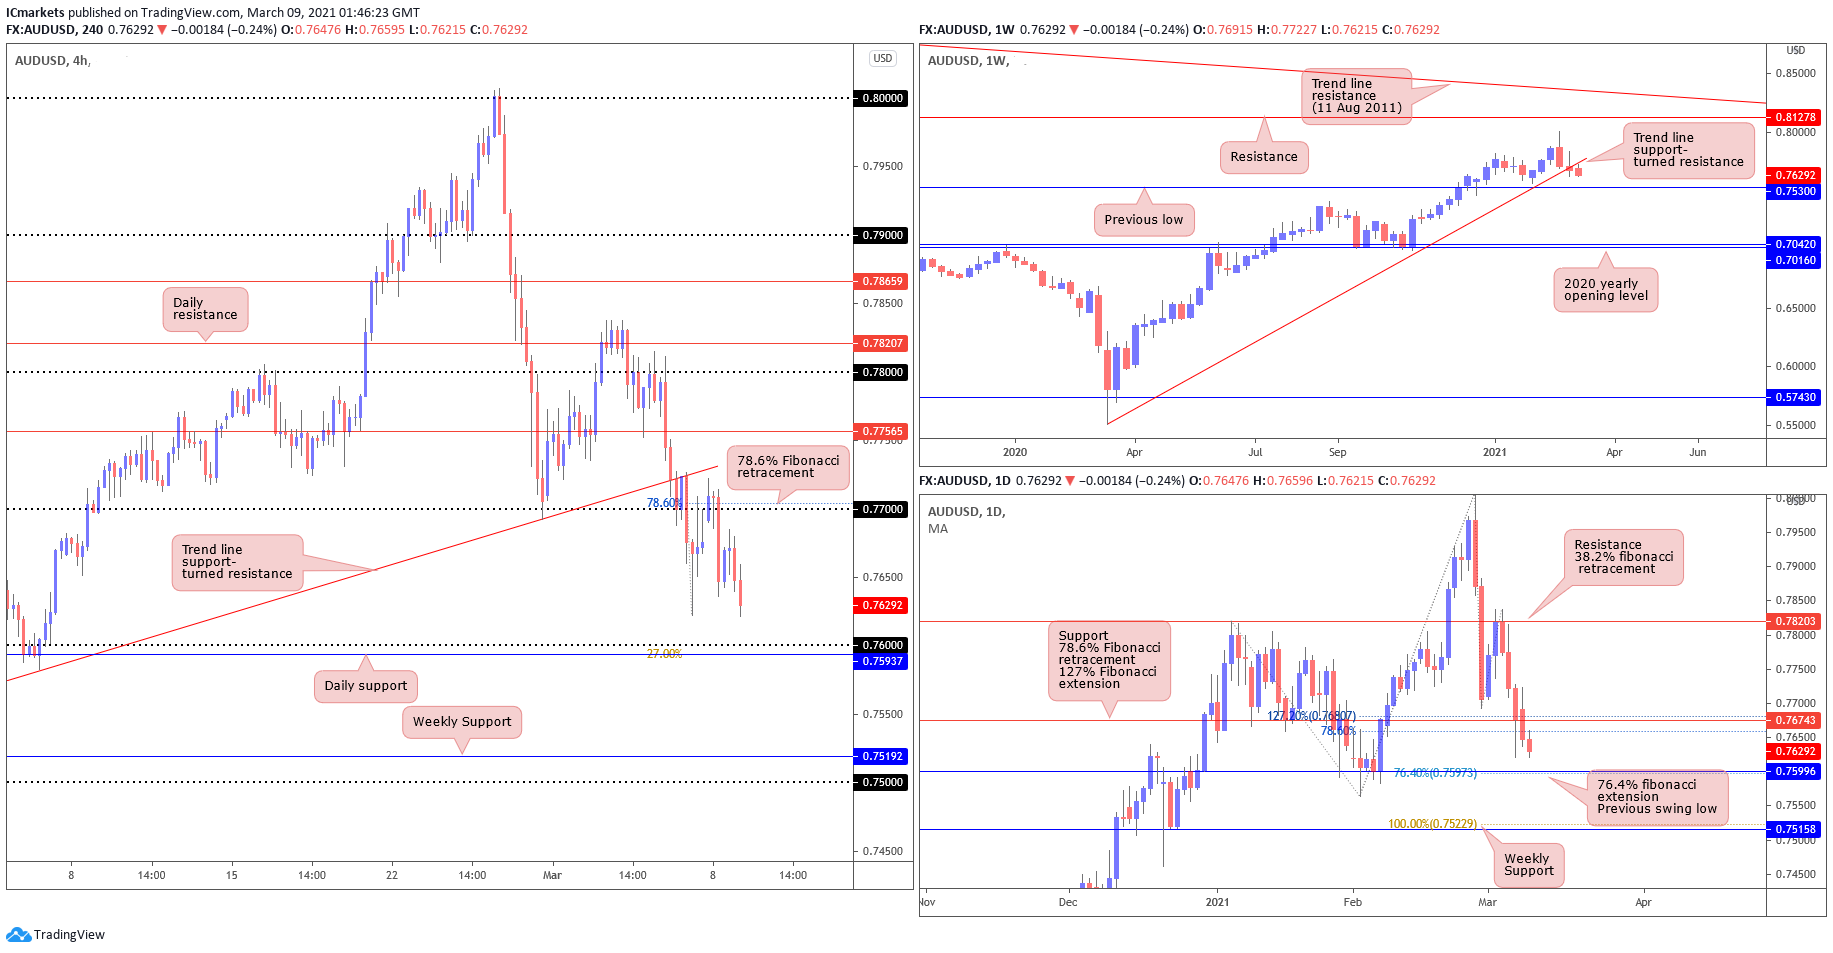
AUD/USD:
From the Weekly timeframe, we can see that the price has broken the ascending trendline support turned-resistance drawn from 9th March (2020), where we may see a retest of this level if price continues to drop further. On the Daily timeframe, price has broken and closed beneath the level of 0.76743, in line with 78.6% Fibonacci Retracement, 127% Fibonacci extension and horizontal swing low support. And as expected, is moving towards the 76.4% fibonacci extension and previous swing low level at 0.75996.
A continuation of this momentum may send the price down towards Weekly support and 100% fibonacci extension level at 0.75158. On H4, price has made the short-term bullish pullback towards the 78.6% fibonacci retracement, where we are seeing the continuation of bearish momentum towards the -27% fibonacci retracement, which is also in line with the Daily support, and Major figure of 0.76.
Areas of consideration:
- H4 is showing more potential downside towards the 0.76 figure, and even Weekly support at 0.75192.
- Weekly and Daily time frames are showing weak bearish momentum.
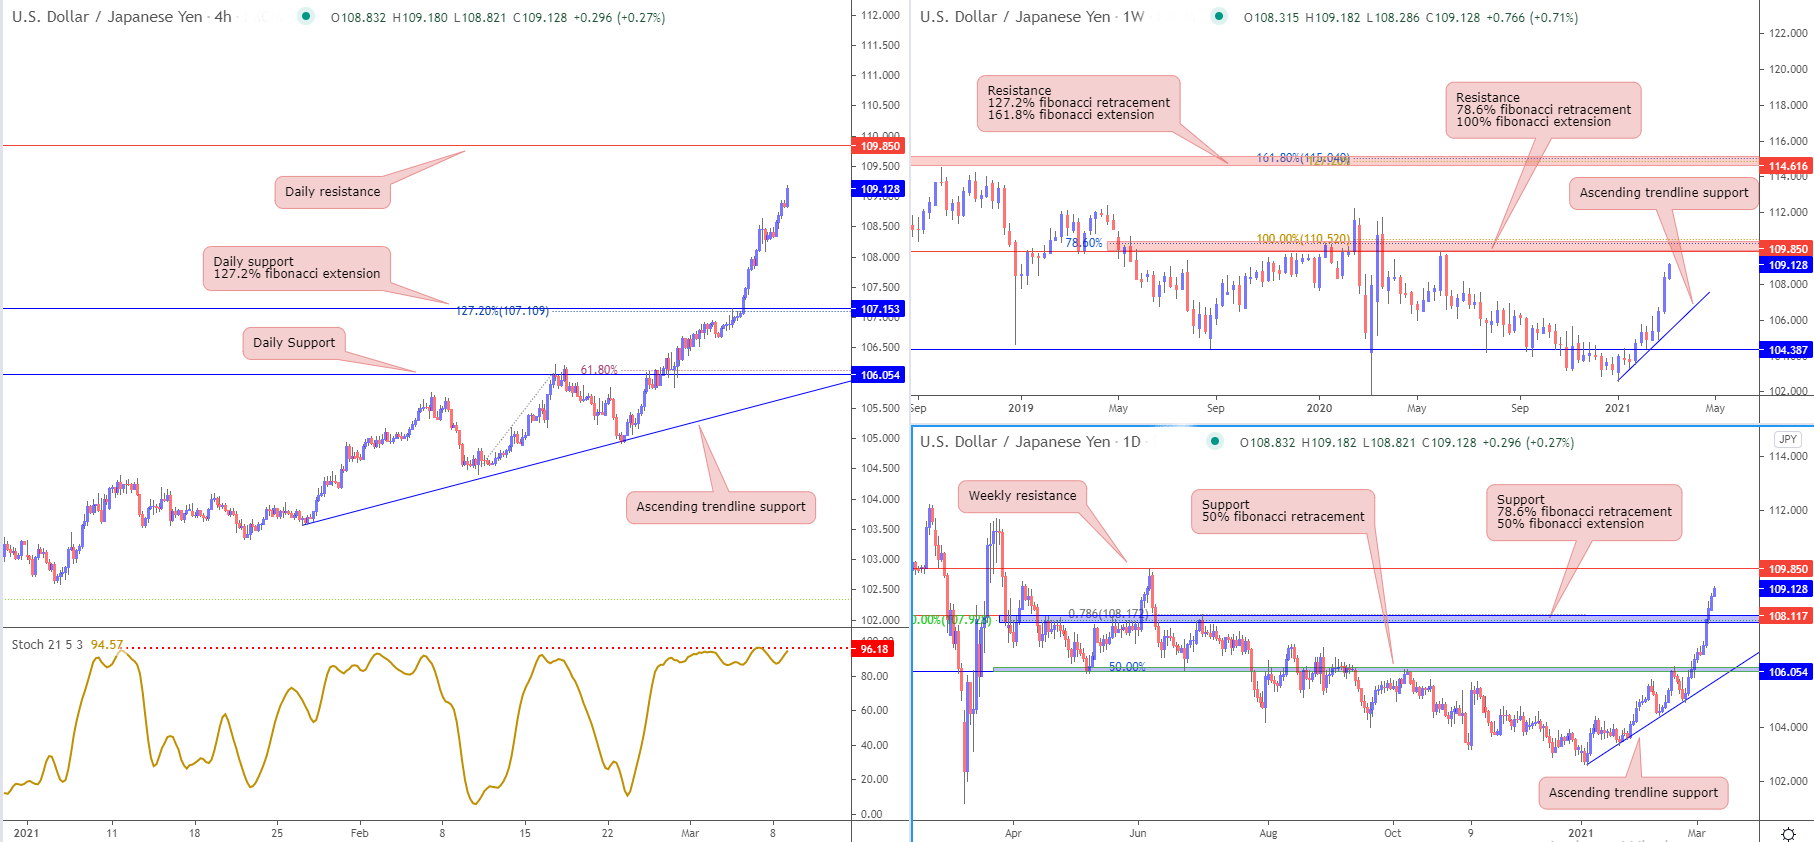
USD/JPY
From the weekly timeframe, prices are reaching resistance from horizontal swing high resistance which coincides with 78.6% fibonacci retracement as well as 100% fibonacci extension.
On the daily timeframe, prices are reaching the weekly resistance and might pull back to take support from horizontal pullback support which coincides with the 78.6% fibonacci retracement and 50% fibonacci extension. On the H4 timeframe, prices are also showing bearish pressure towards weekly resistance level of 109.850 and might pull back to daily support level which also coincides with the 127.2% fibonacci extension level on the H4 timeframe.
Areas of consideration:
- On the H4, prices might pull back to 107.153 which is a H4 and daily time frame support level
- 850 is a strong resistance level
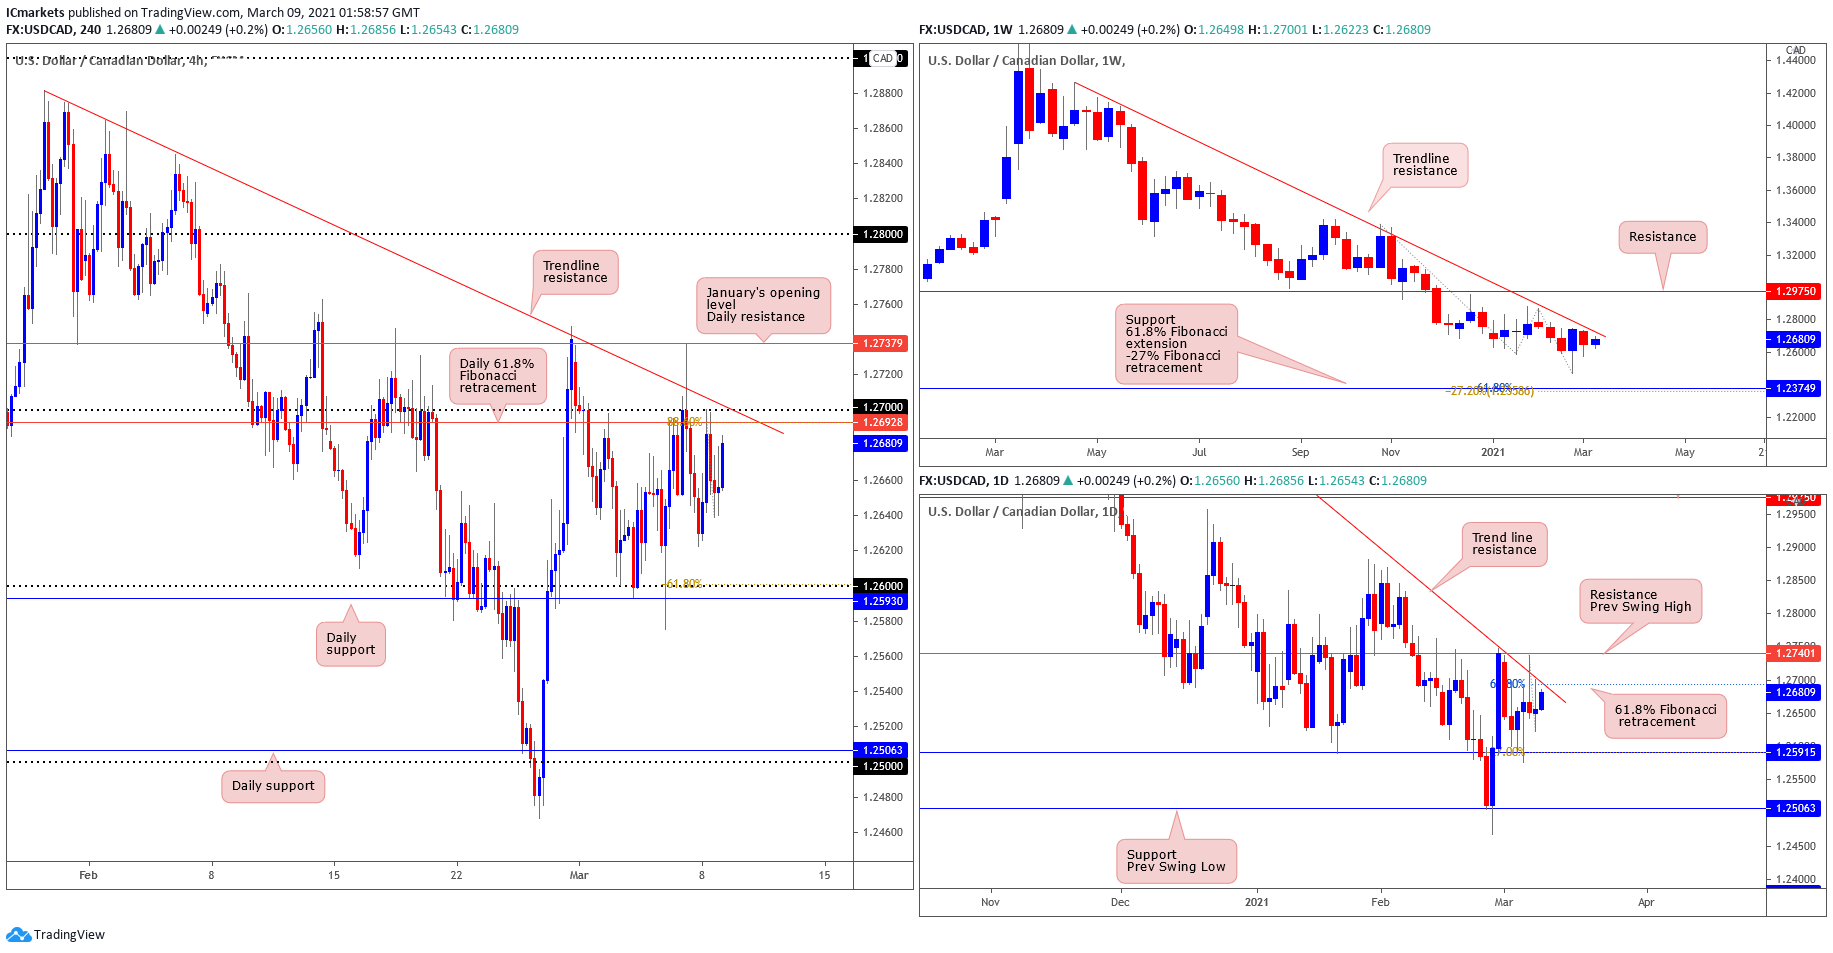
USD/CAD:
Looking at the weekly chart, price has pushed away from the descending trendline, where it may test its previous low. It is important to note that the long-term picture has pointed the direction down (trend) since March (2020).
In the daily time frame, we are able to see price returning towards 61.8% fibonacci retracement at 1.26928 from the previous price data given, once price has achieve this target, we may see a drop from here towards the -27% fibonacci retracement at 1.25915, where the previous low was made.
On the H4, price is within stone’s throw distance of the Daily 61.8% fibonacci retracement level, which is also in line with the 88% fibonacci retracement from the recent move. And the take profit target of -61.8% fibonacci retracement is in line with daily -27% fibonacci retracement.
Areas of consideration:
- H4 may drop from 1.2692 towards 1.2593 to test the previous low, -61.8% fibonacci retracement and major level of 1.26
- Daily time frame is showing fibonacci confluence level with H4
- Weekly time frame is showing bearish momentum in line with our analysis.
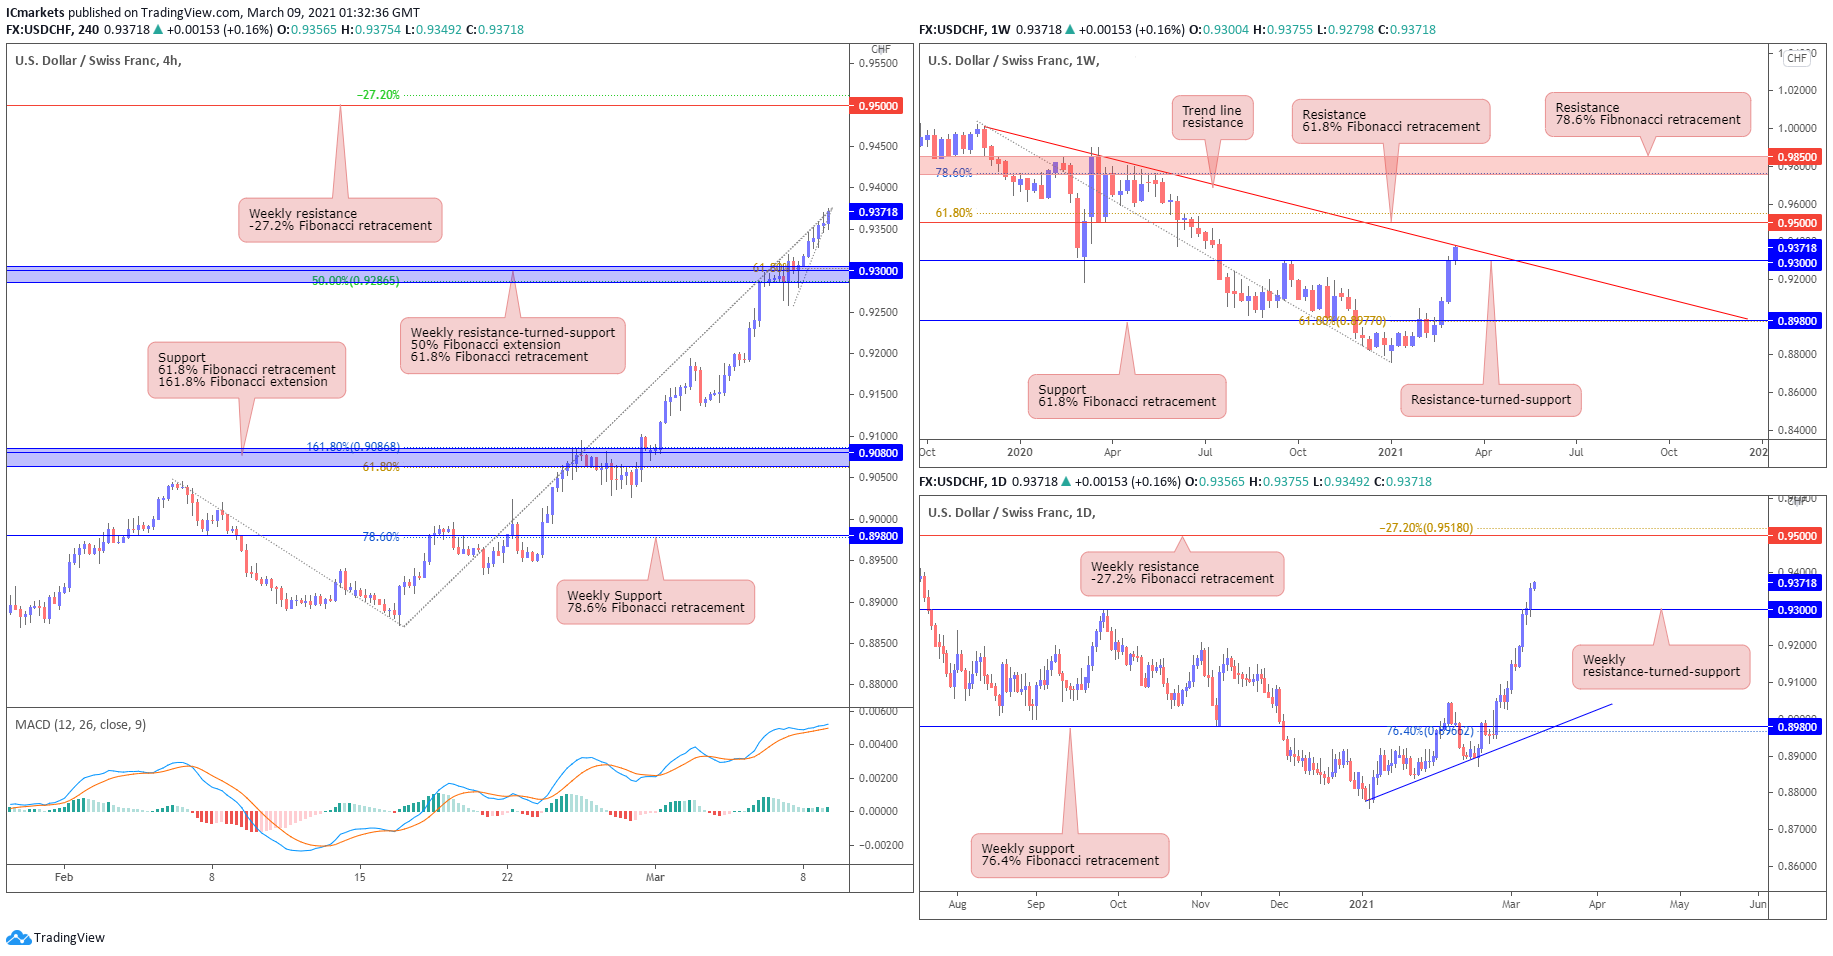
USD/CHF:
On the weekly timeframe, USD/CHF has shown a break above the weekly 0.93000 resistance area, and is now testing the weekly descending trendline resistance level. The daily chart also shows a similar picture as price managed to break and close above the 0.93000 resistance-turned-support level. In this scenario, we could potentially see a further push up to test the next resistance level at 0.95000, which is in line with our 61.8% Fibonacci retracement level.
On the H4 chart, we can see that price has broken above the 0.93000 weekly resistance, and is now pushing higher. We note that the MACD line is above the 0 line, showing bullish pressure in line with our analysis. In this scenario, we could potentially see price push further up north towards the weekly 0.95000 resistance level, which is also in line with our -27.2% Fibonacci retracement. Otherwise, if price makes a pullback to the downside, it could possibly test the 0.93000 resistance-turned-support level instead.
Areas of consideration:
- 93000 weekly resistance level, a key level to watch, has been broken.
- Price could continue with further bullish momentum to test the next resistance level at 0.95000.
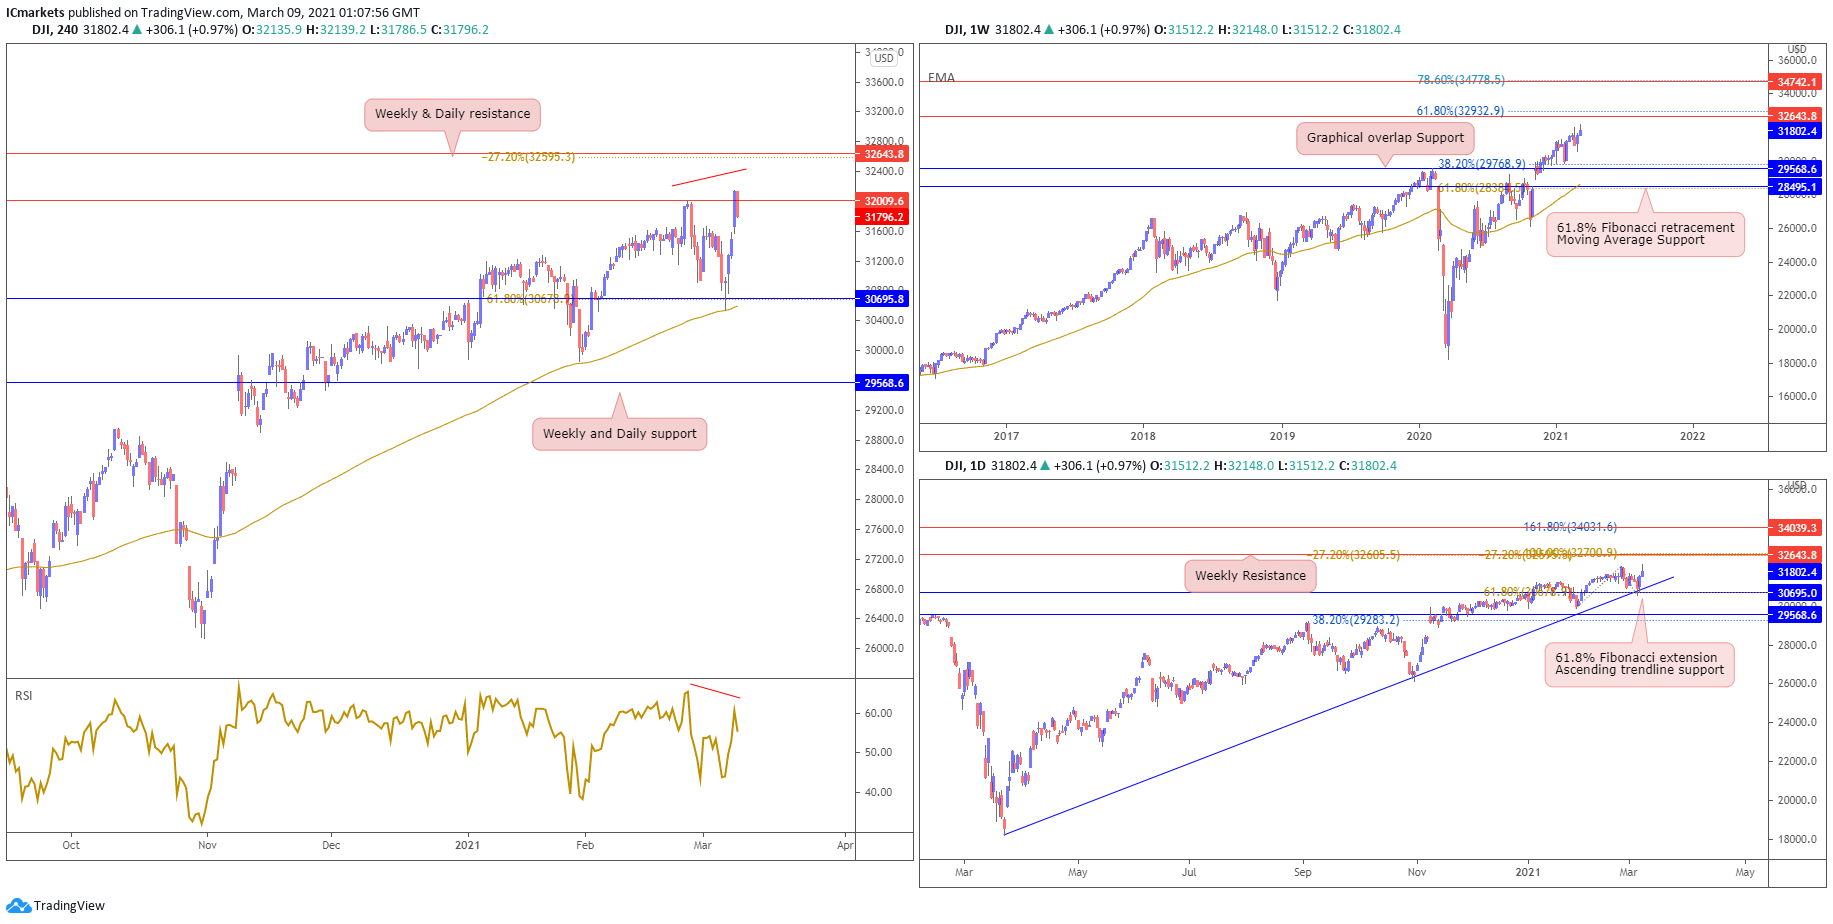
Dow Jones Industrial Average:
On the weekly chart, price pushed higher but continues to hold between 32643 resistance and 29568 support. Despite price holding above the long term moving average, there remains no strong levels for entry for now. On the Daily, price tested and is bounced above ascending trendline support. It is possible that traders could see a limited push up above this support towards weekly resistance at 32643 and should be careful when deciding to trade any short term pullbacks as the bullish momentum still remains strong.
On the H4, price tested and pulled back below 32009 resistance. Even though price is still strongly trending higher on the longer timeframe, we note that there is a bearish divergence forming on the H4. Sellers could possibly add to their shorts below 32009 resistance with 30695 support as a possible target. Failing to hold below 32009 resistance will see price swing the other way towards 32643 weekly resistance.
Areas of consideration:
- Watch closely daily resistance at 32009
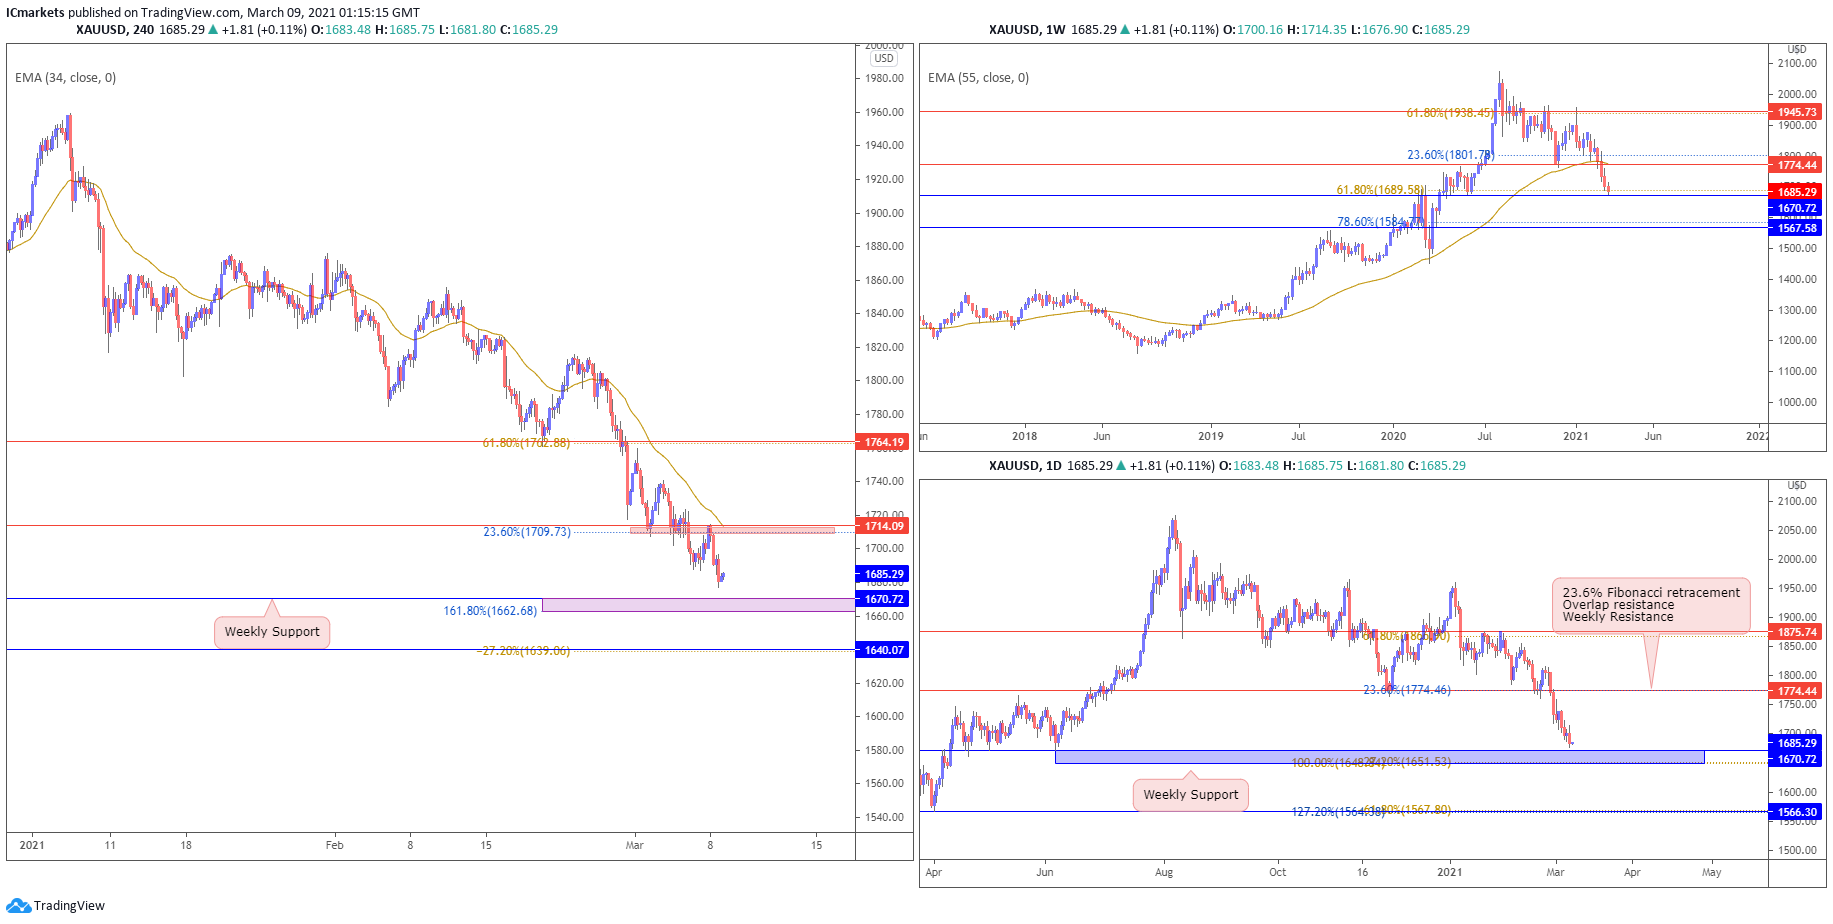
XAU/USD (GOLD):
On the weekly timeframe, gold pushed lower towards 1670 support which is in line with key 61.8% Fibonacci retracement level. A weekly close above this support level could possibly see a bounce next week. On the daily chart, we see price drifting lower and is currently approaching weekly support at 1670. Like the weekly, a daily close above 1670 could see a bounce reaction next week.
On the 4H timeframe price pushed lower and is still holding below 34 period EMA, however it is possible to see a limited bounce above weekly support level at 1670 towards resistance at 1714. However, failure to hold above 1670 could see price fall deeper towards 1640 support..
Areas of consideration:
- 1670 weekly support is the key level to hold any chance of a deeper drop
The accuracy, completeness and timeliness of the information contained on this site cannot be guaranteed. IC Markets does not warranty, guarantee or make any representations, or assume any liability regarding financial results based on the use of the information in the site.
News, views, opinions, recommendations and other information obtained from sources outside of www.icmarkets.com.au, used in this site are believed to be reliable, but we cannot guarantee their accuracy or completeness. All such information is subject to change at any time without notice. IC Markets assumes no responsibility for the content of any linked site.
The fact that such links may exist does not indicate approval or endorsement of any material contained on any linked site. IC Markets is not liable for any harm caused by the transmission, through accessing the services or information on this site, of a computer virus, or other computer code or programming device that might be used to access, delete, damage, disable, disrupt or otherwise impede in any manner, the operation of the site or of any user’s software, hardware, data or property.


