
Key risk events today:
NAB Business Confidence; Fed Chair Powell Speaks; FOMC Members Bullard and Quarles Speak.
EUR/USD:
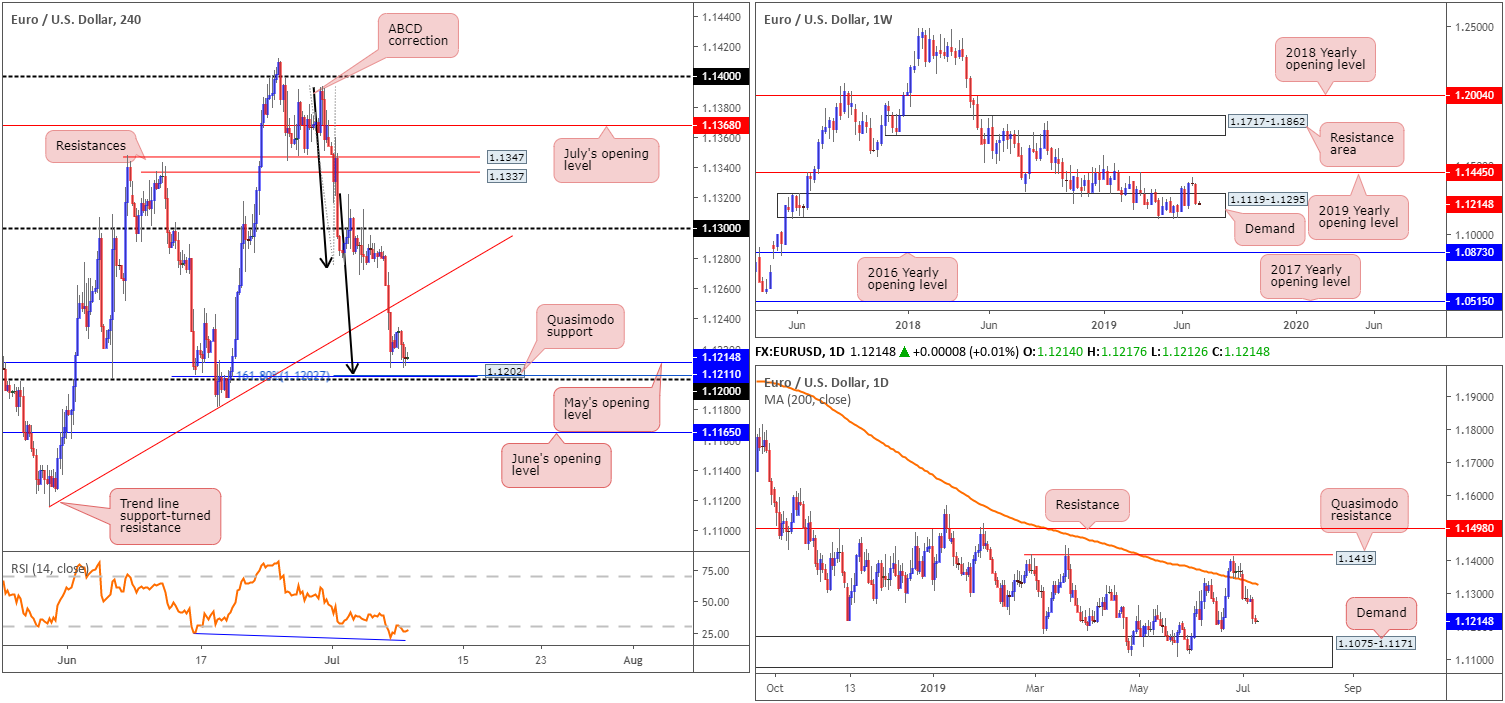
Unable to sustain early gains beyond 1.1234, the EUR/USD settled Monday a few points north of May’s opening level on the H4 timeframe at 1.1211, down 0.09% on the day. In terms of data out of Europe, Sentix showed investor confidence continued to deteriorate in July with the Index dropping to its lowest level since November 2014 at -5.8 from -3.3 in June.
In light of recent movement, the technical landscape remains unchanged, with 1.12/1.1211 offering strong confluence on the H4 timeframe. Here’s a piece from Monday’s briefing:
Comprised of a round number at 1.12, a Quasimodo support at 1.1202, a 161.8% ABCD (black arrows) correction at 1.1202, May’s opening level at 1.1211 and the H4 RSI indicator currently chalking up hidden divergence out of oversold territory, this zone holds sufficient local confluence to potentially bolster price today/early week and prompt a retest of the recently broken trend line support-turned resistance highlighted above.
In regard to the higher timeframes, Monday’s analysis remains valid:
Weekly analysis:
Since early November 2018, a long-standing demand area at 1.1119-1.1295 capped downside. As impressive as this is, impetus is lacking as price is unable to overthrow the 2019 yearly opening level (resistance) at 1.1445. Areas outside of the said zones to be aware of fall in around the 2016 yearly opening level at 1.0873 (support) and a resistance area drawn from 1.1717-1.1862.
Daily analysis:
Thanks to price action dethroning the 200-day SMA (orange) in early trade last week, the pair, after a couple of days treading water, decisively headed south. Notable demand at 1.1075-1.1171, formed on May 17, 2017, is now-within striking distance this week.
Areas of consideration:
Also brought forward from Monday’s piece:
Additional buying out of the H4 support zone at 1.12/1.1211 is a strong possibility, not only because of the mentioned confluence, but also due to traders likely looking to cover shorts, targeting H4 trend line support-turned resistance. Entry long at current price, with protective stop-loss orders plotted beneath 1.12, offers attractive risk/reward. The only caveat is daily price eyeing a run to demand at 1.1075-1.1171. Note the top edge of this base merges closely with June’s opening level at 1.1165.
Traders are also encouraged to keep June’s opening level in mind at 1.1162 for a possible bounce, given its association with the top edge of daily demand at 1.1171, should we reach this far south.
GBP/USD:
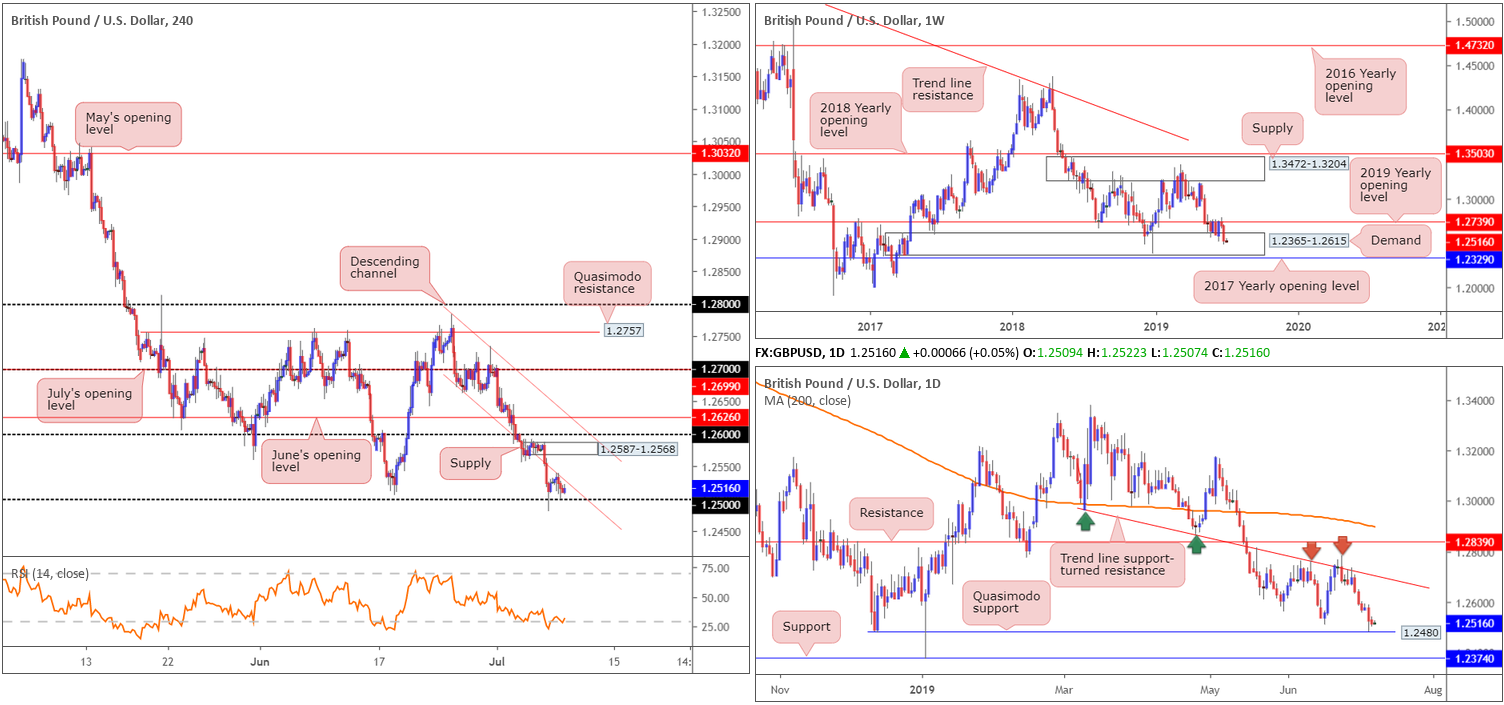
In the early hours of London Monday, H4 price action challenged channel support-turned resistance (1.2662) and held ground. This was a noted move to be aware of in Monday’s report for traders attempting to fade the psychological number 1.25. Overall, however, the research team still believes a move north might be on the cards.
From the weekly timeframe, Monday’s briefing had the following to report:
Since May 20, buyers and sellers have been warring for position between long-standing demand at 1.2365-1.2615 and the 2019 yearly opening level at 1.2739 (resistance). In light of recent movement erasing more than 170 points, though, price action is exploring fresh ground within the said demand zone that could eventually lead to a break south.
Areas outside of the current range to be conscious of fall in around the 2017 yearly opening level at 1.2329 (support) and supply coming in at 1.3472-1.3204.
And from the daily timeframe:
Since retesting trend-line support-turned resistance (extended from the low 1.2960), the GBP/USD has emphasised a bearish tone with focus now shifting to possible support emerging from a Quasimodo formation at 1.2480. Note Friday’s action came within a point of testing the said Quasimodo support before mildly paring losses into the close.
Areas of consideration:
Traders who attempted to fade 1.25 Friday were likely caught on the fakeout to the daily Quasimodo support underlined above at 1.2480. This is why it always pays to include the bigger picture in your analysis.
With the above reading taken into account, the following remains in focus going forward, according to the current technical position:
With the stop run beneath 1.25 likely tripping sell stops – therefore providing liquidity to continue pushing higher from the noted daily Quasimodo support – a run north is still perhaps valid. The caveat, however, is the H4 channel support-turned resistance (1.2662). To help overcome this, consider waiting for H4 price to close back within the channel formation and retest 1.25. That way, traders have unlocked a reasonably clear run towards newly-formed H4 supply at 1.2587-1.2568, closely followed by 1.26.
AUD/USD:
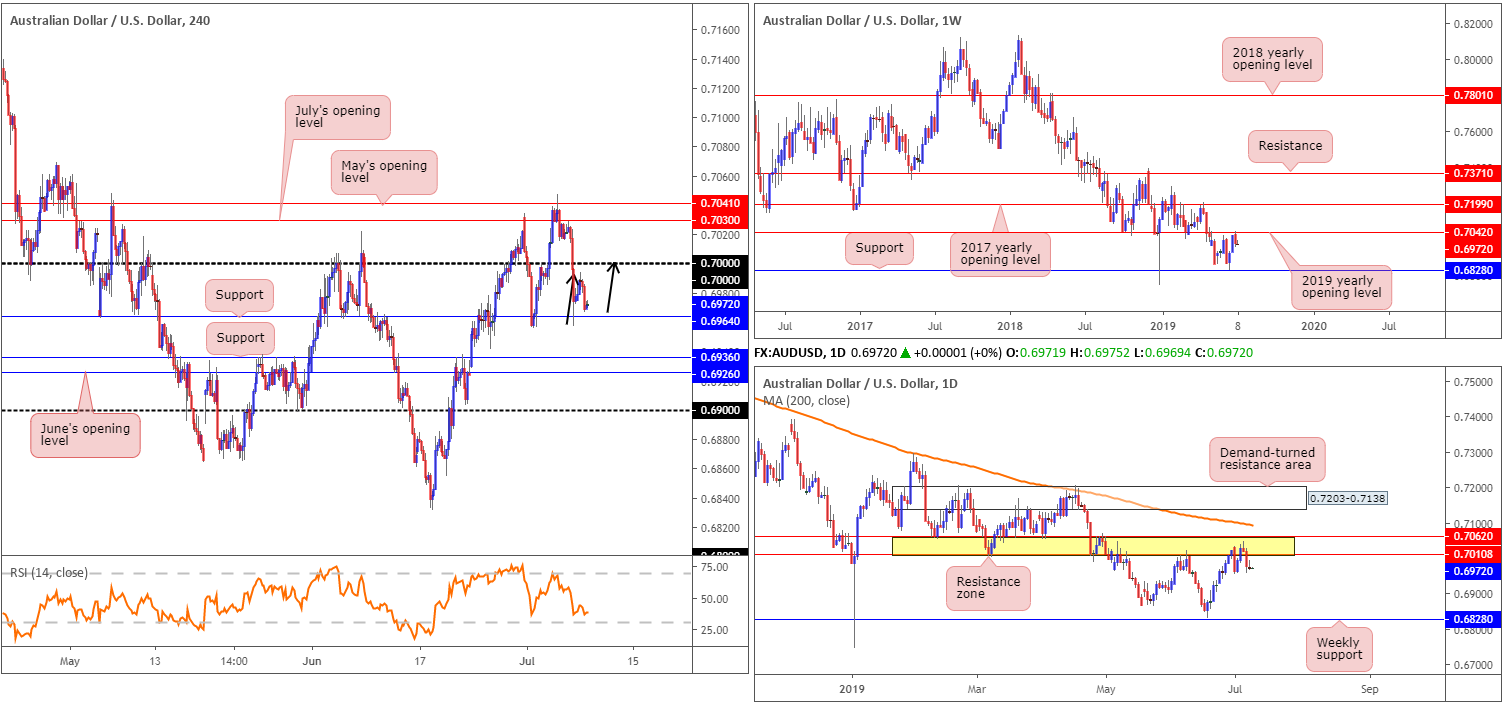
Data out of Australia Monday revealed job adverts rebounded in June (+4.6% vs -8.2% in May), though price action was unable to reclaim 0.70 on the H4 timeframe, instead topping at 0.6994. Support at 0.6964 remains in motion, entering the mix following Friday’s NFP-induced selloff. Beyond here, another layer of support resides close by at 0.6936, closely shadowed by June’s opening level at 0.6926.
In light of where the market is trading from on the higher timeframes, further downside is possible this week. From the weekly timeframe, Monday’s weekly report had the following to say:
Breaking a two-week bullish phase, of which involved a strong full-bodied bullish candle, price action tested the 2019 yearly opening level at 0.7042 (resistance) and rotated lower last week. Technically speaking, a response from 0.7042 is not surprising, having seen it serve well as support on a number of occasions in the past. Continued selling from this point has support coming in at 0.6828 in sight.
In conjunction with weekly structure, daily flow also stresses a bearish tone at the moment:
A closer reading of price action on the daily timeframe reveals two layers of resistance at 0.7062/0.7010, collectively forming a robust resistance zone (yellow). Overhead, traders may also find use in noting the 200-day SMA lurking nearby at around 0.7097 (orange). Assuming sellers remain in the driving seat, the next downside target on the daily timeframe can be seen around the weekly support mentioned above at 0.6828.
Areas of consideration:
A retest at the underside of 0.70, coupled with a H4 or H1 bearish candlestick confirmation (entry and risk levels can be determined according to the candlestick’s structure), is, according to the technical studies above, a high-probability short. In addition to this, and the fact higher-timeframe movement suggests lower prices, a retest at 0.70 could form in the shape of an ABCD bearish approach (black arrows), consequently adding more ‘juice’ to a potential sell from here.
From 0.70, the first take-profit target is set at 0.6964, followed closely by support at 0.6936 and June’s opening level at 0.6926.
USD/JPY:
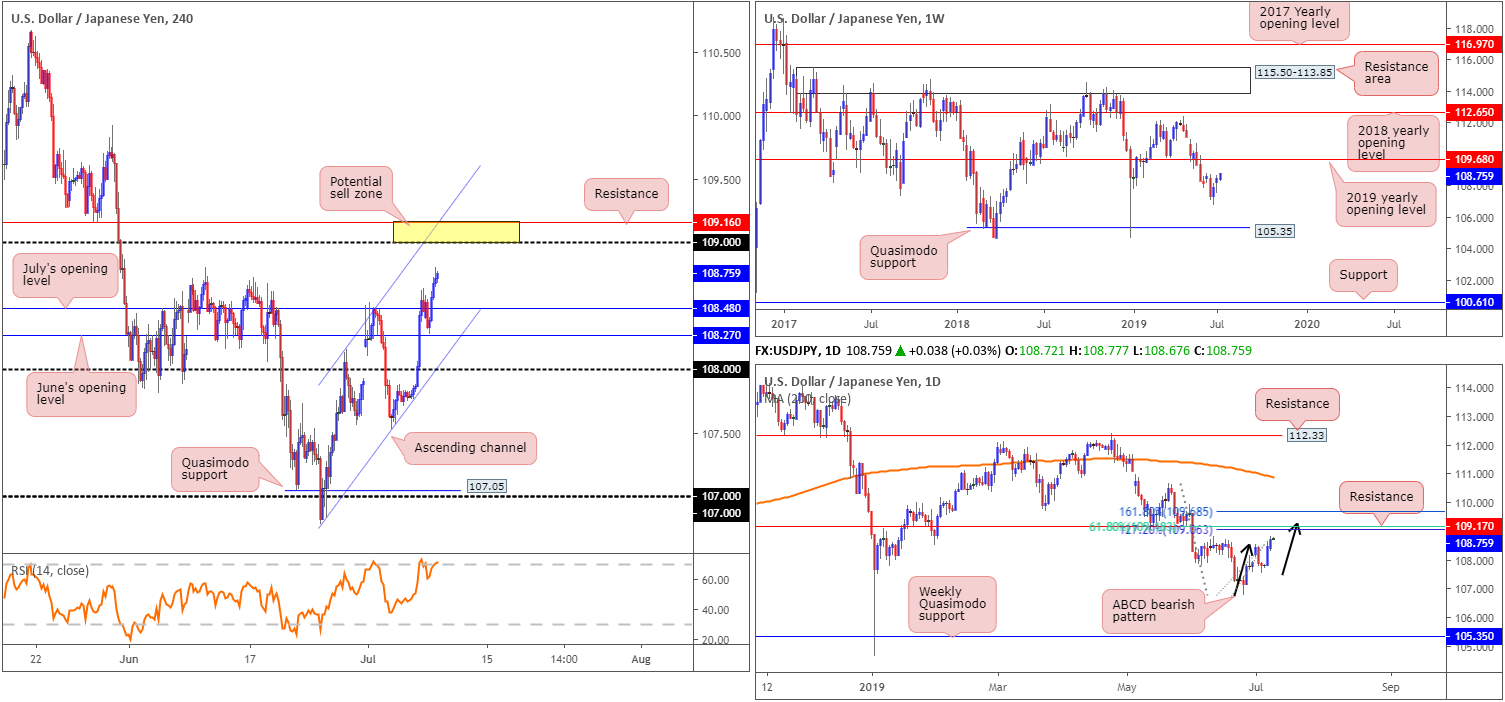
The US dollar advanced higher against the Japanese yen Monday, adding 0.24%. Leaving June’s opening level at 108.27 unchallenged in early Europe and overthrowing nearby resistance at 108.48 (July’s opening level), the H4 candles are poised to approach 109 today.
Looking at the weekly timeframe, we can see the US dollar finished the week higher against the Japanese yen. According to technical structure, room to climb higher towards the 2019 yearly opening level at 109.68 (resistance) is possible. To the downside, nonetheless, limited support is visible until reaching Quasimodo support at 105.35.
Before reaching 109.68, technical studies on the daily timeframe shows potential resistance around 109.17. What gives this level extra credibility is the merging ABCD bearish pattern (black arrows) at 109.30, the 127.2% Fibonacci ext. at 109.06 and a 61.8% Fibonacci retracement value at 109.18. For traders searching for a medium-term move short this week, this area may be an option with protective stop-loss orders positioned above the 161.8% Fibonacci ext. point at 109.68.
Further adding to higher-timeframe structure, the H4 timeframe also boasts local confluence to support 109 as a resistance: H4 channel resistance taken from the high 108.13 and H4 resistance at 109.16 (yellow).
Areas of consideration:
In response to the above analysis, the research team notes potential resistance emerging from the 109 handle. This level, alongside H4 channel resistance taken from the high 108.13, H4 resistance at 109.16 (yellow) and daily resistance at 109.17 as well as its associated Fibonacci resistances, offers a reasonably well-defined base for selling opportunities.
H4 traders looking to sell 109.16/109 may want to consider placing stop-loss orders above the noted H4 channel resistance, whereas daily traders eyeing 109.68/109.06, as already underlined above, might opt for larger stop-loss placement above 109.68.
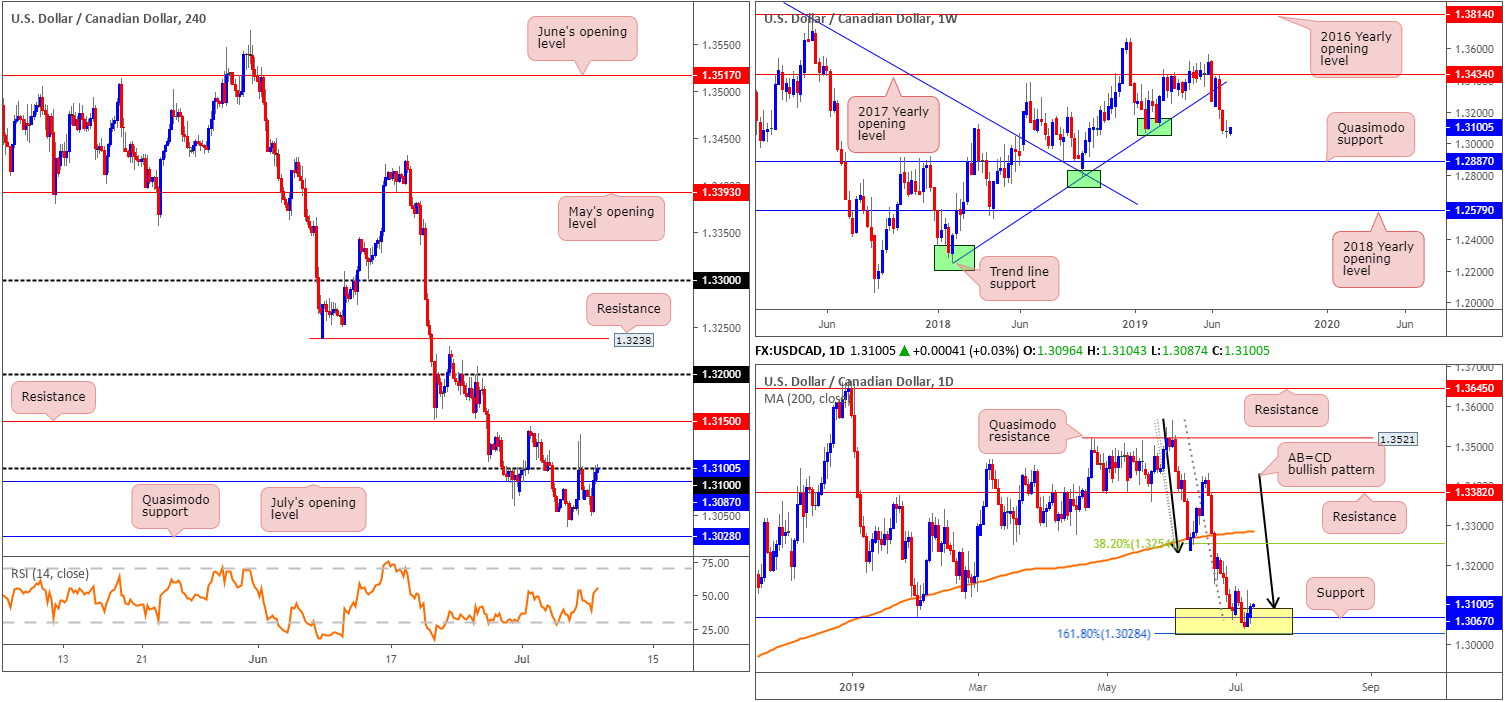
USD/CAD:
The US dollar settled Monday a few points south of 1.31 against the Canadian dollar, following a modest rally. This, according to the technical studies on the daily timeframe, was expected:
In recent weeks, the daily candles entered a particularly interesting area of support between 1.3028/1.3089 (yellow). Comprised of an AB=CD (black arrows) formation at 1.3089, a support at 1.3067 and a 161.8% Fibonacci extension at 1.3028 (forms part of the AB=CD structure), the zone remains defensive. A rotation north from here has the 38.2% Fibonacci retracement value of the A-D legs at 1.3254 to target, which happens to closely unite with the 200-day SMA (orange).
The drawback to continued buying out of the daily support area is, of course, the 1.31 handle, and weekly price:
Following two consecutive weeks of selling, shaped by near-full-bodied bearish candles, price action paused last week by way of an indecision candle. Despite the interruption, limited support is evident on the weekly timeframe until reaching as far south as a Quasimodo formation at 1.2887.
Areas of consideration:
Buying from the current daily support area is an option today, though waiting for the H4 candles to close above 1.31 and retest the level as support, preferably in the form of a bullish candlestick configuration as this sets a foundation to allocate entry and risk levels, is likely the safer route to longs in this market. This would likely unlock the door towards H4 resistance at 1.3150 as an initial take-profit zone on the H4 timeframe, though according to daily structure, specifically the AB=CD formation, the next upside target can be seen around the 38.2% Fibonacci resistance at 1.3254.
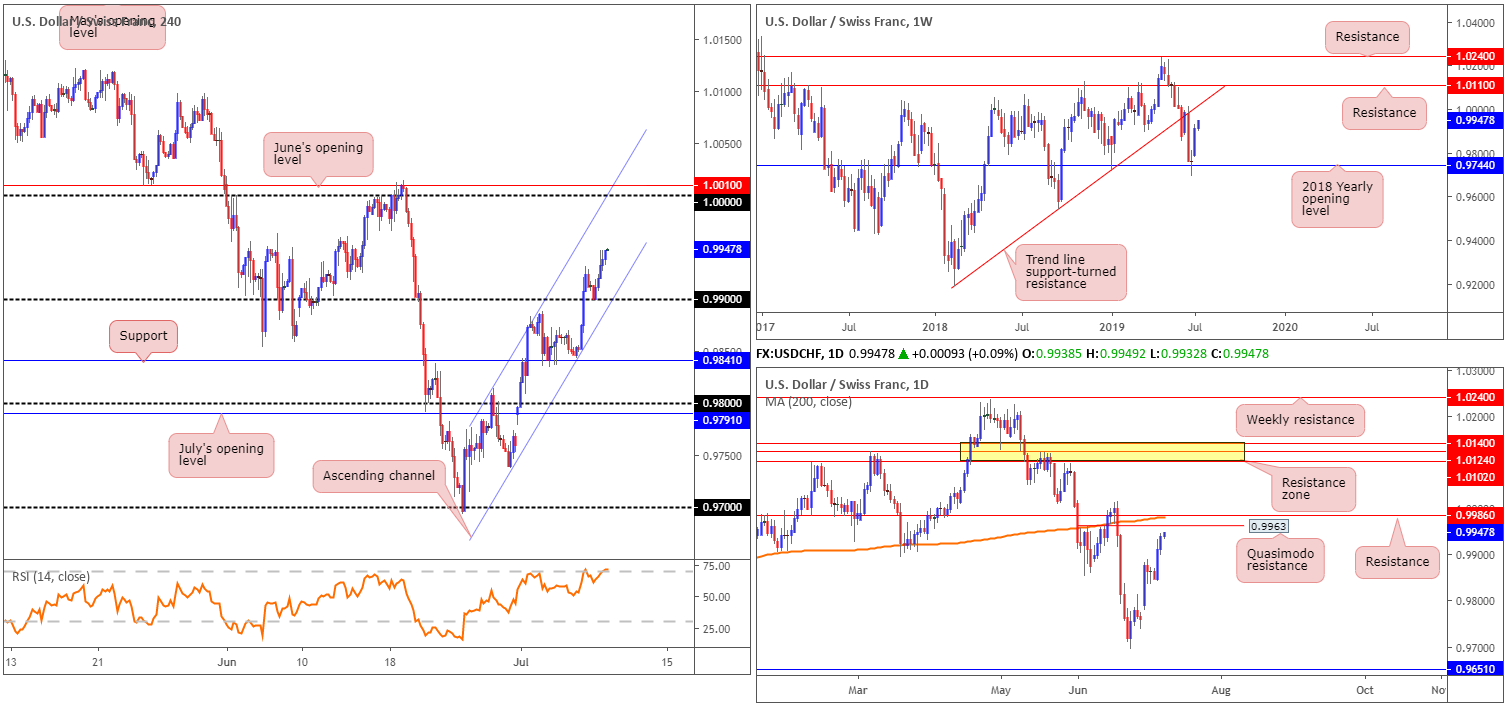
USD/CHF:
The US dollar preserved Friday’s upside momentum derived from upbeat non-farm payrolls data out of the US Monday, following a to-the-point retest of 0.99 as support on the H4 timeframe. Upside, however, is expected to diminish once H4 channel resistance (extended from the high 0.9814) enters the mix, or the key figure 1.0000 (parity).
On to the higher timeframes, Monday’s report had the following to say:
Following a period of indecision off the 2018 yearly opening level at 0.9744, the US dollar turned higher against the safe-haven Swiss franc last week. Further upside, according to technical studies on the weekly timeframe, is a possibility this week, targeting trend line support-turned resistance extended from the low 0.9187.
In terms of where the market stands on the daily timeframe in regard to upside targets, Quasimodo resistance at 0.9963 is in the firing range, closely shadowed by the 200-day SMA and another layer of resistance at 0.9986. It might also be worth noting this area of daily resistance is situated south of the weekly trend line resistance by about 30 points.
Areas of consideration:
For traders who read Monday’s briefing you may recall the following:
Room seen to move higher on all three timeframes this week opens up a potential buying opportunity should H4 candles retest 0.99 as support. A retest of this psychological barrier, preferably in the shape of a H4 bullish candlestick signal (helps site entry and risk levels), has 0.9963 to target as the initial take-profit zone (daily resistance). This leaves ample room to secure satisfactory risk/reward. Well done to any of our readers who managed to long 0.99.
Owing to price recently extending higher:
Selling opportunities also exist between 1.0010/0.9963. Although a reasonably wide zone, it contains a number of notable resistance structures:
- Daily Quasimodo resistance at 0.9963.
- The 200-day SMA around 0.9986.
- Daily resistance at 0.9986.
- 0000 (parity) sited on the H4 timeframe.
- June’s opening level at 1.0010 also on the H4 timeframe.
- H4 channel resistance etched from the high 0.9814.
The accuracy, completeness and timeliness of the information contained on this site cannot be guaranteed. IC Markets does not warranty, guarantee or make any representations, or assume any liability with regard to financial results based on the use of the information in the site.
News, views, opinions, recommendations and other information obtained from sources outside of www.icmarkets.com.au, used in this site are believed to be reliable, but we cannot guarantee their accuracy or completeness. All such information is subject to change at any time without notice. IC Markets assumes no responsibility for the content of any linked site.
The fact that such links may exist does not indicate approval or endorsement of any material contained on any linked site. IC Markets is not liable for any harm caused by the transmission, through accessing the services or information on this site, of a computer virus, or other computer code or programming device that might be used to access, delete, damage, disable, disrupt or otherwise impede in any manner, the operation of the site or of any user’s software, hardware, data or property.


