
A note on lower timeframe confirming price action…
Waiting for lower timeframe confirmation is our main tool to confirm strength within higher timeframe zones, andhas really been the key to our trading success. It takes a little time to understand the subtle nuances, however, as each trade is never the same, but once you master the rhythm so to speak, you will be saved from countless unnecessary losing trades. The following is a list of what we look for:
- A break/retest of supply or demand dependent on which way you’re trading.
- A trendline break/retest.
- Buying/selling tails – essentially we look for a cluster of very obvious spikes off of lower timeframe support and resistance levels within the higher timeframe zone.
- Candlestick patterns. We tend to only stick with pin bars and engulfing bars as these have proven to be the most effective.
EUR/USD:
The EUR/USD gapped sixteen pips higher yesterday, opening at 1.1161. This gap, as you can see was quickly filled, consequently retesting the mid-level number 1.1150 as support and forming a 4hr bullish pin candle to start the day. Following this, however, little action was seen due to the U.S./Canada vacation;the EUR spent the entire day resting on top of 1.1150, which clearly proved worthy support.
On that note, with liquidity set to return to normal today, where do we see price heading? In the event that 1.1150 remains well-bid going into today’s sessions,price will likely rally towards the 1.1200 handle and fake above it to connect with offers sitting around 4hr supply at 1.1242-1.1212.Supporting this, The daily action closed above a daily swap (resistance) level at 1.1148 yesterday, forming a bullish daily pin candle and likely clearing the path north up to 1.1214 – another daily swap (resistance) level. The only downside to this is the fact that price on the weekly timeframe is holding below the underside of weekly supply at 1.1532-1.1278. Yet, this should not really cause too much problems for a small sixty-pip move north from 1.1150 today.
So, to sum up, our team will be looking to take a trade at 1.1150 today if lower timeframe confirming price action is seen. Targets, should all go to plan, will be around the 1.1200 level. That being the case, if you’re unable to find a suitable entry at 1.1150 that offers a small enough stop, we would recommend passing on the trade as ideally you’d want at least 2:1 risk/reward here.
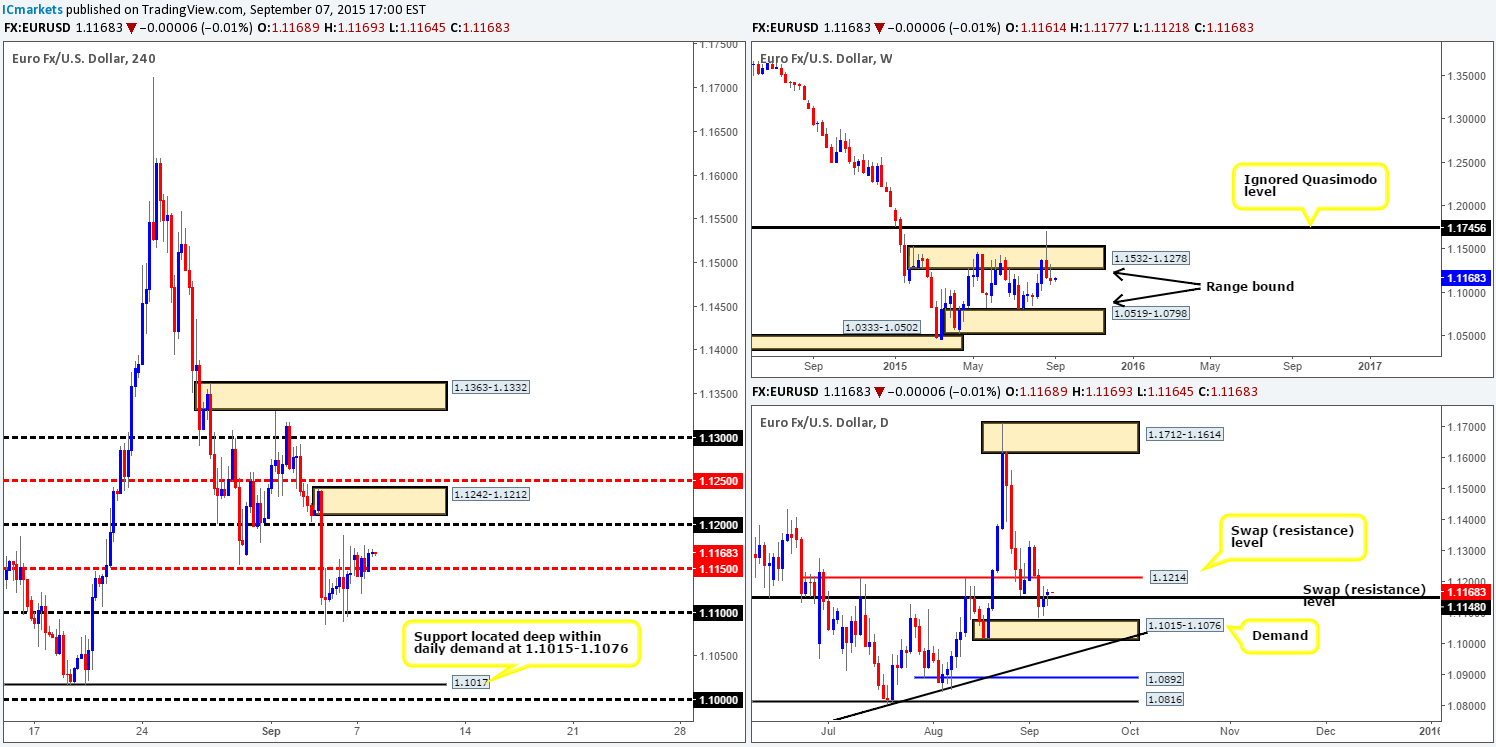
Levels to watch/live orders:
- Buys:1.1150 [Tentative – confirmation required] (Stop loss: dependent on where one confirms this level).
- Sells: Flat (Stop loss: N/A).
GBP/USD:
Following the open 1.5174, a heavy wave of bids piled into this market sending price above 1.5200 and deep into a 4hr swap (supply) area given at 1.5256-1.5294. Considering the overall momentum on this pair has been south since the 25th August, the current area of 4hr supply coupled with round-number resistance above it at 1.5300 makes for a tempting zone to sell from.
Nevertheless, when we throw the higher timeframes into the mix, the directional bias changes somewhat. Weekly action, as far as we see, supports further downside if the recently broken weekly support at 1.5235 holds as resistance. On the flip side, the daily timeframe shows that price held beautifully at daily demand coming in at 1.5088-1.5173 yesterday, consequently bouncing price back into the daily descending channel (1.5929/1.5329).
Given the points above, we are yet to make a decision on where we believe price will head since it effectively could be either way judging from the higher timeframe picture (see above). On that account, here is what we have jotted down so far:
- A close above 1.5300 will likely clear the path north up to 4hr supply at 1.5406-1.5373. The reason being is we see two supply consumption wicks (black arrows) at 1.5929/1.5329 in between these two barriers. To that end, if 1.5300 be consumed, a potential buy on a retest of this number could be a possibility should the lower timeframes also be agreeable.
- In the event that price closes below the minor 4hr low 1.5246, nonetheless, we’re likely heading back down to at least the round-number support 1.5200. And unless one can pin-point a suitable location on the lower timeframes to take advantage of this potential move, we see very little way of entering short.
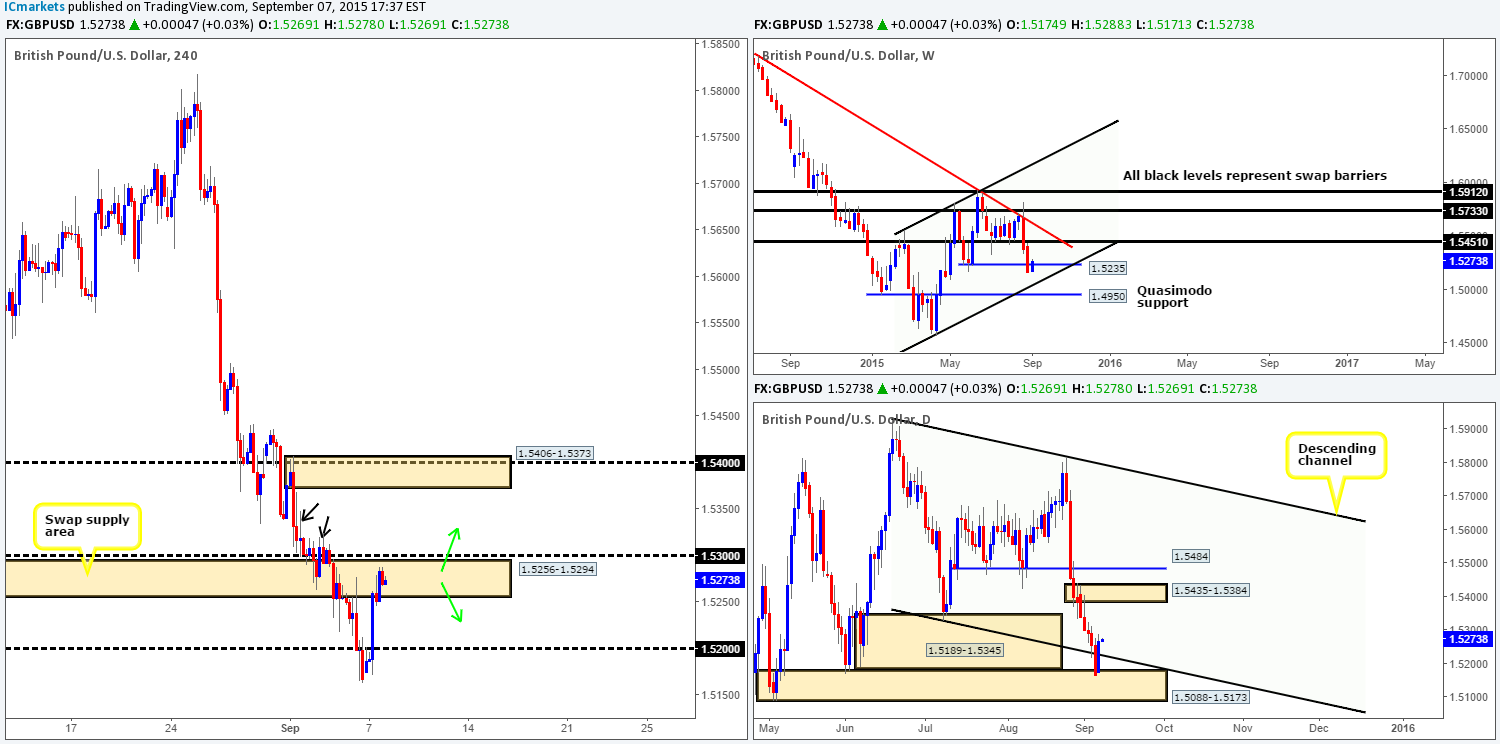
Levels to watch/ live orders:
- Buys: Watch for offers around 1.5300 to be consumed and then look to trade any retest seen at this level (confirmation required).
- Sells: Dependent on price action, there could be a potential short from the 1.5256-1.5294 area today (confirmation required).
AUD/USD:
Yesterday’s trade opened at 0.6927 – nineteen pips higher than Friday’s close (0.6908). From there on, we saw price consolidate in a relatively tight range beneath the mid-level hurdle 0.6950. This lackluster performance was due the U.S. and Canada Labor Day vacation yesterday – lower liquidity usually equates to smaller moves.
Seeing as yesterday’s movement saw very little change to the overall structure of this pair, much of the following analysis will be same as our previous report…
With price still positioned just a stone’s throw away from connecting with a valid 4hr buy zone comprising of: 0.6900, a 4hr descending channel support (0.7030) and also an AB=CD support completing at 0.6980, a certain harmony is being seen in this market. All three timeframes that we follow show price at supportive structures. The weekly resides at demand drawn from 0.6768-0.6942, and the daily also sits just within demand coming in at 0.6768-0.6923. On that account, should we be looking to buy this market? With the AUD still in one stonking great downtrend from back in mid-2011, it’s still very difficult for us to be confident buying this pair. Therefore, to buy from the current 4hr buy zone we’ll need to see very attractive lowertimeframe buying confirmation (30/60 minute) before we’d consider risking capital on this idea.
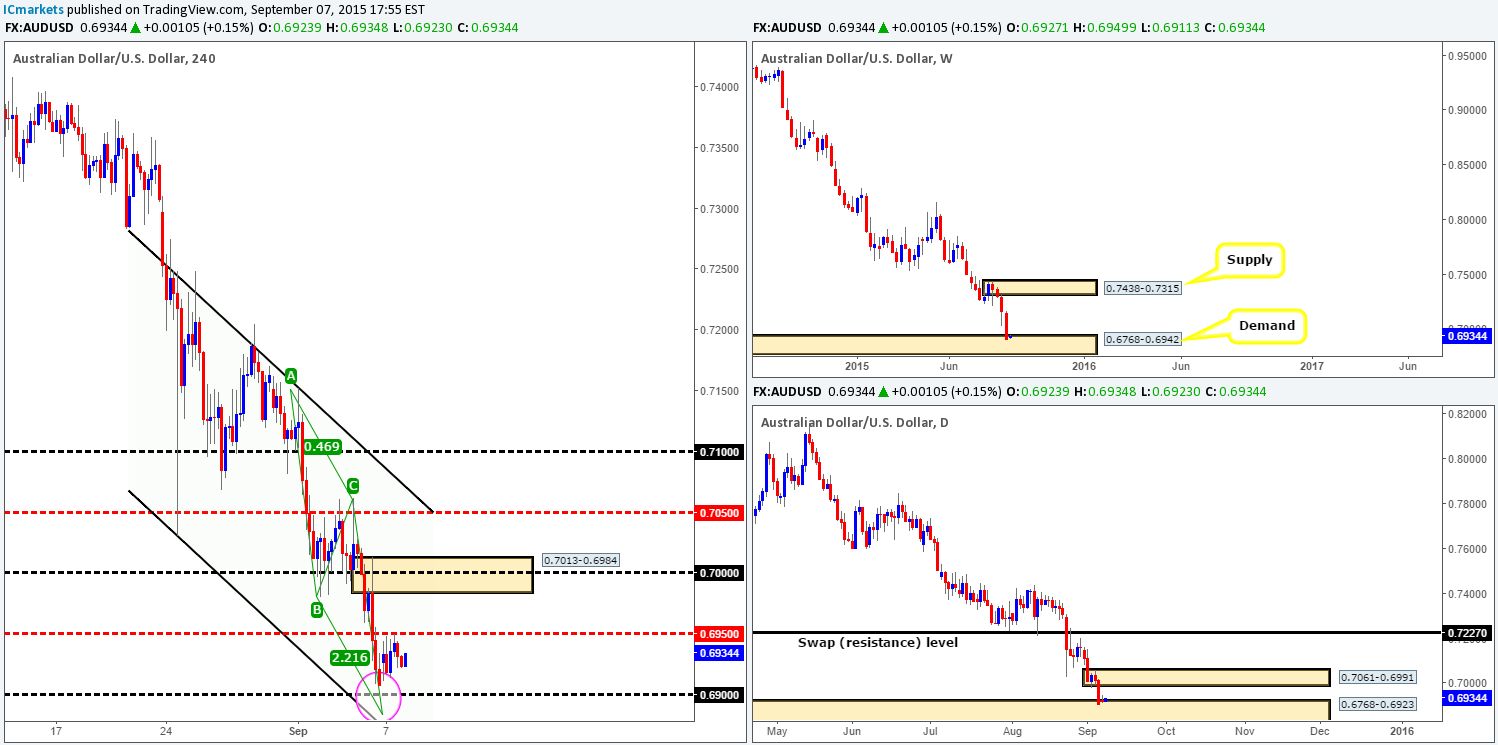
Levels to watch/ live orders:
- Buys: 0.6900/0.6980 [Tentative – confirmation required] (Stop loss: dependent on where one confirms this area).
- Sells: Flat (Stop loss: N/A).
USD/JPY:
A conservative stream of bids flooded into this market shortly after trade opened at 118.92. This, as can be seen from the chart, pushed price firmly above the 119.00 handle, reaching highs of 119.58 on the day.
Given the somewhat dreary action seen during trade yesterday, we still have our beady little eye on 118.38/118.00 for buy trades this week for the following reasons:
- Potential support from the daily timeframe lurks around the 118.38 region.
- A near-perfect 4hr Harmonic AB=CD pattern is in the process of forming and completes just below 118.38 at 118.20.
- 61.8% Fibonacci support coming in around the 118.23 region.
- Just below these three barriers is the psychological support 118.00. Now, you know if we were to enter long at the AB=CD completion zone, price would almost guaranteed fake below to 118.00 taking us out of the trade, hence the inclusion of this number in our 4hr buy zone.
Like we mentioned in our previous analysis http://www.icmarkets.com/blog/monday-7th-september-weekly-technical-outlook-and-review/ , the only grumble we have entering long from here is the possible weakness around the current weekly support zone at 118.22-119.25. The sharp pin seen stabbing through this area two weeks ago (black arrow) likely consumed a ton of active bids within this vicinity. Ultimately though, we do not believe this will be enough to stop price from at least giving a profitable bounce from the 4hr buy zone due to its impressive converging structures.
That being the case, what we’re looking for today is a break below 119.00, as this will likely confirm, if price holds below this number of course, that we’re likely going to see price head towards our 4hr buy zone. We have placed an alert at 118.47, which if triggered, will be our cue to begin watching for lower timeframe buying confirmation. Should the above come to fruition, partial profits will be taken at 119.00.
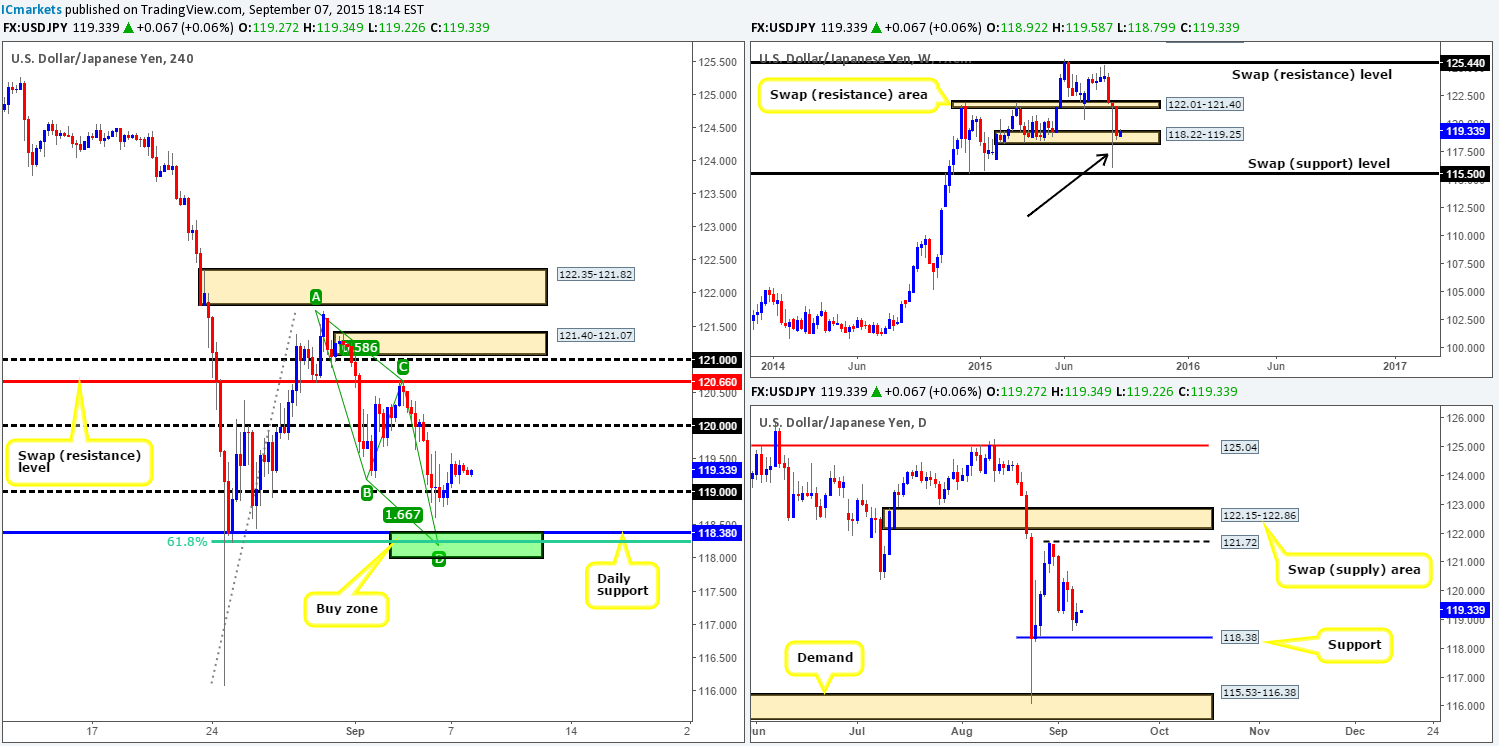
Levels to watch/ live orders:
- Buys: 118.38/118.00 [Tentative – confirmation required] (Stop loss: dependent on where one confirms this region).
- Sells:Flat (Stop loss: N/A).
USD/CAD:
The open 1.3273 saw price retest the mid-level number 1.3250 as support early on in yesterday’s trade before aggressively rallying north. This recent buying appears to have taken out offers around the 1.3300 number, which also converged nicely with a 4hr descending channel resistance (1.3352/1.3142). As you can see, price is currently retesting this recently broken area as support. In the event that the buyers manage to hold this market above here, we could see price continue north towards 1.3350 today.
Supporting this possible move, there’s little overhead resistance seen on the weekly timeframe until 1.3381 –a weekly swap (resistance) level. On the daily timeframe, however, there was a little resistance seen last week around the 1.3290 mark. However, yesterday’s buying likely put an end to this as price closed above this number, and assuming that the buyers hold their ground here, the path now seems relatively free up to supply coming in at 1.3530-1.3405.
In conclusion, our team is going to be keeping a close eye on how price behaves around the 1.3300 region today. Should lower timeframe buying strength be seen and the opportunity to enter long with a relatively small stop presents itself, we’ll jump in long targeting 1.3350.

Levels to watch/ live orders:
- Buys:Watch for offers around 1.3300 to be consumed and then look to trade any retest seen at this level (confirmation required).
- Sells: Flat (Stop loss: N/A).
USD/CHF:
Although the market remained relatively well-bid throughout the day, price did not leave the confines of the present 4hr range comprising of a 4hr supply at 0.9788-0.9755 and a 4hr demand at 0.9681-0.9705. Therefore, much of the following analysis will remain similar to the previous…
As far as we can see, the overall structure of this pair can be summed up as follows:
- Weekly action close to hitting resistance coming in at 0.9796.
- Price on the daily chart is nibbling at offers around the underside of daily supply given at 0.9797-0.9740.
- 4hr timeframe shows price now trading at the upper limit of the current 4hr range.
Given the points made above, our attention will be mostly driven toward shorts this week mainly due to where price is positioned on the weekly and daily charts (see above). However, our team has no interest in shorting at the current 4hr supply zone. The reason for why comes from the psychological resistance 0.9800 lurking just above. This number, in our opinion, provides a perfect fakeout barrier above the 4hr zone as it not only lines up with the aforementioned weekly swap (resistance) level, but is also located deep within the above said daily supply zone.
As attractive as 0.9800 may seem though, we cannot expect price to react to-the-pip here – a fakeout above this figure is also likely. The reason being is that well-funded traders know uninformed traders place their stops close to big-figure numbers – and stops equals liquidity. As such, if our analysis is correct and price heads towards 0.9800, we’d recommend waiting for the fakeout to take place first before jumping in the market here.
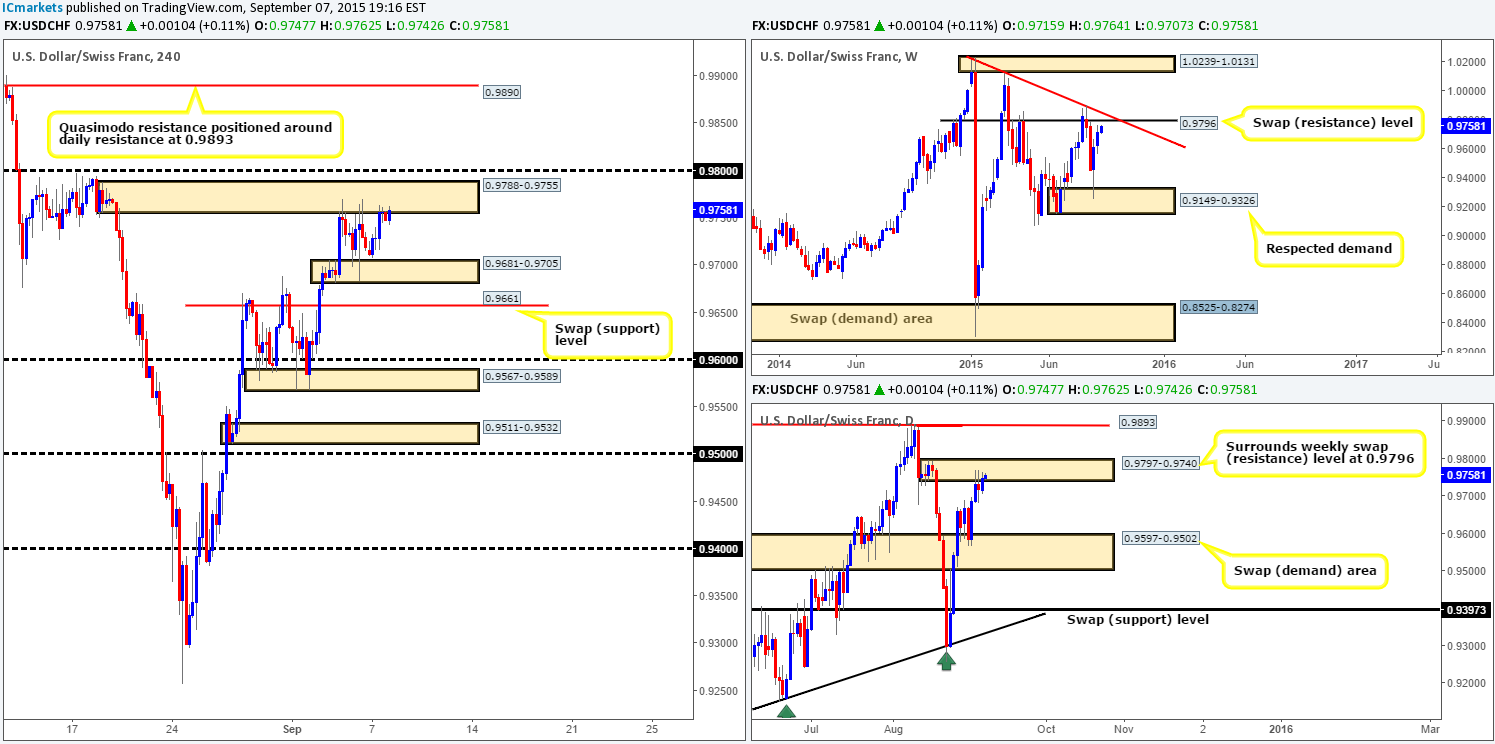
Levels to watch/ live orders:
- Buys: Flat (Stop loss: N/A).
- Sells:0.9800 [Tentative – confirmation required] (Stop loss: dependent on where one finds confirmation at this level).
DOW 30:
(Slightly revised from Monday’s report)
Looking at the 4hr chart, we can see that a relatively heavy round of bids came into this market during yesterday’s session reaching highs of 16287 on the day.
As you can see, intraday resistance around the 16245 region is currently holding this market lower. And in all honesty, we’d like to see it carry on this way going into today’s trade as we have our eye on the daily support level coming in at 15723 for buys today. The reason we’ve selected 15723 comes down to its converging structures seen on the 4hr timeframe:
- Price is in the final stages of completing a near-perfect 4hr Harmonic Gartley pattern that terminates lower around the daily swap (support) level at 15723 (pink circle).
- 61.8% Fibonacci support resides at 15765 (just above the aforementioned daily support) taken from the low 15193.
However, should 16245 give way today, the market will likely be forced north back up to retest the 4hr swap (resistance) level at 16475. Supposing this happens, we would then discount the credibility of the aforementioned 4hr Harmonic Gartley pattern, since we like to see symmetry in play within these Harmonic setups.
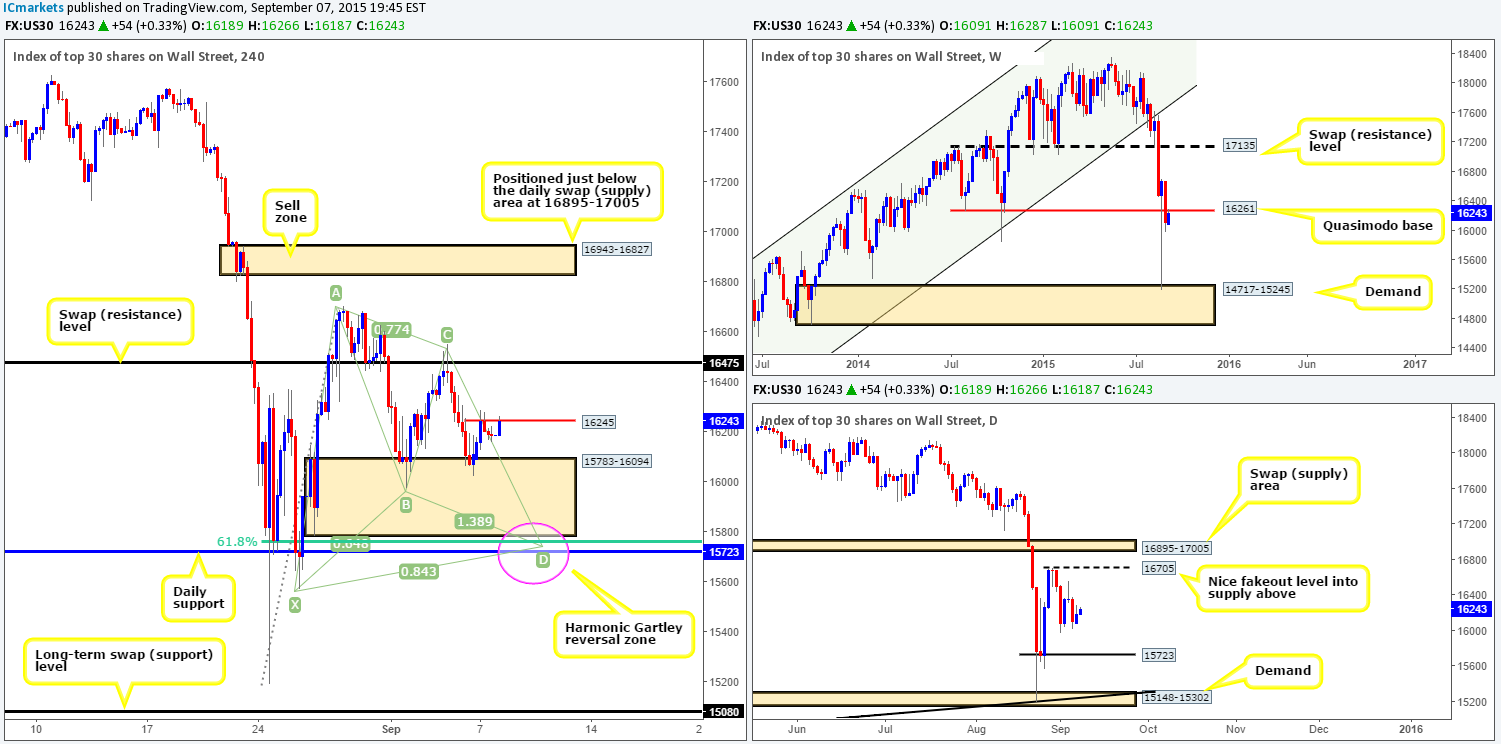
Levels to watch/ live orders:
- Buys: 15723 region [Tentative – confirmation required] (Stop loss: depends on where one confirms this area).
- Sells:Flat (Stop loss: N/A).
XAU/USD: (Gold)
During the course of yesterday’s sessions, the most noteworthy change was seen just before the close. Price stabbed below Fridays low at 1116.7 and successfully connected with bids sitting around 4hr demand at 1109.4-1116.1.
The bounce from this zone should not really come as much of a surprise considering that the daily timeframe also shows price lurking within demand at 1109.4-1122.7. Why did we not consider trading this? Well, there are two reasons. The first comes from seeing the weekly action closing below a weekly swap (support) level at 1130.1 last week. The second is simply because above the 4hr demand shows a fair amount of wood to chop through before it can run free.
As you can see, technical elements from the weekly and daily charts do not really align leaving us with little choice to remain flat. Granted, we were tempted to trade the current 4hr demand zone, but going against our rules within our trade plan is not what trading is all about. TAKE ONLY the very best setups which you have defined as an opportunity, and a loss will not be as painful!
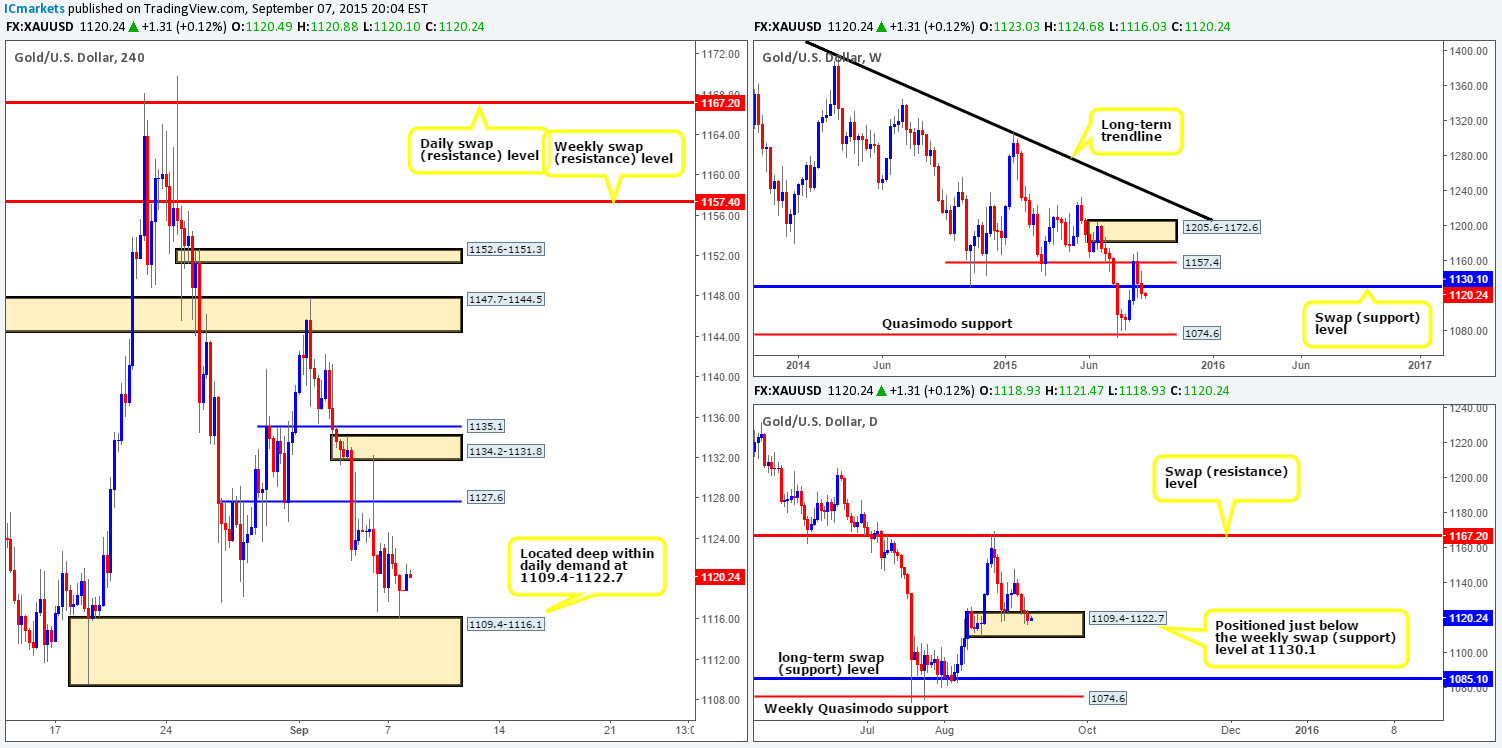
Levels to watch/ live orders:
- Buys: Flat (Stop loss: N/A).
- Sells:Flat (Stop loss: N/A).


