(U.S/Canada Labor Day bank holiday today)
A note on lower timeframe confirming price action…
Waiting for lower timeframe confirmation is our main tool to confirm strength within higher timeframe zones, and has really been the key to our trading success. It takes a little time to understand the subtle nuances, however, as each trade is never the same, but once you master the rhythm so to speak, you will be saved from countless unnecessary losing trades. The following is a list of what we look for:
- A break/retest of supply or demand dependent on which way you’re trading.
- A trendline break/retest.
- Buying/selling tails – essentially we look for a cluster of very obvious spikes off of lower timeframe support and resistance levels within the higher timeframe zone.
- Candlestick patterns. We tend to only stick with pin bars and engulfing bars as these have proven to be the most effective.
EUR/USD:
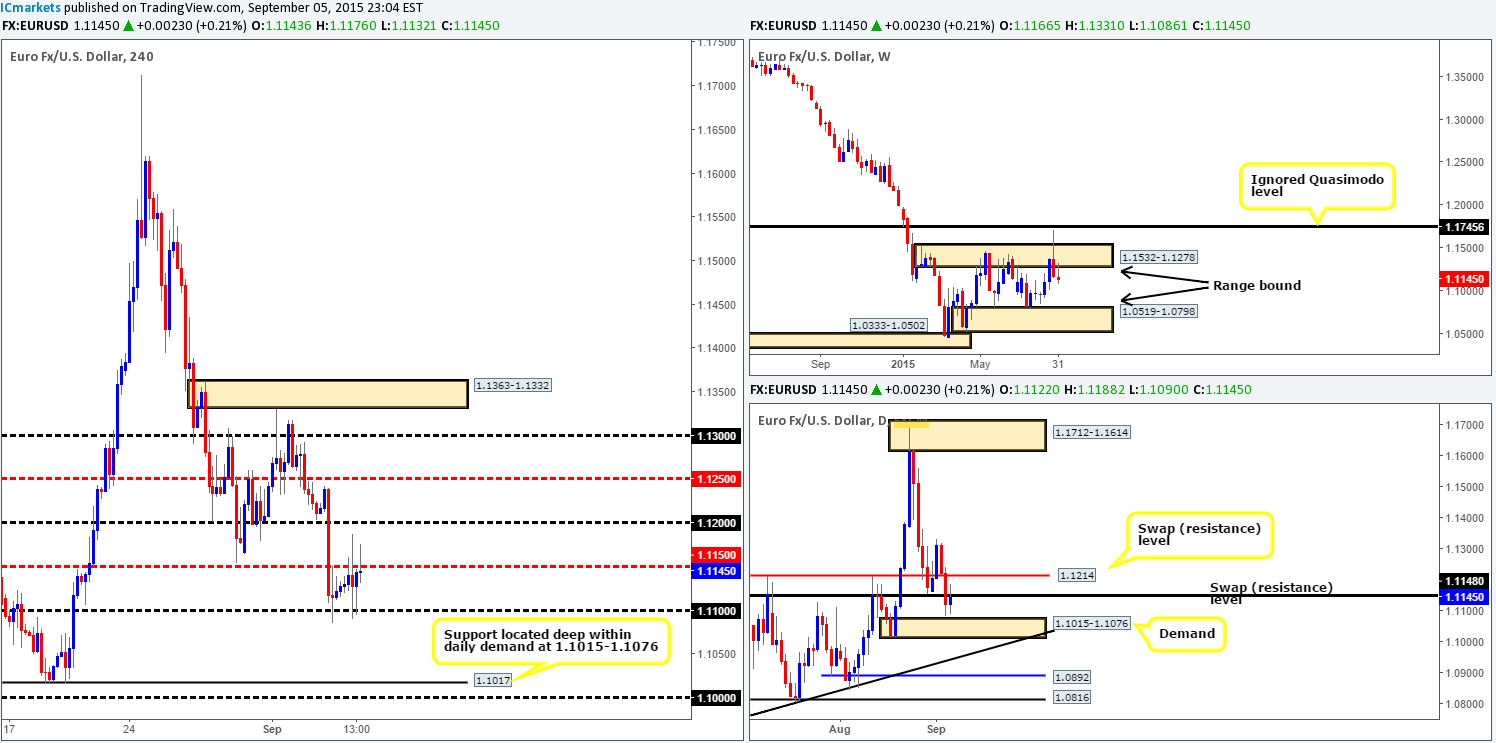
Weekly view: Following the spike above weekly supply at 1.1532-1.1278, the sellers managed to hold this market lower last week by pinning the underside of the above said weekly area. As a result, the EUR currency erased a little over thirty pips of value into the close 1.1145. Given the lack of buying interest here, this week’s action may see price drive itself back into the weekly consolidation zone, comprising of the aforementioned weekly supply and a weekly demand at 1.0519-1.0798.
Daily view: From this angle, we can see that Wednesday and Thursday was certainly a sellers’ market. Bids were consumed at both 1.1214 and 1.1148 dragging price down to within a cat’s whisker of hitting a fresh daily demand zone at 1.1015-1.1076. Friday, however, saw a counter-attack of sorts, closing just below 1.1148 (support-turned resistance) finishing the week printing somewhat of a daily indecision candle.
4hr view: Friday’s bit hitter – the nonfarm payrolls came in at 173k, missing expectations of 215k. Despite this, the unemployment rate fell to 5.1% vs. 5.2% expectations, and average earnings rose to 0.3%. This mixed bag of data showed uncertainty within the market, and the 4hr and daily charts (see above) resembled this.
Price pierced psychological support 1.1100 twice during Friday’s trade, but failed to close above the mid-level barrier 1.1150. Due to price conducting most of its trade within a fifty-pip range especially during volatile events such as the NFP, this was, in our opinion, a very, very uncertain market.
So, let’s see what we have here:
- Weekly chart shows price held below weekly supply.
- Daily action lodged beneath a daily swap (resistance) level.
- Price on the 4hr timeframe is sandwiched between 1.1100/1.1150.
Judging from the above points, we think it’s fair to say that this is a bearish market for the time being. In spite of this, we see very little opportunity at the moment to sell on the 4hr timeframe that offers a reasonable enough risk/reward. To that end, we’re left with waiting for a break below 1.1100, which could open the gates for further downside to 4hr support at 1.1017. However, with this, we’d agree that although we’d be selling in line with the weekly timeframe, we’d also be shorting into DAILY DEMAND (see above)!
With there clearly being little room to move, and the fact that the U.S. and Canada are on vacation today, our team will remain flat during today’s action.
Levels to watch/live orders:
- Buys: Flat (Stop loss: N/A).
- Sells: Flat (Stop loss: N/A).
GBP/USD:
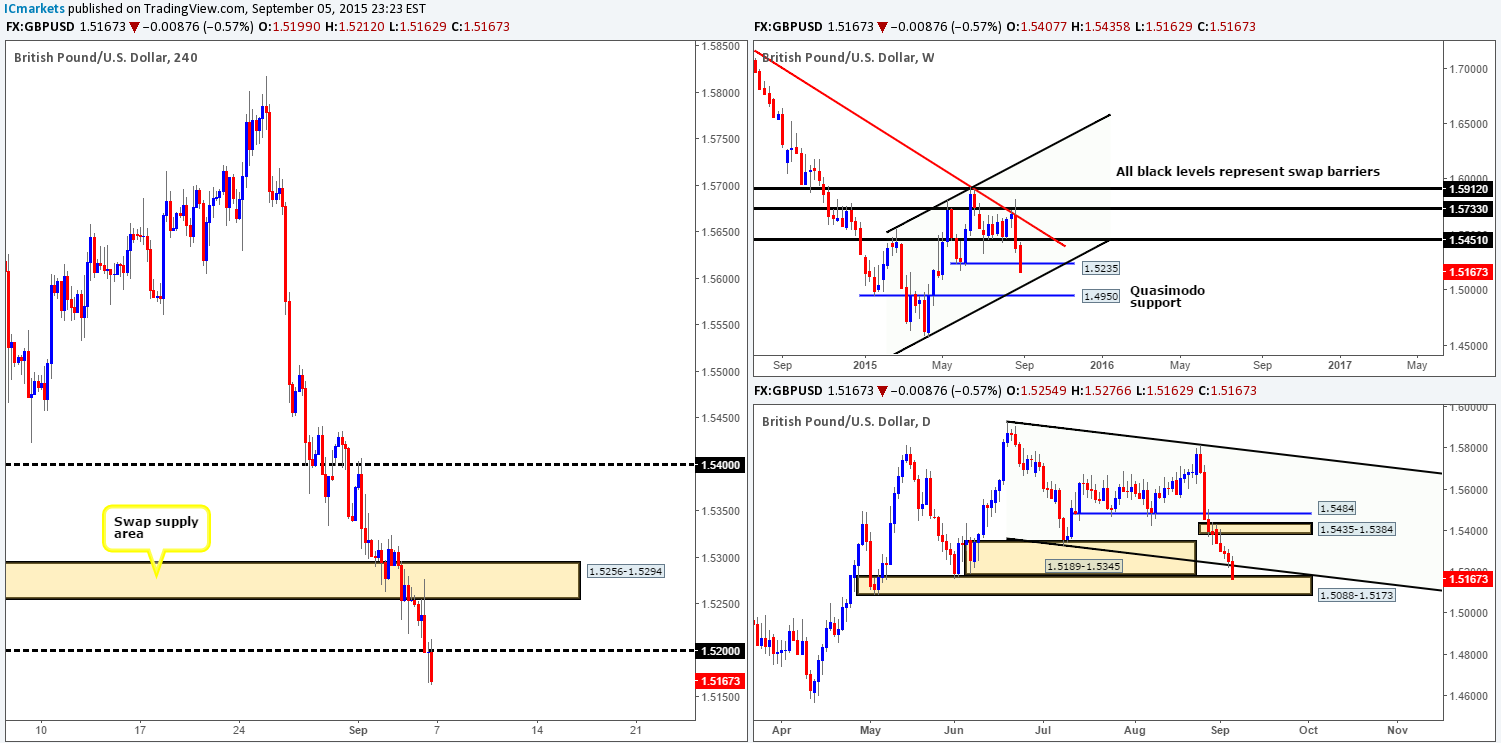
Weekly view: Pound Sterling sustained further losses for a second straight week, erasing a little over 215 pips. This decline in value saw the pair plow through bids around weekly support at 1.5235, and close on its lows at 1.5167. The break of this weekly level has very likely opened the gates for price to challenge the weekly ascending channel support extended from the low 1.4564 this week.
Daily view: As we already know from the weekly scale, price moved in one direction last week – south! After the market took out bids sitting at not only the daily descending channel support (1.5329), but also daily demand at 1.5189-1.5345, price slam dunked itself into another daily demand at 1.5088-1.5173.
4hr view: Cable was relatively quiet up until the NFP release on the 4hr timeframe. As you can see, price initially spiked higher to fill unfilled offers around the 4hr swap (supply) area at 1.5256-1.5294 before selling off below psychological support 1.5200 to end the week.
To the far left of current price, check out the 4hr tails at 1.5166/1.5162/1.5149. These spikes south represent consumed demand in our opinion, suggesting the market may continue to sell-off today/this week. The next logical support structure on the 4hr timeframe is visible at 1.5114 – a 4hr Quasimodo support level which has fantastic swap level history.
In a nutshell, the structure of this pair can be boiled down to the following:
- The weekly chart reveals that there is little stopping this market from dropping further this week.
- The daily chart shows that the buyers and sellers are now battling for position at the top-side of daily demand at 1.5088-1.5173.
- The 4hr chart, like the weekly chart, also shows room to continue lower this week, but only until around the 1.5114 mark.
With the above in mind, our attention will mostly be driven to 1.5200 and the 4hr Quasimodo support at 1.5114. The reason we’re watching 1.5200 today simply comes down to the both the weekly and 4hr timeframes showing relatively clear paths south. Lower timeframe selling confirmation will be needed to short at this level because we’re also trading around daily demand at 1.5088-1.5173.
On the flip side, we’re also going to be keeping an eye on 1.5114. This level, as already mentioned, has historical significance and is also lodged deep within the above said daily demand. Like 1.5200 though, we are also going to need lower timeframe buying confirmation at this barrier as buying from here potentially puts you against weekly sellers.
Levels to watch/ live orders:
- Buys: 1.5114 [Tentative – confirmation required] (Stop loss: dependent on where on confirms this level).
- Sells: 1.5200 [Tentative – confirmation required] (Stop loss: dependent on where on confirms this level).
AUD/USD:
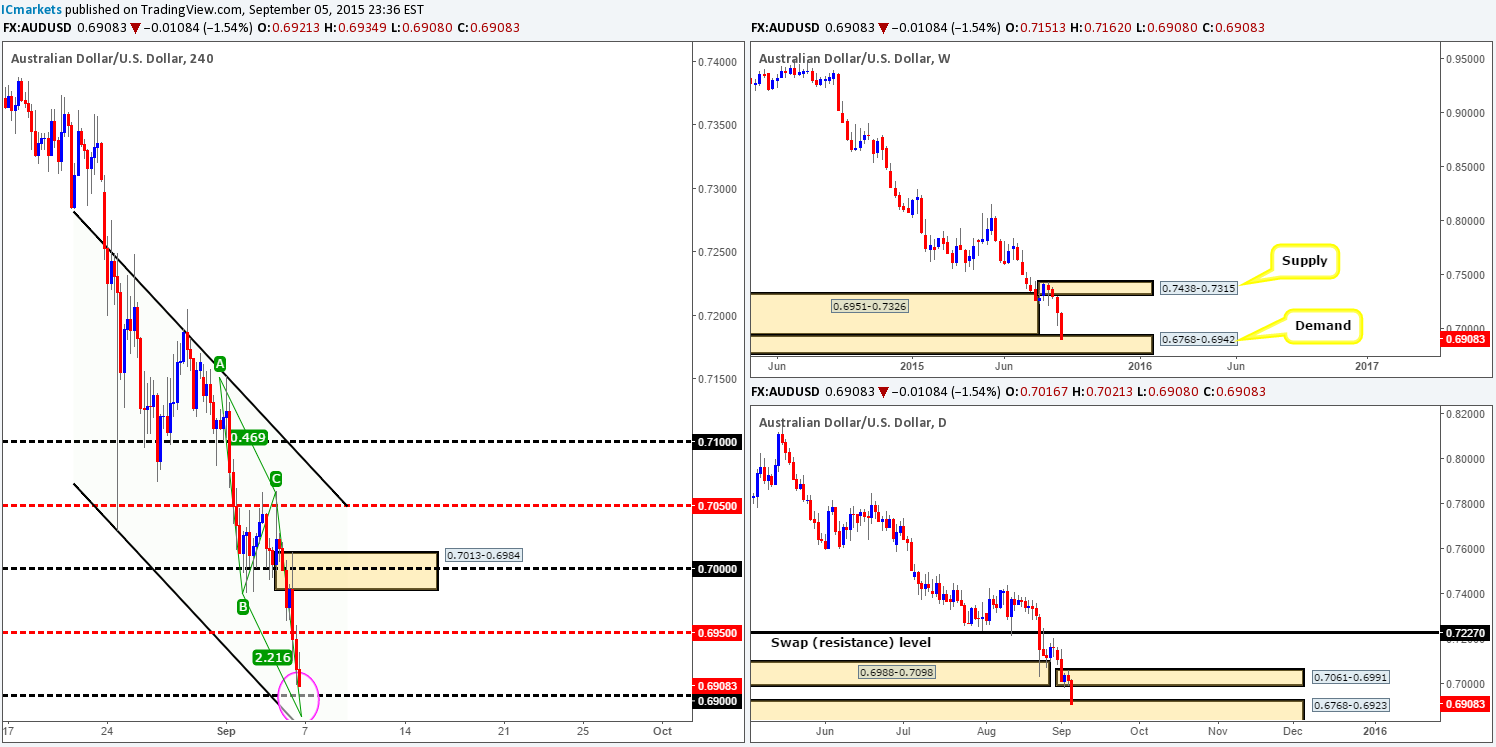
Weekly view: The AUD/USD pair suffered a nasty decline in value last week, losing a little over 250 pips into the close 0.6908. This assault ended with price taking out a large weekly demand at 0.6951-0.7326, and connecting with a small weekly demand just below it at 0.6768-0.6942. In the event that the buyers manage to hold this never-ending downside momentum from here, we may see a correction up to weekly supply coming in at 0.7438-0.7315.
Daily view: Moving down to the daily timeframe, it is clear to see that the recent decline took out daily demand at 0.6988-0.7098, and slammed into another daily demand zone just below at 0.6768-0.6923 (Located deep within weekly demand mentioned above at 0.6768-0.6942). The next upside target from this base falls in at a small link-like daily supply zone drawn from 0.7061-0.6991.
4hr view: Mid-way through Friday’s London session – NFP news time, price spiked north tagging in offers around the large psychological resistance 0.7000, which sent this market tumbling south. During this sell-off, the mid-level support 0.6950 was taken out and retested as resistance, forcing the AUD to close the week just above the 0.6900 handle.
In that price is now positioned just above a potential buy zone (pink circle), comprising of 0.6900, a 4hr descending channel support (0.7030) and also an AB=CD support completing at 0.6980, a certain harmony is being seen in this market. All three timeframes that we follow show price at supportive structures (see above in bold). On that account, should we be looking to buy this market? With the AUD still in one stonking great downtrend from back in mid-2011, it’s still very difficult for us to be confident buying this pair. Therefore, buying from the current 4hr buy zone will need to see very attractive lower timeframe buying confirmation (30/60 minute) before we’d consider risking capital on this idea. Depending on how price reacts at this base will determine how we’ll trade this pair further on in the week.
Levels to watch/ live orders:
- Buys: 0.6900/0.6980 [Tentative – confirmation required] (Stop loss: dependent on where one confirms this area).
- Sells: Flat (Stop loss: N/A).
USD/JPY:
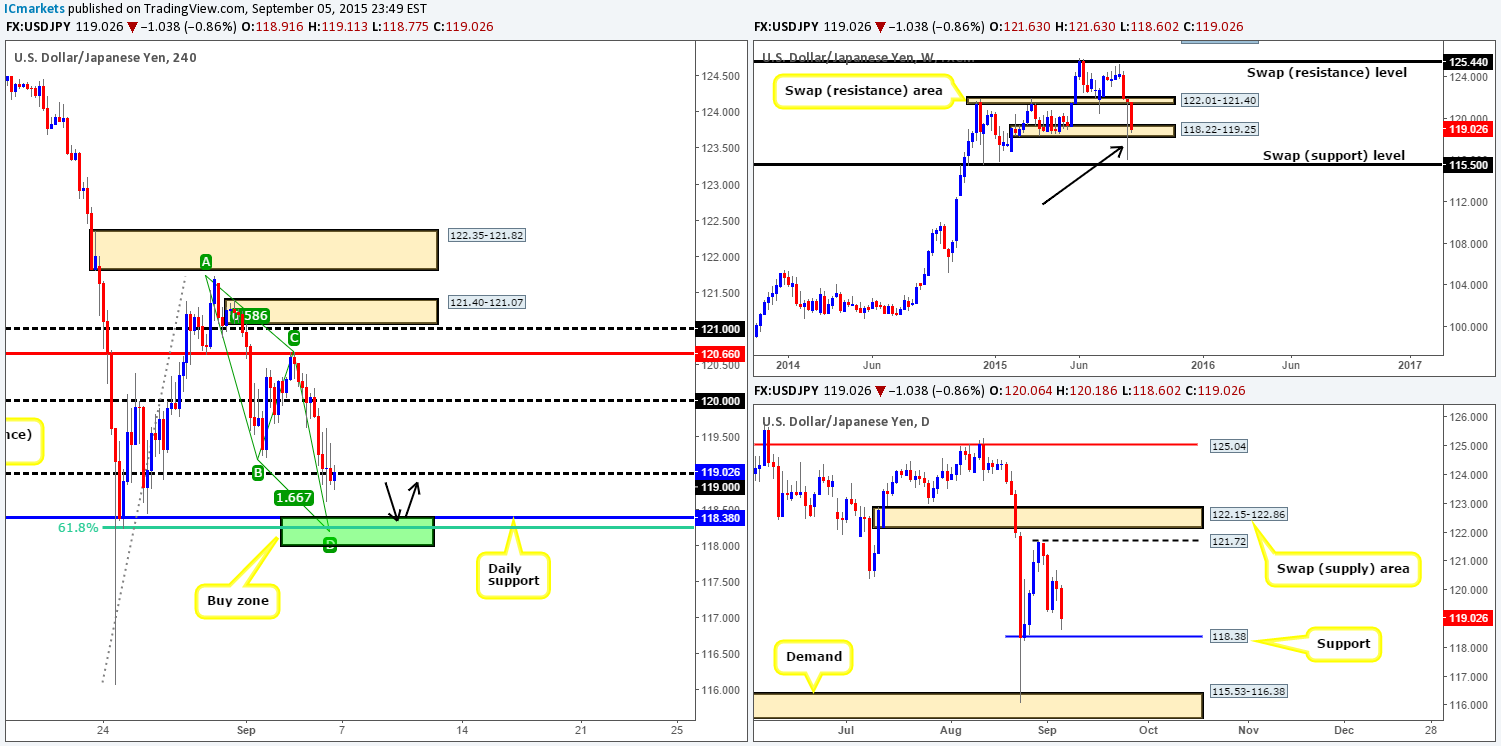
Weekly view: Last week’s action saw the USD/JPY plummet south, which, as can be seen from the chart, pushed prices down to test a weekly support barrier coming in at 118.22-119.25. Consequent to this, the pair shredded close to 270 pips off its value into the close 119.02. Given the ferocity of the prior week’s pin-bar (black arrow) through this weekly support, we remain unsure how many active bids remain within this vicinity.
Daily view: Branching lower to the daily chart, it is clear to see that during Wednesday’s trade, price drew support from 119.21, reaching highs of 120.68 on Thursday. Friday’s action, however, swallowed any gains seen From Wednesday’s initial push and closed the week above a potential daily support level at 118.38.
4hr view: Other than the sharp sell-off early on during Friday’s trade, 4hr price action was quiet throughout the NFP release as price spent much of its time munching on bids/offers around the 119.00 psychological level.
Taking into consideration the points made above, our team has their eye on 118.38/118.00 for buy trades today/this week. Here’s why:
- Potential support from the daily timeframe lurks around the 118.38 region.
- A near-perfect 4hr Harmonic AB=CD pattern is in the process of forming and completes just below 118.38 at 118.20.
- 61.8% Fibonacci support coming in around the 118.23 region.
- Just below these three barriers is the psychological support 118.00. Now, you know if we were to enter long at the AB=CD completion zone, price would almost guaranteed fake below to 118.00 taking us out of the trade, hence the inclusion of this number in our 4hr buy zone.
The only grumble we have entering long here is the possible weakness at the current weekly support zone mentioned above at 118.22-119.25. However, a bounce will still likely be seen from the 4hr buy zone due to its impressive converging structures. That being the case, we have placed an alert at 118.47, which if triggered, will be our cue to begin watching for lower timeframe buying confirmation within and around the 4hr buy zone. Should the above come to fruition, partial profits will be taken at 119.00.
Levels to watch/ live orders:
- Buys: 118.38/118.00 [Tentative – confirmation required] (Stop loss: dependent on where one confirms this region).
- Sells: Flat (Stop loss: N/A).
USD/CAD:
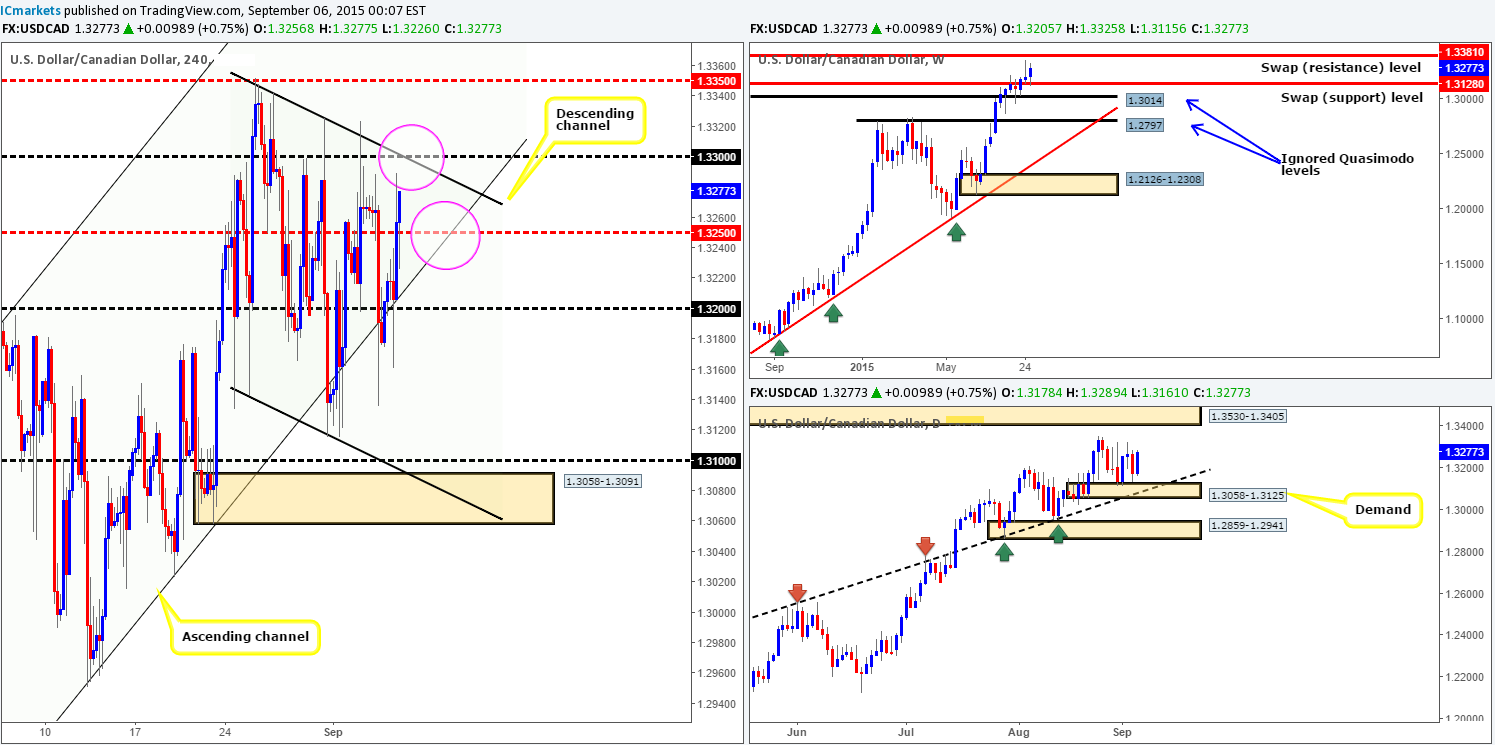
Weekly view: The USD/CAD enjoyed another relatively successful week, increasing its value by a further 80 pips. Trade action saw price once again retest the weekly swap (support) level at 1.3128, but unlike the week prior, this time the candle finished positively at 1.3277. With the trend on this pair still pointing north, the next upside target to be aware of on this timeframe is the weekly swap (resistance) level at 1.3381. This will likely be tested should the market remain well-bid this week.
Daily view: There’s not much to say on the daily timeframe to be honest. The pair remains hovering above daily demand at 1.3058-1.3125, and is, as can be seen from the chart, struggling to overcome a ceiling of offers positioned around the 1.3290 mark. In the event that 1.3290 is taken out this week, we’ll be looking for price to head in the direction of daily supply coming in at 1.3530-1.3405 (located above the aforementioned weekly swap [resistance] level).
4hr view: The NFP numbers made little difference to the overall structure of this pair. Following the close above the 1.3200 handle, we saw price violently retest this number during NFP sending prices above mid-level resistance 1.3250 reaching highs of 1.3289 on the day.
At present, price appears to be compressed between two coinciding trendlines (pink circles) from opposing 4hr channels (1.3352/1.2536). However, due to this pair still trending north, and the recent bounce off of a weekly swap (support) barrier (see above), we think a break above 1.3300 is more likely going to be seen today/tomorrow. With that being said though, price may still drop lower today and retest the 1.3250 region for extra buyers to push higher, so do be prepared for this.
Should the above (in bold) play out our team will begin watching for any confirmed retest seen at 1.3300, since this is not just a round number but also temporary daily resistance – now support (see above).
Just to be clear here, our team has no interest trading in between these two colliding trendlines – there is just not enough room for price to give reasonable enough risk/reward.
Levels to watch/ live orders:
- Buys: Watch for offers around 1.3300 to be consumed and then look to trade any retest seen at this level (confirmation required).
- Sells: Flat (Stop loss: N/A).
USD/CHF:
Weekly view: Following the rebound from weekly demand at 0.9149-0.9326 price extended higher last week, gaining a little over 100 pips into the close 0.9719. Consequent to this, the pair is now looming eighty or so pips below a weekly swap (resistance) level at 0.9796.
Daily view: From Wednesday onwards. We saw the USD/CAD spring board itself north from a daily swap (demand) area at 0.9597-0.9502, eventually reaching daily supply at 0.9797-0.9740 on Thursday. Little response has yet to be seen from this barrier which surrounds the aforementioned weekly swap [resistance] level. In fact, the week ended printing a daily indecision candle just below it.
4hr view: For anyone who follows our analysis on a regular basis http://www.icmarkets.com/blog/friday-4th-september-fasten-your-seatbelts-traders-its-nfp-day-today/ you may recall that we expected price to drift south from 4hr supply at 0.9788-0.9755 to test bids at 4hr demand drawn from 0.9788-0.9755. As we can all see, this did happen and price held firm. The less-than-impressive NFP numbers saw price shoot back up to the 4hr supply which once again held steady, finishing the week mid-range between the two above said 4hr zones.
In essence, here are the nuts and bolts of what we’re looking at:
- Weekly action close to hitting resistance coming in at 0.9796.
- Price on the daily chart is nibbling at offers around the underside of daily supply given at 0.9797-0.9740.
- Mid-range action on the 4hr timeframe between supply at 0.9788-0.9755 and demand coming in at 0.9681-0.9705.
Given the points made above, our attention will be mostly driven toward shorts this week mainly due to where price is positioned on the weekly and daily charts (see above). Here is how we see it playing out… Price will likely continue to range today due to the U.S. and Canada being on vacation. Further into the week, however, price will likely fake above the current 4hr supply into the jaws of 0.9800. 0.9800 is, in our opinion, a perfect fakeout barrier as it not only lines up with the aforementioned weekly swap (resistance) level, but is also located deep within the above said daily supply zone.
As attractive as 0.9800 may seem, that is all it is – a LEVEL. Therefore, we cannot expect price to react to-the-pip here – a fakeout above this number is likely, as well-funded traders know that uninformed traders place their stops close to big-figure numbers –great for liquidity. As such, if our analysis is correct and price heads towards 0.9800, we’d recommend waiting for the fakeout to take place first before jumping in the market here.

Levels to watch/ live orders:
- Buys: Flat (Stop loss: N/A).
- Sells: 0.9800 [Tentative – confirmation required] (Stop loss: dependent on where one finds confirmation at this level).
DOW 30:
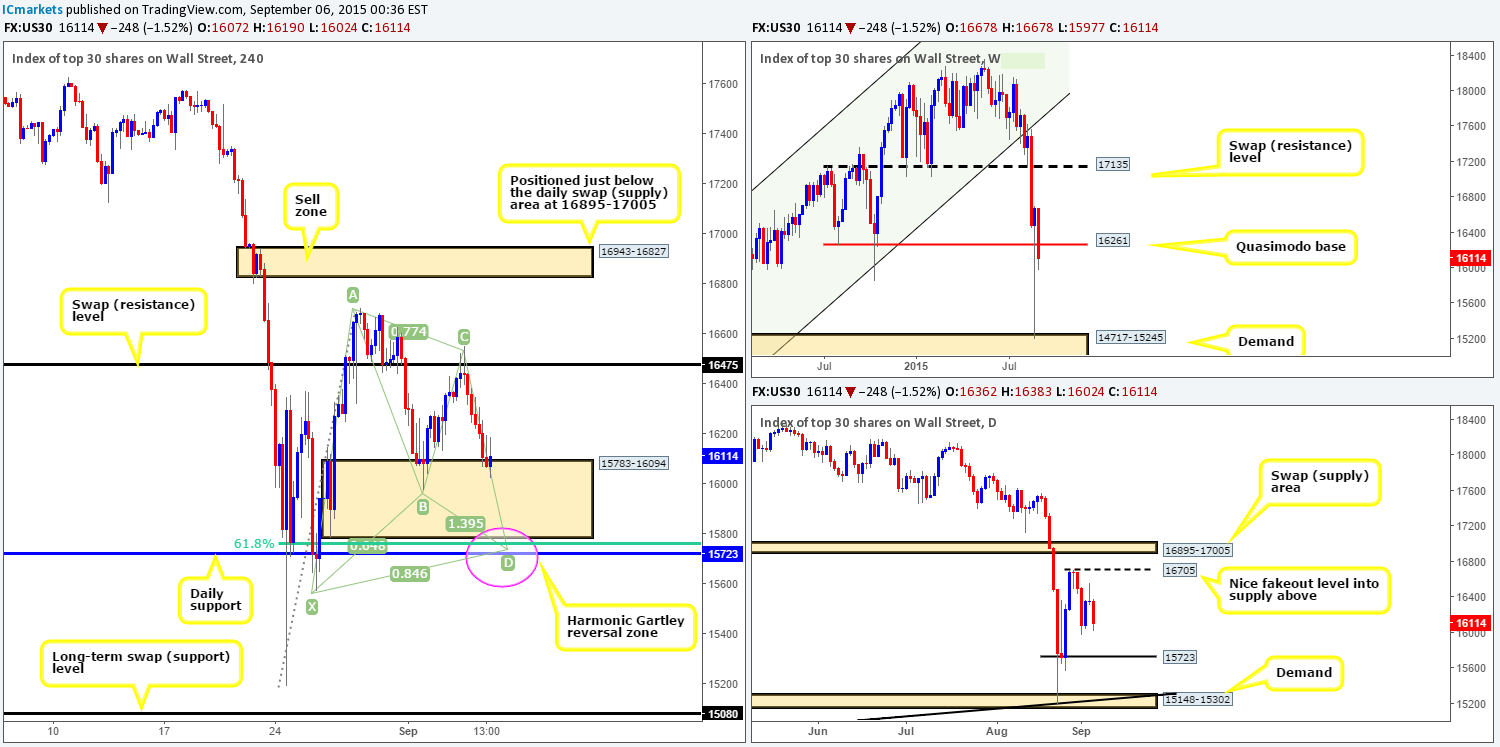
Weekly view: From this angle, we can see that the weekly pin-bar candle that formed two weeks prior saw absolutely no follow-through buying last week. Instead, price tumbled over 560 points into the close 16114, consequently closing below a weekly Quasimodo support level at 16261.
Daily view: Overall, there’s not really much to say about the recent action on the daily timeframe. Due to the recent movements price is now floating in between daily resistance at 16705 and daily support taken from 15723.
4hr view: After price touched gloves with the 4hr swap (resistance) level at 16475 late during Thursday’s trade, a conservative wave of offers drove this market lower during Friday’s sessions. This, as you can see, brought price close to Tuesday’s lows 15977 – anyone see a double-bottom forming here? We certainly do, but is it enough to consider a buying from? Personally, we do not think so. The reasons for why are as follows:
- Price just closed below a weekly Quasimodo support level at 16261.
- There is little structural support seen on the daily timeframe until we reach 15723.
- Price is in the final stages of completing a near-perfect 4hr Harmonic Gartley pattern that terminates lower around the daily swap (support) level at 15723 (pink circle).
- 61.8% Fibonacci support resides at 15765 (just above the aforementioned daily support) taken from the low 15193.
Considering the above, we’d much prefer to be buyers at the 15723 region than the potential 4hr double bottom. Granted, one could say that looking to buy at 15723 would also place you against potential weekly sellers, and we’d agree it does. However, since this daily support level boasts fantastic confluence on the 4hr timeframe, we’re confident a bounce will be seen from this area and it is worth the risk. So, traders may want to note this zone in their watch lists as this is, as least at the time of writing, the only place our team would consider a buy from this week.
In closing, should the 4hr double-bottom work out; price will likely retest 16475 once again. This level – coupled with the higher timeframe structures showing room for a move lower, would make for a nice short into this market as long as corresponding lower timeframe selling confirmation was also present.
Levels to watch/ live orders:
- Buys: 15723 region [Tentative – confirmation required] (Stop loss: depends on where one confirms this area).
- Sells: 16475 [Tentative – confirmation] (Stop loss: dependent on where one confirms this level).
XAU/USD: (Gold)
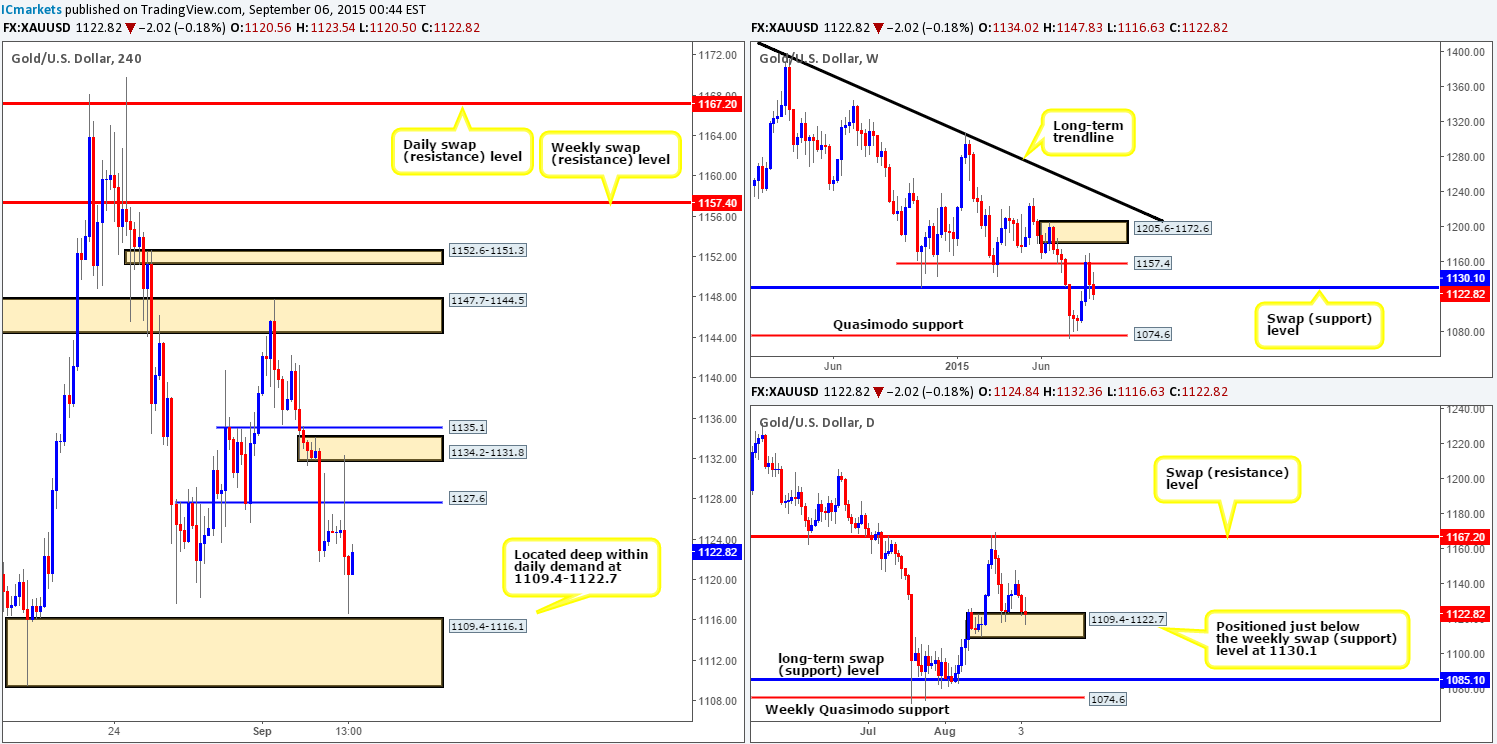
Weekly view: Gold sustained further losses for a second straight week last week, consequently erasing $12 off its value. Technically, this saw price close below a weekly swap (support) level at 1130.1 and potentially open up the gates for further downside this week towards a weekly Quasimodo support level at 1074.6.
Daily view: Daily action on the other hand, shows that price remains supported by a daily demand zone at 1109.4-1122.7. As we can see, price retested this barrier for the second time on Friday, consequently forming a daily indecision candle to end trade for the week. Should the buyers be able to withstand the pressure from weekly sellers here this week, we could see price attack the swing high 1147.8, followed closely by a daily swap (resistance) level just above it at 1167.2.
4hr view: From this angle, we can see that Gold initially spiked north following the release of the NFP data on Friday, reaching as high as 4hr supply coming in at 1134.2-1131.8. Price quickly corrected itself though and headed south, breaking below the 26/27 August lows (1117.6/1118.1) and just missed connecting with 4hr demand at 1109.4-1116.1 by only a few pips.
So, let’s just outline what we have here:
- Weekly swap (support) at 1130.1 has recently been breached.
- Daily demand at 1109.4-1122.7 is currently proving a temporary floor to this market.
- 4hr action shows price now floating between the above said 4hr demand zone and a 4hr swap (resistance) level at 1127.6.
Therefore, considering the above, we do not see much in the way of clear direction going into this week. A sell from 1127.6 would place you against daily buyers from demand. And conversely, a buy from 4hr demand would potentially see you go up against weekly sellers. This being the case, we’re not going to place any levels on our watchlist for today’s trade, and will reassess again on Tuesday.
Of course, if you really must trade this market, you could always set alerts at the aforementioned 4hr areas in bold, and watch for lower timeframe confirming price action and trade it accordingly. For us, however, we’d prefer to wait until we have something a little more concrete to work with from the higher timeframes.
Levels to watch/ live orders:
- Buys: Flat (Stop loss: N/A).
- Sells: Flat (Stop loss: N/A).


