
Key risk events today:
Australia NAB Business Confidence; China Caixin Services PMI; MPC Member Tenreyro and Haldane Speak; US Core PPI m/m; US PPI m/m; FOMC Member Evans Speaks; Fed Chair Powell Speaks.
EUR/USD:
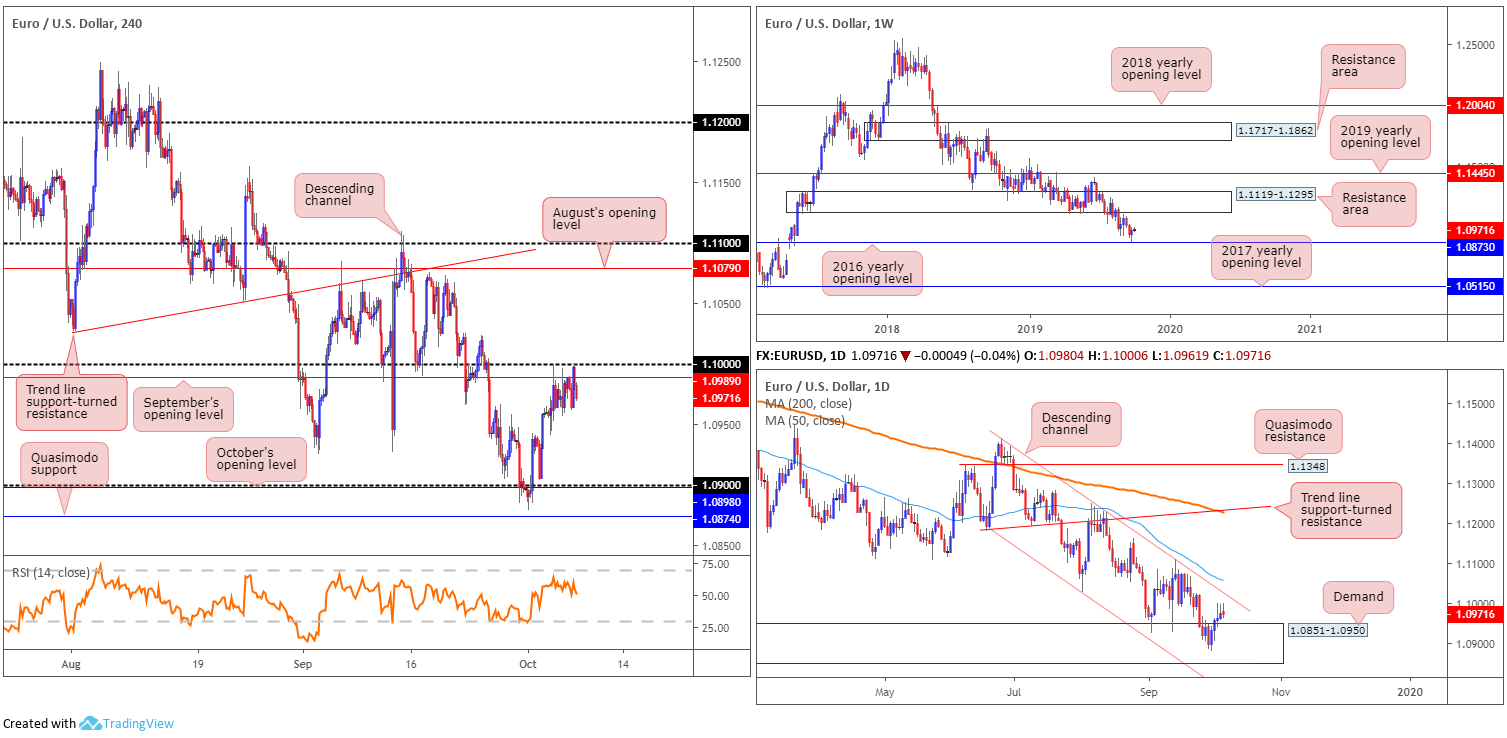
Europe’s single currency kicked off the week subdued, ranging no more than 40 points against the US dollar. After clocking a session low of 1.0961, EUR/USD’s H4 candles shook hands with the key figure 1.10 (alongside September’s opening level at 1.0989) though failed to preserve an upside presence. Also worthy of mention is the Relative Strength Index (RSI) currently seen hovering just south of its overbought value.
As highlighted in Monday’s technical briefing, beyond 1.10, tops are visible around 1.1070, followed closely by August’s opening level at 1.1079 and then the 1.11 handle. To the downside, nonetheless, limited support is visible until revisiting 1.09, which happens to merge closely with October’s opening level at 1.0898.
In terms of where the market stands on the bigger picture, Monday’s report had the following to say:
From the weekly timeframe:
The euro staged a modest recovery against the buck last week, snapping a two-week bearish phase a few points ahead of the 2016 yearly opening level at 1.0873. Aiding the move was the US dollar index, or DXY, encountering notable weekly resistance coming in at 99.62 – boasts history as far back as mid-2015 – which held the dollar lower.
To the upside, the next area of resistance on the EUR/USD falls within 1.1119-1.1295. Concerning trend direction, however, since topping in early 2018 at 1.2555, the long-term trend remains facing a southerly bearing.
From the daily timeframe:
Daily action found itself back within the parapets of demand at 1.0851-1.0950 last week – formed April 2017 and houses the 2016 yearly opening level inside its lower bounds. Buyers began strengthening their grip as early as Tuesday, with channel resistance (extended from the high 1.1412) positioned as the next viable upside target on this scale, closely shadowed by the 50-day SMA (blue – 1.1060).
Traders may also wish to acknowledge price has been compressing within a descending channel formation since late June (1.1412/1.1026).
Areas of consideration:
Outlook unchanged.
Longer term, research points to further buying, particularly on the weekly timeframe. The first area of concern, however, falls in reasonably close by at the daily channel resistance mentioned above (1.1412). Therefore, longer-term positions need to be approached cautiously.
Medium-term analysis (H4), nevertheless, reveals entry long at this point to be problematic until the H4 candles decisively engulf 1.10 to the upside. Should this occur, a run to August’s opening level at 1.1079 may be on the cards. Before reaching this far north, though, do remain cognisant of the said daily channel resistance possibly holding price action lower. Upon witnessing a H4 close above 1.10, possible entry points can be found either on the close of the breakout candle (with stop-loss orders positioned beneath its lower shadow), or a retest at the top edge of the figure (likely eyed by conservative traders – entry and risk can be determined according to the rejection candle’s structure).
GBP/USD:
GBP/USD prices concluded essentially unchanged Monday, unable to penetrate Friday’s range. Consequent to this, much of the following report will voice thoughts put forward in Monday’s technical briefing.
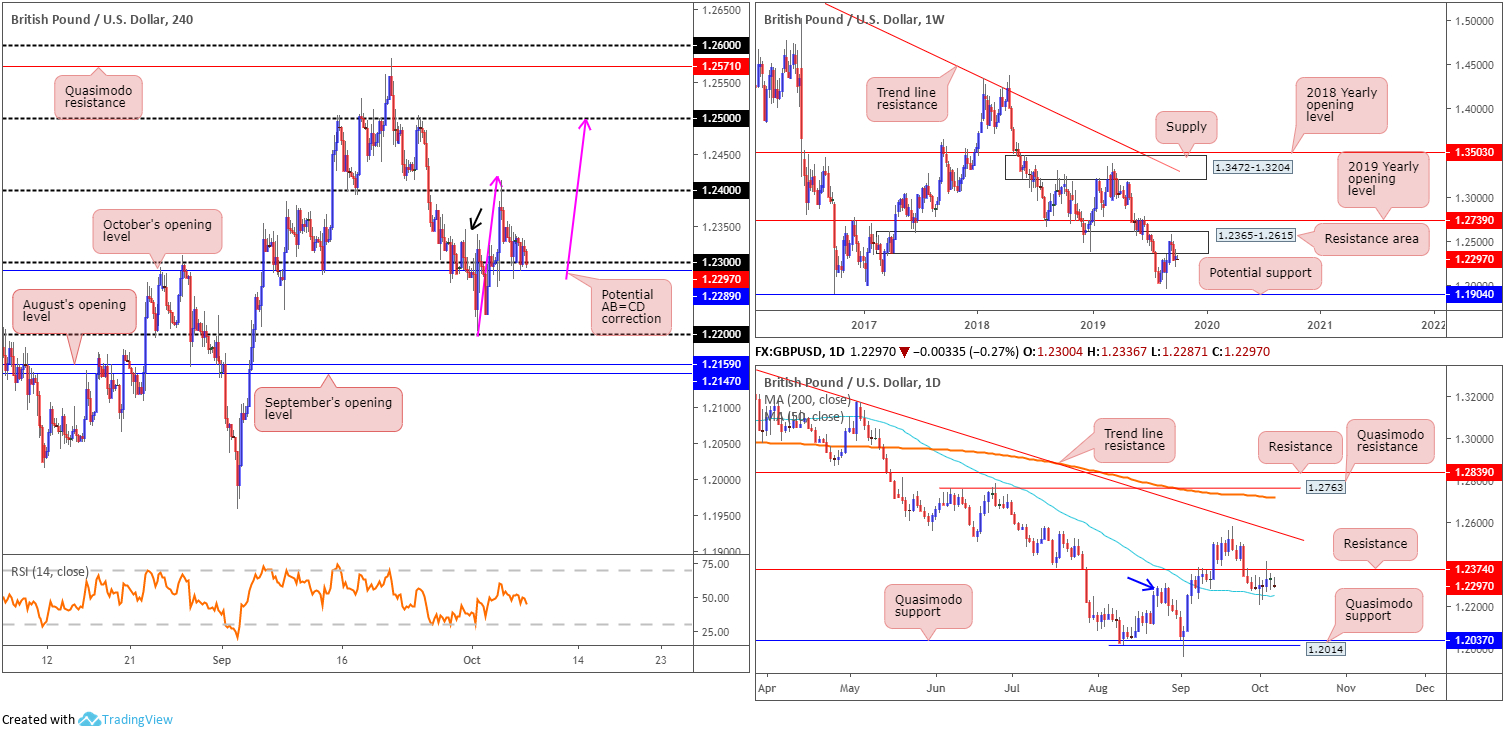
Coming in from the top, long-term resistance area at 1.2365-1.2615 remains a dominant structure on the weekly timeframe, currently plugging upside. Assuming further downside is seen, the 1.1958 September 2 low and 1.1904 – held price action strongly higher in October 2016 – are the next supports in the firing range.
The immediate trend on this timeframe (1.4376) has faced a southerly trajectory since April 2018, with a break of 1.1904 confirming the larger downward trend that began mid-2014.
A closer reading on the daily timeframe shows price action recently entered a consolidative phase between resistance plotted at 1.2374 and the 50-day SMA (blue – 1.2250). Outside of this range, areas of interest fall in at a trend line resistance (extended from the high 1.3380) and two layers of Quasimodo support at 1.2014 and 1.2037.
According to basic market structure, the high 1.2309 (blue arrow) was engulfed early September, potentially motioning the beginning of a strong recovery. The current consolidation could be a bottoming phase.
Technically, H4 action is retesting 1.23/October’s opening level at 1.2289, following Thursday’s run to highs at 1.2413.
Similar to the daily timeframe’s analysis, H4 movement also overthrew a (minor) high point at 1.2345 (black arrow) before shaking hands with 1.24. This may imply a continuation move off 1.23 back to 1.24 and possibly beyond to 1.25, completing an AB=CD correction move (pink arrows).
Areas of consideration:
Outlook unchanged.
In essence, the market has weekly price trading out of a resistance area, albeit making limited progress last week, and both H4 and daily timeframes showing promise to the upside.
Entering long based on H4 price rebounding from 1.23 is a chancy setup, nevertheless, given daily resistance lurking close by at 1.2374, followed by 1.24 on the H4 timeframe. Therefore, a H4 close above 1.24 this week will likely unbolt the door for bullish scenarios to 1.25, closely trailed by the daily trend line resistance mentioned above (1.3380).
In the event the above analysis is incorrect and the market turns lower and reclaims 1.23, then shorts are an option back to the 50-day SMA (1.2248) and possibly 1.22.
AUD/USD:
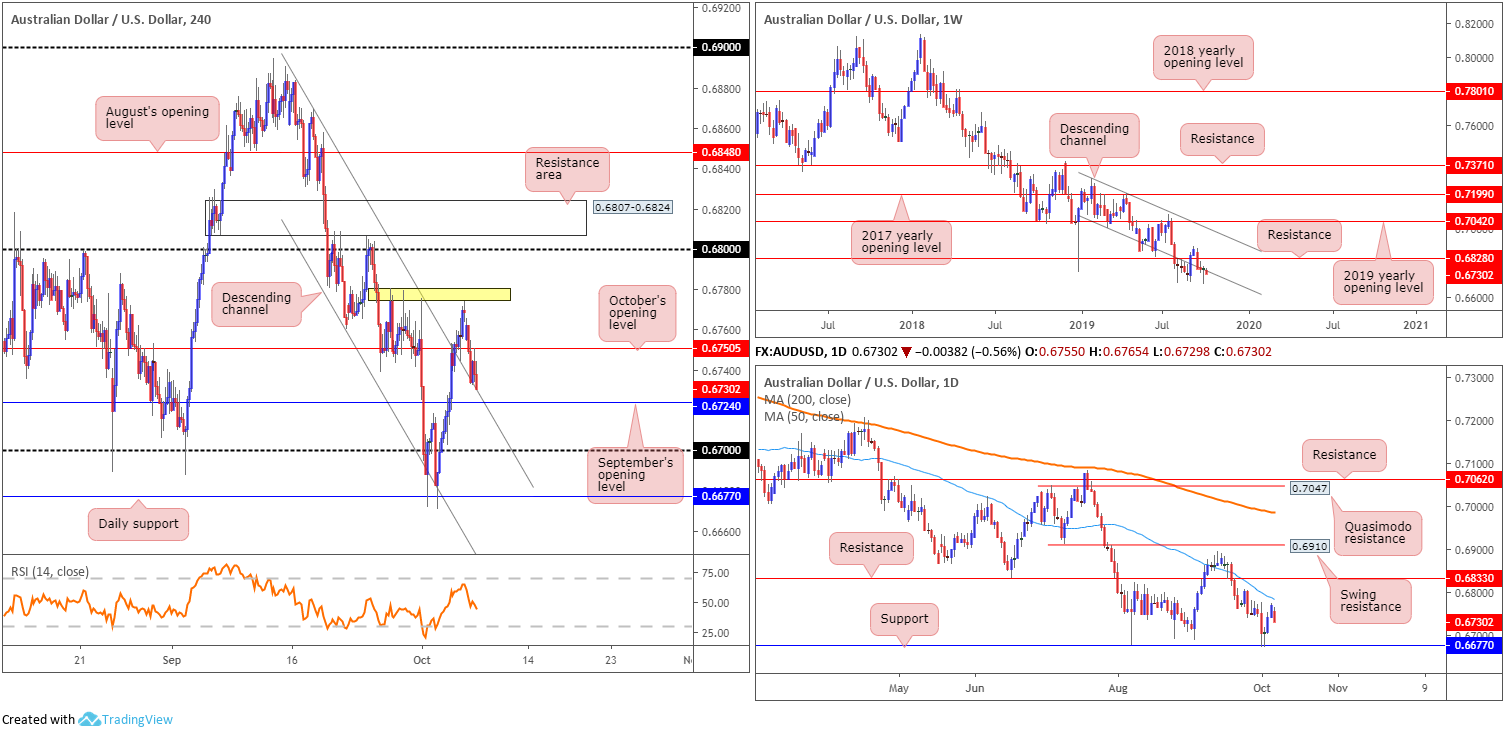
The Australian dollar wrapped up Monday lower vs. the greenback, down more than half-of-a-percent. Erasing all of Friday’s losses and shaking hands with the upper edge of Thursday’s range, the move overthrew October’s opening level at 0.6750 and brought H4 channel resistance-turned support (extended from the high 0.6883) into the mix. 0.6750 is seen offering hearty resistance, increasing the odds additional selling could be seen towards September’s opening level at 0.6724, and maybe even a move to 0.67.
Technical action on the weekly timeframe had price attempt to take hold of its channel support (taken from the low 0.7003) last week, concluding in the shape of a hammer candlestick pattern (considered a bullish signal). Buyers, as of current price, appear unenthusiastic, though in the event bidding takes over, resistance at 0.6828 is in sight.
The story on the daily timeframe has price rotating lower just south of its 50-day SMA (blue – 0.6783), portending a possible shift back to familiar support at 0.6677. Above the said SMA, traders’ crosshairs are likely fixed on resistance coming in at 0.6833.
Areas of consideration:
With weekly buyers exhibiting signs of weakness as well as daily movement plotting a potential move back to 0.6677, entering long from the current H4 channel resistance-turned support is chancy. Even with a break of 0.6750, traders must contend with tops (yellow) around 0.6777 and the 50-day SMA applied to the daily timeframe.
Although appearing to be a sellers’ market, September’s opening level at 0.6724 denotes probable support, with a break of this level only clearing approximately 20 points of room for profit to 0.67. Therefore, a break/retest setup beneath 0.6724 would be incredibly tight.
In the absence of clearer price action, electing to remain on the side-lines might be a better path to take today.
USD/JPY:
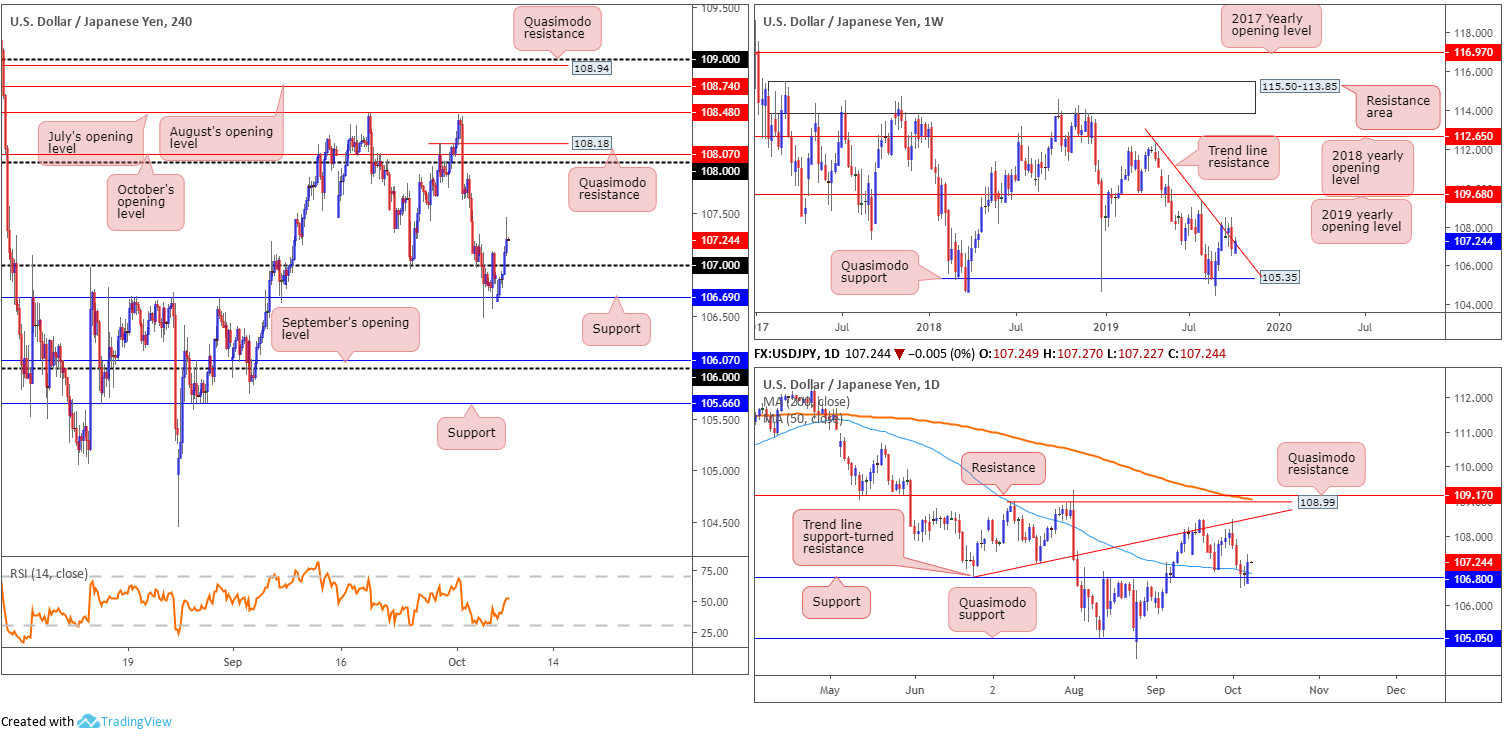
USD/JPY buyers went on the offensive from H4 support at 106.69 in the early hours of Monday’s session, consequently reclaiming 107+ status and clocking highs of 107.46. With the break of 107 clearly visible, traders may interpret this as daily buyers strengthening their grip on support at 106.80 for a push to 108 on the H4. Note the round number merges closely with October’s opening level at 108.07 and a Quasimodo resistance at 108.18. With respect to the next upside target on the daily timeframe, the trend line support-turned resistance (taken from the low 106.78) is in the firing range, shouldered closely together with Quasimodo resistance at 108.99, the 200-day SMA (orange – 109.06) and resistance coming in at 109.17.
Longer term, weekly action is stationed around a familiar trend line resistance etched from the high 112.40. As the low of last week’s bearish outside pattern (106.48) has yet to be tested, a short based on this pattern has not been triggered. Quasimodo support at 105.35 is eyed as the next downside target on this scale, while to the upside, the 2019 yearly opening level falls in as the next resistance point at 109.68.
Areas of consideration:
A retest at 107 is certainly an option today, targeting 108. Knowing daily support at 106.80 also recently entered the mix adds weight to an upside move. The only grumble, of course, is weekly price toying with trend line resistance. For buyers still interested in 107 as a possible support today, however, may want to consider waiting for a H4 bullish candlestick formation to develop before pulling the trigger. Not only will this help identify buyer intent, it will provide entry and risk levels to work with.
USD/CAD:
USD/CAD movement concluded unmoved Monday, though did witness a minor whipsaw take shape through 1.33. In response to recent lacklustre movement, the following analysis will air a similar vibe to Monday’s outlook.
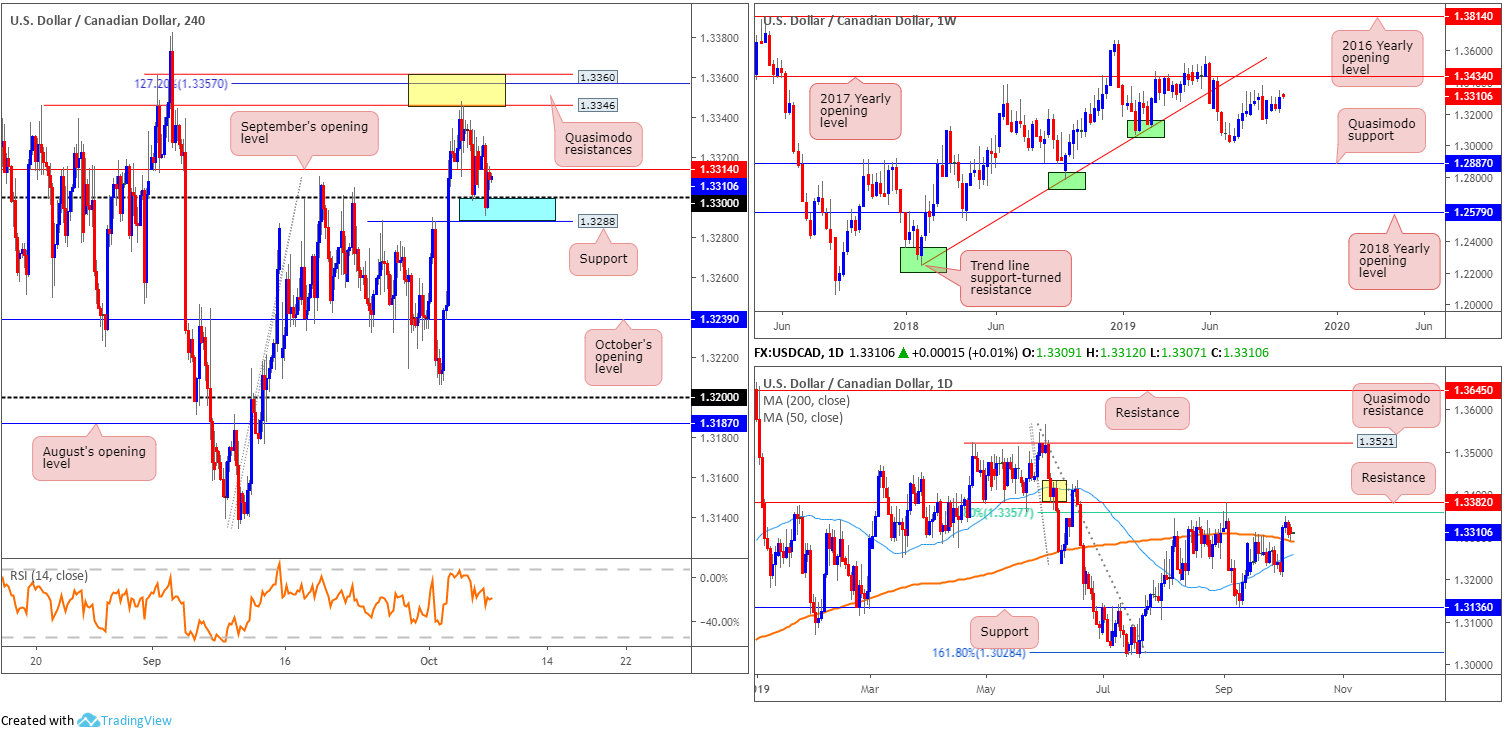
Weekly price witnessed an expansion in volatility last week, overwhelming two weeks’ worth of trading in the shape of a bullish outside pattern. Considered a reasonably strong buy signal, resistance at the 2017 yearly opening level drawn from 1.3434, closely lagged by trend line support-turned resistance extended from the low 1.2247, may enter the mix sometime this week.
Wednesday saw the unit overpower its 200-day SMA (orange – 1.3292) on the daily timeframe, extend to weekly highs at 1.3347 and finish reclaiming a portion of the move Friday. Monday revisited the SMA and produced a mild end-of-day correction. A run to resistance plotted at 1.3382 from here is feasible this week, sited just north of a 61.8% Fibonacci ratio at 1.3357. Bolstering resistance is a supply zone (yellow) between 1.3430-1.3381, with a break of this zone likely foretelling a move to Quasimodo resistance at 1.3521.
Medium-term analysis (H4) has two layers of Quasimodo resistance 1.3360/1.3346 (yellow) in sight, which held price action lower last Thursday. Additionally, a 127.2% Fibonacci extension point is housed within at 1.3357 as is the 61.8% daily Fibonacci ratio also at 1.3357. To the downside, support emerging from a prior double-top formation at 1.3288, shadowed closely with the round number 1.33, is seen. September’s opening level at 1.3314 is also in view, though currently an acting resistance.
Areas of consideration:
Weekly candlestick action suggests further buying could be on the menu this week, therefore the retest at the 200-day SMA may be a possible long opportunity for some traders. Interestingly, the moving average coincides with an area of H4 support (blue) between 1.3288/1.33, therefore resembling a potential reversal zone buyers may look to work from.
With 1.3288/1.33 holding ground yesterday, waiting for H4 price to engulf September’s opening level at 1.3314 could be a way of confirming buyer intent to 1.3360/1.3346. A H4 close above 1.3314, thus, could be considered a signal; others may prefer to wait for a retest to form before committing funds (entry and risk can then be based on the rejection candle’s framework).
USD/CHF:
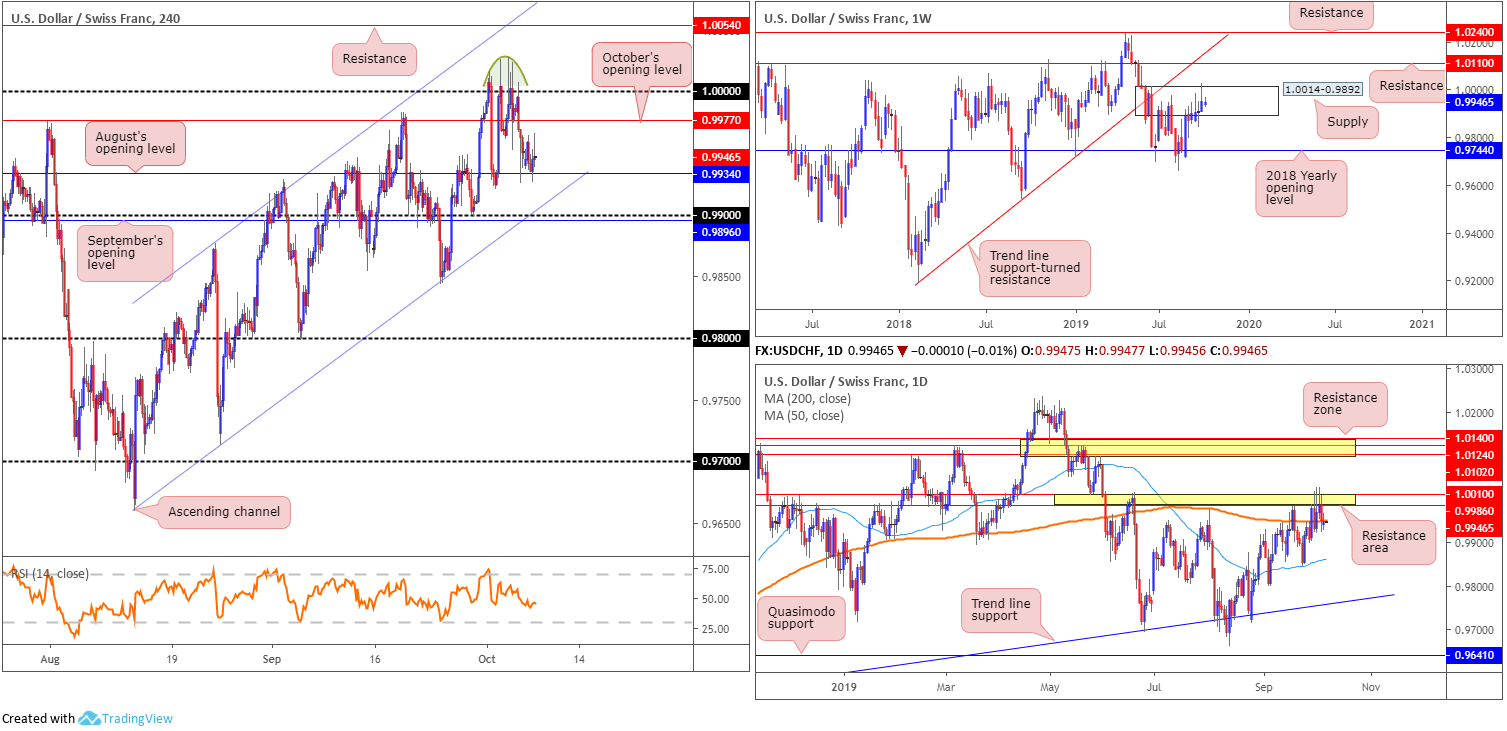
USD/CHF prices kicked off the week motionless, stationed at the lower end of Friday’s range. Relative to weekly movement, unchanged from Monday’s analysis, last week’s candle clipped the top edge of supply at 1.0014-0.9892. While the recent move to multi-month peaks at 1.0027 possibly tripped some buy stops, interest from the sell side of the market clearly remains. In the event of a push higher this week, however, traders are urged to note resistance coming in at 1.0110, with a break of this barrier exposing trend line support-turned resistance (etched from the low 0.9187). If downside persists, the 2018 yearly opening level at 0.9744 is marked as the next support base.
Closer analysis of price action on the daily timeframe saw yesterday’s candle close marginally beneath the 200-day SMA (orange – 0.9949), after spending the majority of last week defending a narrow resistance zone at 1.0010/0.9986. Nudging beneath the 200-day SMA may lead to the 50-day SMA entering the fold (blue – 0.9859).
Since the beginning of last week, the underside of 1.0000 (parity) was under attack. Buy stops above the number were likely tripped, triggering pain on both sides of the market: those attempting to fade the level and those bidding the breakout. All in all, though, the H4 candles formed a minor rounded topping formation (green) and once more found support at 0.9934: August’s opening level.
August’s opening level at 0.9934 remains in the fold, bolstering price action Friday and yesterday. Beyond the said support, September’s opening level at 0.9896 is in view, closely coupled with the 0.99 handle and a channel support extended from the low 0.9659.
Areas of consideration:
Outlook unchanged.
Three potential scenarios could play out:
- Should H4 price remain rangebound between 1.0000/0.9934, range traders may look to buy/sell these limits.
- A break beneath 0.99 takes hold, perhaps unlocking the door to the 0.9843 September 24 low and 0.98 handle. Remember, though, we also have the 50-day SMA at 0.9859 to contend with.
- Overthrowing 1.0000 indicates buyer intent to at least H4 resistance at 1.0054, though this entails entering long within the upper range of both a daily resistance area at 1.0010/0.9986 and a weekly supply at 1.0014-0.9892.
Dow Jones Industrial Average:
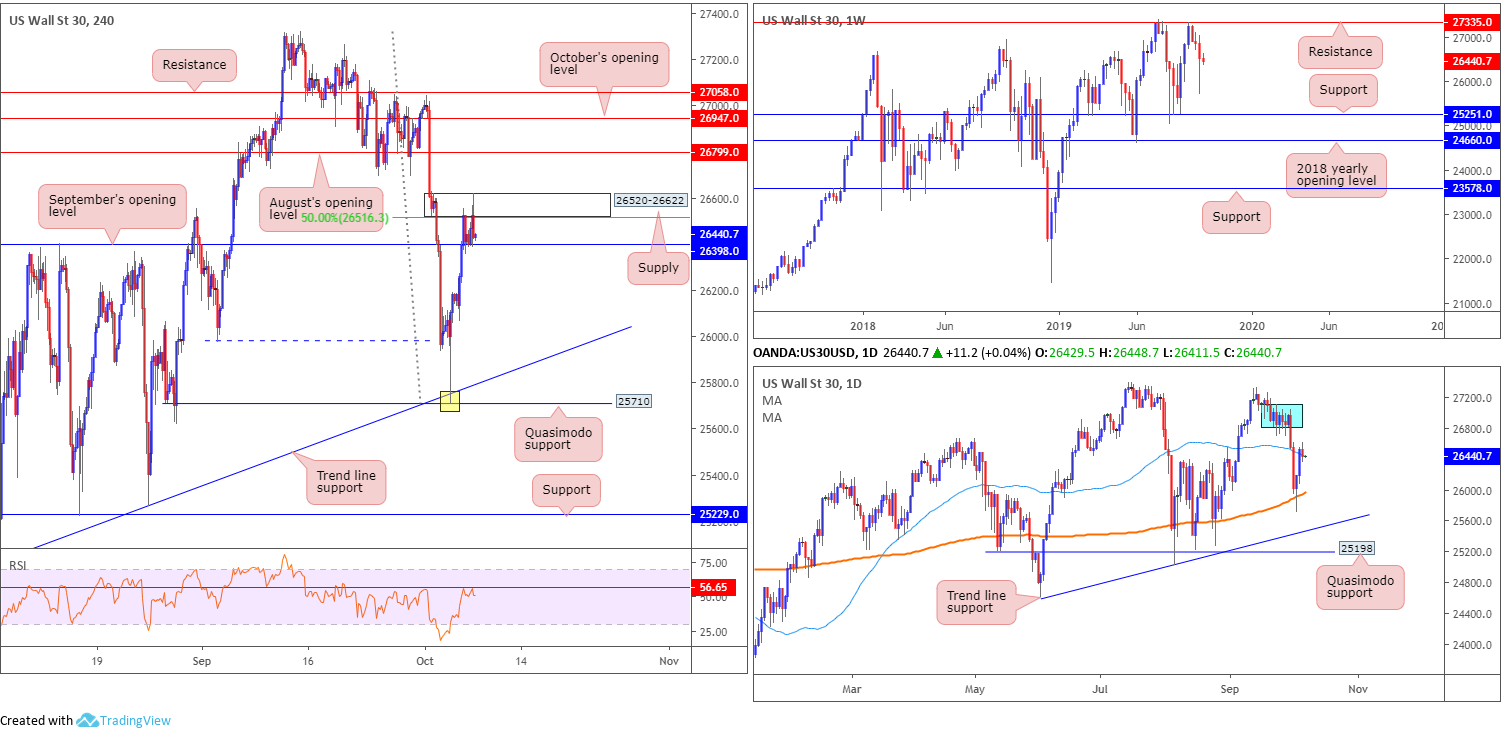
US stocks inched modestly lower Monday, ahead of high-level tariff negotiations between the US and China. The Dow Jones Industrial Average shed 95.70 points, or 0.36%; the S&P 500 also lost 13.23 points, or 0.45%, and the tech-heavy Nasdaq 100 declined 28.97 points, or 0.37%.
Long term, resistance on the weekly timeframe is evident around the 27335 point, a touch lower than the all-time high 27388, whereas support can be seen at the 25251 region, shadowed closely by the 2018 yearly opening level at 24660. Daily price recently rebounded from its 200-day SMA (orange – 25965) and tested the 50-day SMA (blue – 26438). Overhead, supply is evident between 27110-26813 (blue), which could hold price action lower this week (positioned just south of the weekly resistance at 27335).
Technically, H4 movement concluded north of September’s opening level at 26398, though faces selling pressure from fresh supply at 26520-26622, which merges with a 50.0% resistance value at 26516. Given this area was effectively the origin of the break of the low (dashed blue) at 25976, it should not be a surprise to see it hold. Selling from here could be enough to overpower any buying at 26398 and decisively close back beneath the 50-day SMA highlighted above.
Areas of consideration:
Outlook unchanged.
The H4 supply mentioned above at 26520-26622 is likely of interest to many traders today for possible selling opportunities, though with immediate support residing close by at 26398, waiting for this level to be overthrown may be the safer path to explore (entry/risk can then be based on the breakout candle’s structure). Beyond here, the next downside target can be found at the 200-day SMA (25965) or the H4 trend line support taken from the low 25024. Supporting a run lower, indicator-based traders may also wish to acknowledge the Relative Strength Index (RSI) testing notable resistance around the 56.65 value.
XAU/USD (GOLD):
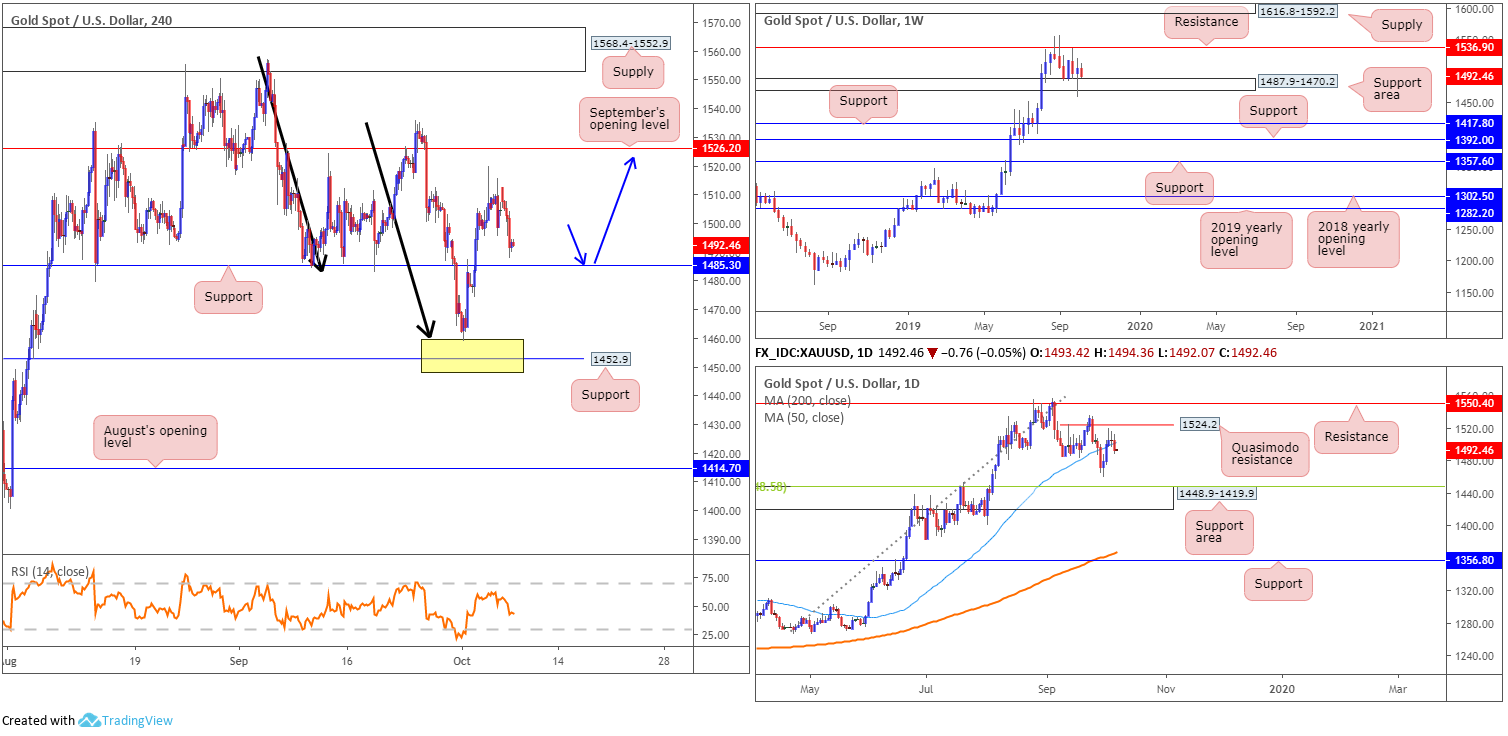
Optimism surrounding US/China trade, along with a modest rise in US Treasury yields, weighed on the yellow metal Monday, down 0.76% against the dollar.
Latest from the weekly timeframe shows price ranging between a support area at 1487.9-1470.2 and resistance at 1536.9, with the lower edge of this consolidation currently in play. Supply at 1616.8-1592.2 is the next area of interest beyond this range, whereas below the current support area, two layers of support are seen at 1392.0 and 1417.8.
Technical research on the daily timeframe has the yellow metal trading marginally south of its 50-day SMA (blue – 1502.6), eyeing a run towards the 1459.2 October 1st low, followed by a possible shift to a support area at 1448.9-1419.9 (converges with a 38.2% Fibonacci support value at 1448.5).
Last week’s rally, originating from H4 support between 1448.9/1460.2 (comprised of the top limit of the daily support area at 1448.9-1419.9, a H4 support level at 1452.9 and a H4 AB=CD completion point at 1460.2 [black arrows]), lifted H4 action to weekly peaks of 1519.7.
In light of Friday’s lacklustre performance and Monday’s descent, a retest at support from 1485.3 is still eyed, targeting daily Quasimodo resistance at 1524.2 and September’s opening level at 1526.2.
Areas of consideration:
Outlook unchanged.
A retest at H4 support drawn from 1485.3 would possibly entice buyers into the market, given weekly price trading from the lower edge of its range, with an upside target, as highlighted above, set at the daily Quasimodo formation 1524.2, closely trailed by September’s opening level at 1526.2.
For conservative buyers, waiting for additional candlestick confirmation to form off 1485.3 might be an option worth exploring. This will help identify buyer intent before committing funds, and will also provide entry and risk levels.
The accuracy, completeness and timeliness of the information contained on this site cannot be guaranteed. IC Markets does not warranty, guarantee or make any representations, or assume any liability regarding financial results based on the use of the information in the site.
News, views, opinions, recommendations and other information obtained from sources outside of www.icmarkets.com.au, used in this site are believed to be reliable, but we cannot guarantee their accuracy or completeness. All such information is subject to change at any time without notice. IC Markets assumes no responsibility for the content of any linked site.
The fact that such links may exist does not indicate approval or endorsement of any material contained on any linked site. IC Markets is not liable for any harm caused by the transmission, through accessing the services or information on this site, of a computer virus, or other computer code or programming device that might be used to access, delete, damage, disable, disrupt or otherwise impede in any manner, the operation of the site or of any user’s software, hardware, data or property.


