
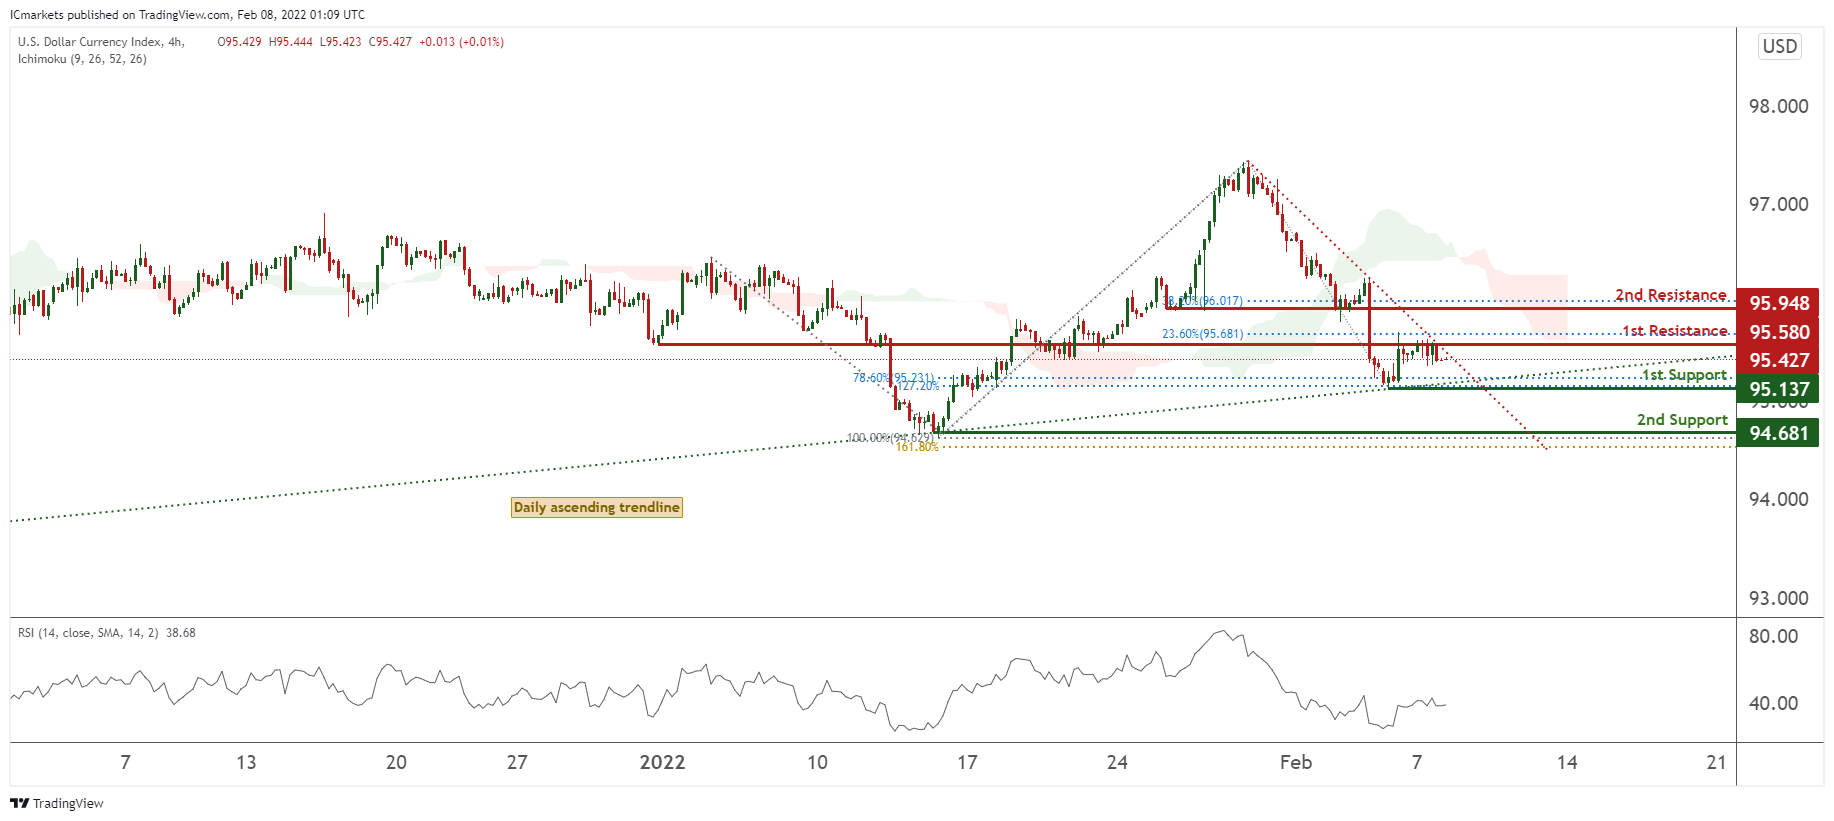
DXY:
On the H4 timeframe, prices are on bearish momentum and abiding to our descending trendline. We see the potential for a dip from our 1st resistance at 95.580 in line with 23.6% Fibonacci retracement and graphical overlap towards our 1st support at 95.216 in line with 78.6% Fibonacci retracement. RSI and Ichimoku clouds are also showing bearish momentum.
Areas of consideration:
- H4 time frame, 1st resistance at 95.580
- H4 time frame, 1st support at 95.137
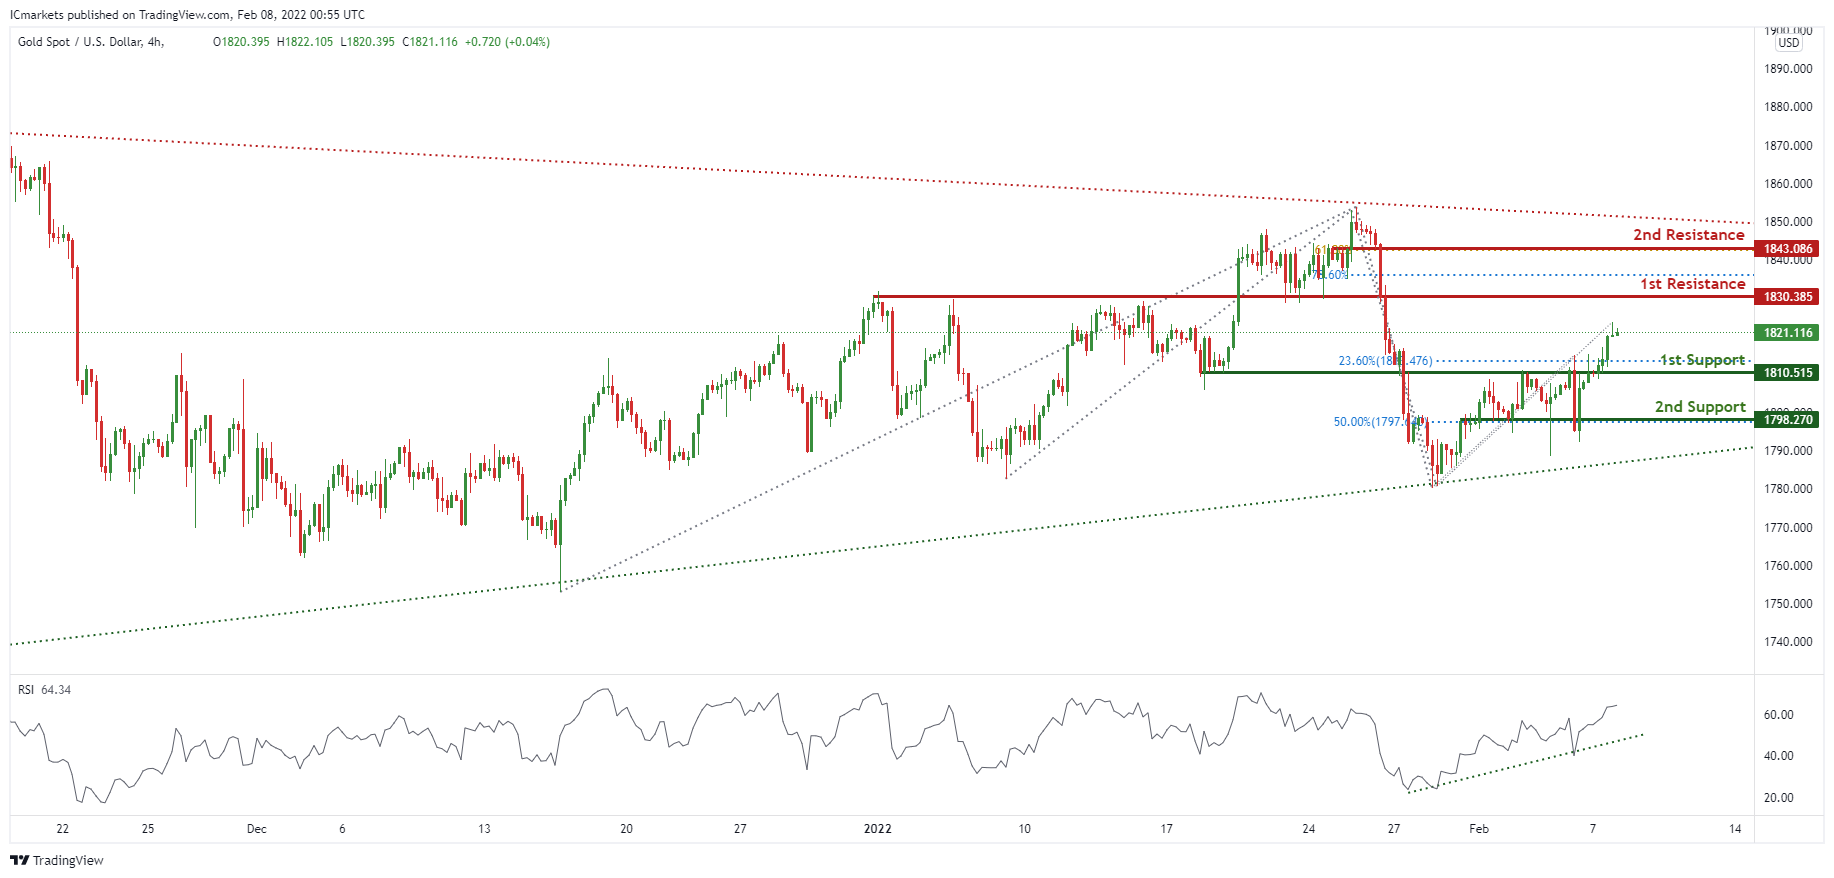
XAU/USD (GOLD):
On the H4 chart, prices are consolidating in a triangle pattern. We see potential for further bullish continuation from our 1st support at 1810.515 in line with 23.6% Fibonacci retracement towards our 1st resistance at 1830.385 in line with 78.6% Fibonacci retracement. RSI are portraying bullish momentum, further supporting our bullish bias.
Areas of consideration:
- 4h 1st support at 1810.515
- 4h 1st resistance at 1830.385
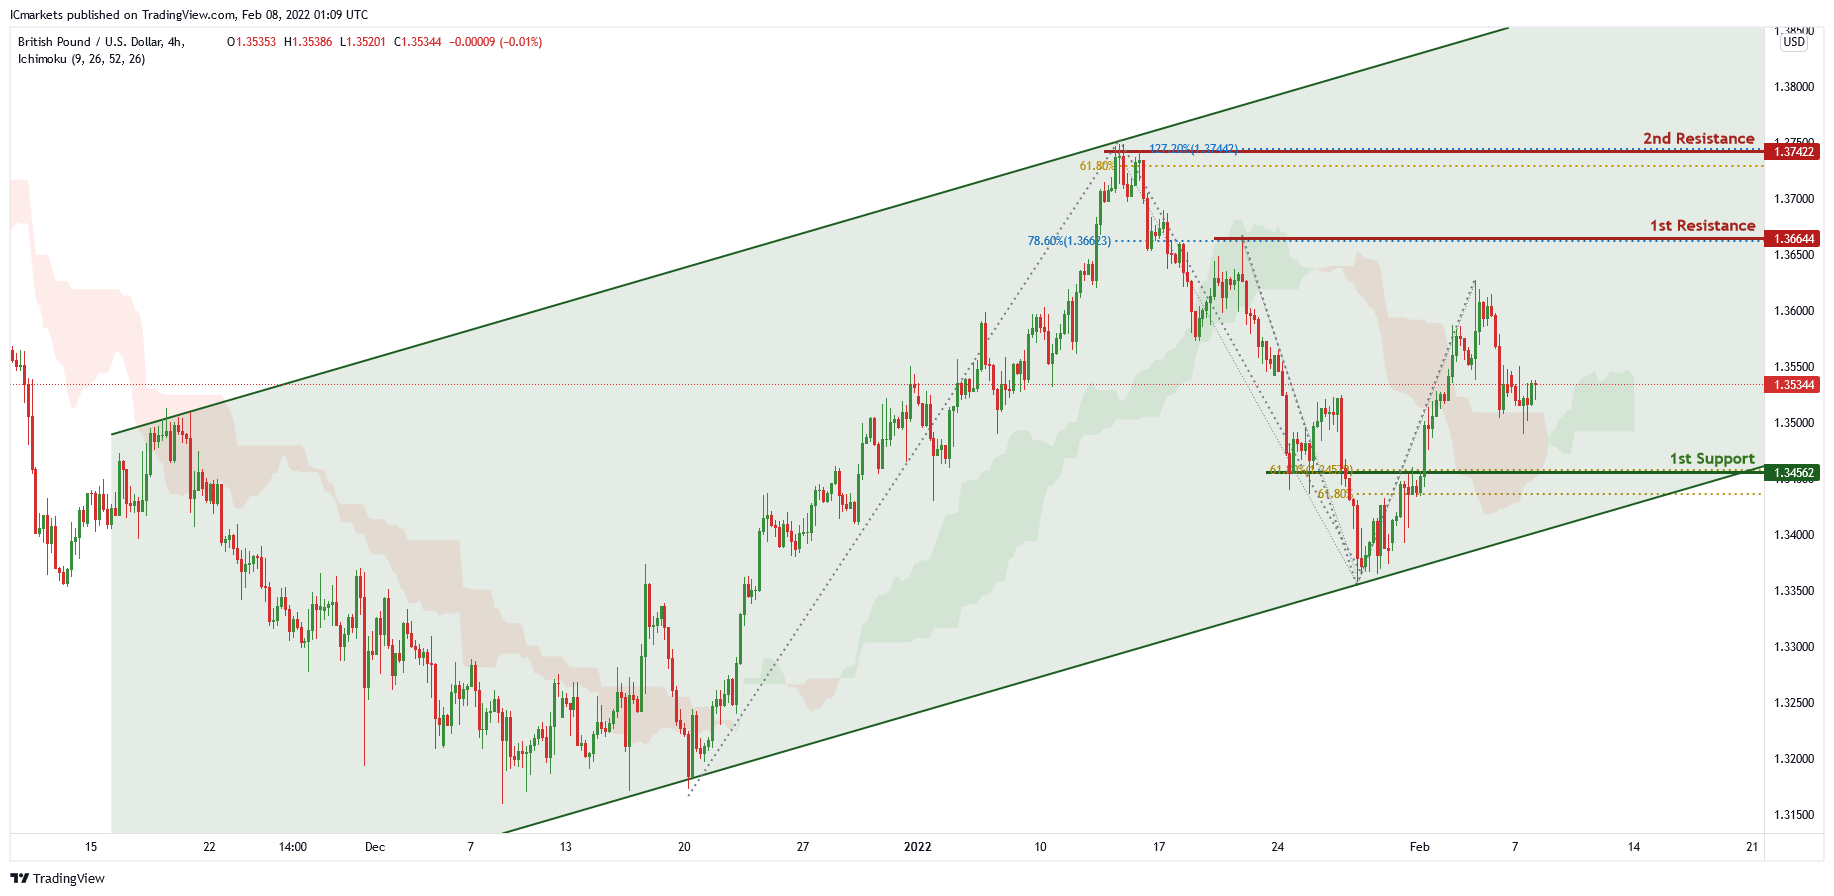
GBP/USD
On the H4 chart , price is trading in an ascending channel , price is in the middle of the 1st resistance level of 1.36644 which is also 78.6% Fibonacci projection and 1st support level of 1.34562 which is also 61.8% Fibonacci projection and 61.8% Fibonacci retracement. Price can potentially go to its 1st resistance level. Our bullish bias is supported by the ichimoku cloud indicator.
Areas of consideration:
- H4 1st resistance at 1.36644
- H4 1st support at 1.34562
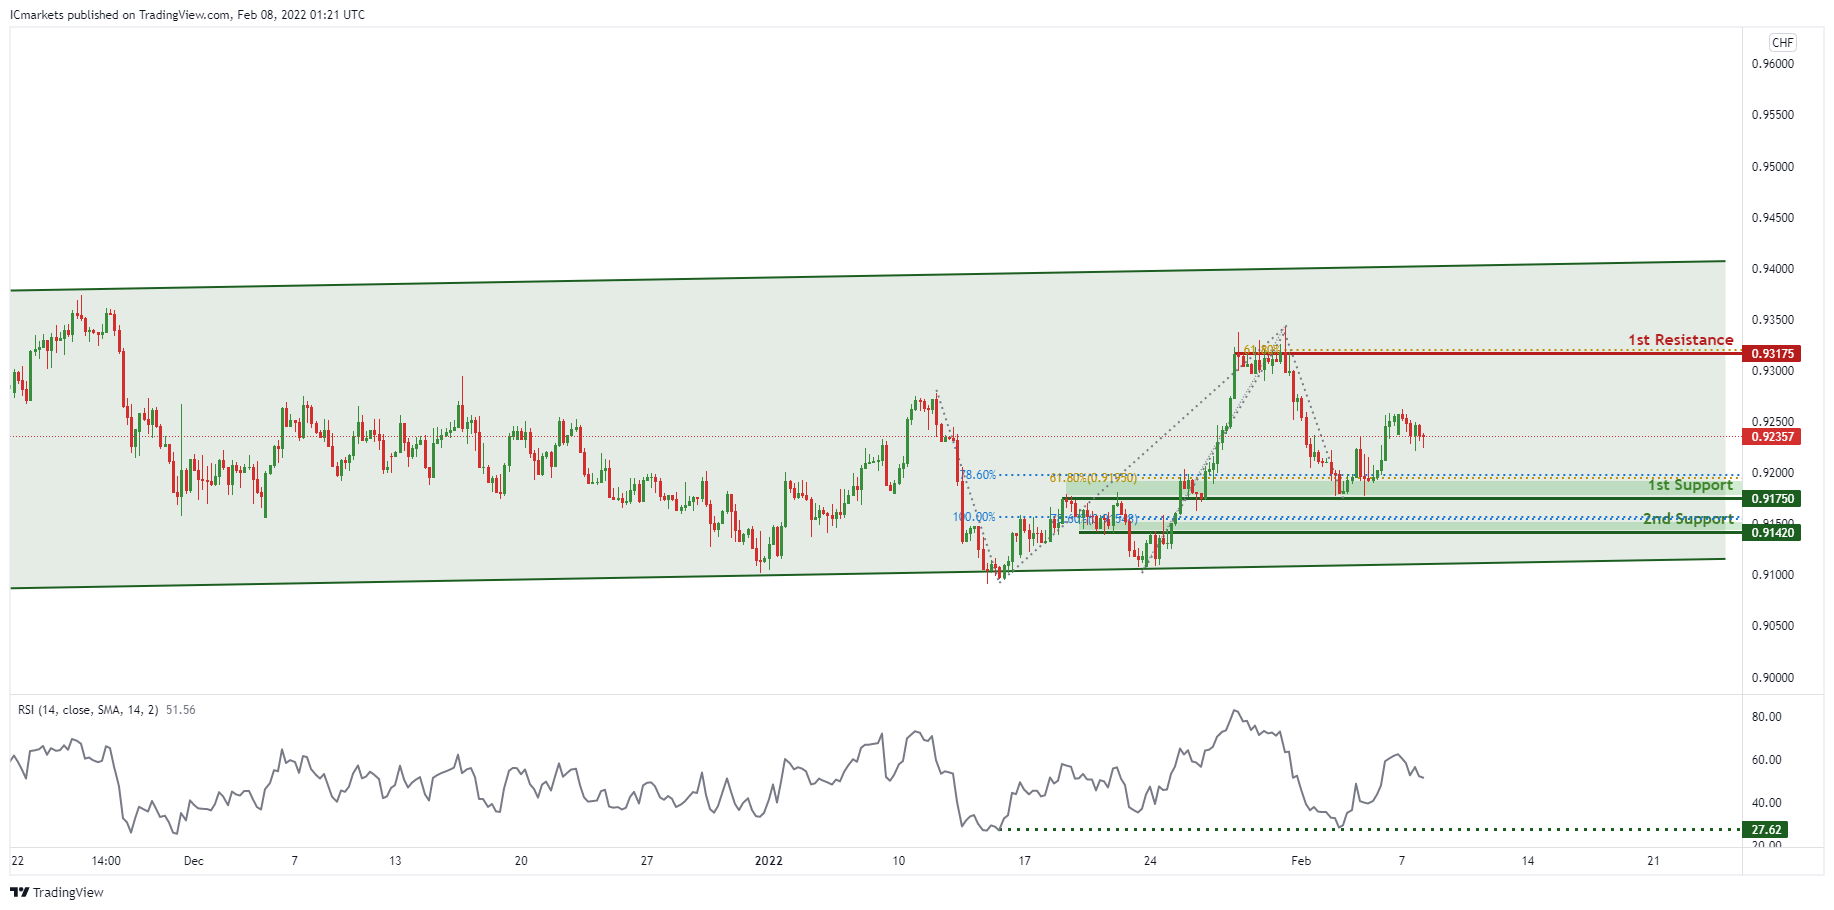
USD/CHF:
On the H4 timeframe,in reference to last week’s analysis price indeed bounced at the 1st Support level. Price is abiding to the daily ascending channel signifying an overall bullish momentum. We can expect the price to bounce from 1st Support in line with 78.6% Fibonacci projection and 61.8% fibonacci retracement towards 1st Resistance in line with 61.8% Fibonacci projection and previous swing high. Our bullish bias is further supported by the RSI indicator where it is at the support level. Traders should wait for prices to swing higher or lower before entering.
Areas of consideration:
- Watch 1st Support at 0.91750
- Watch 1st Resistance at 0.93175
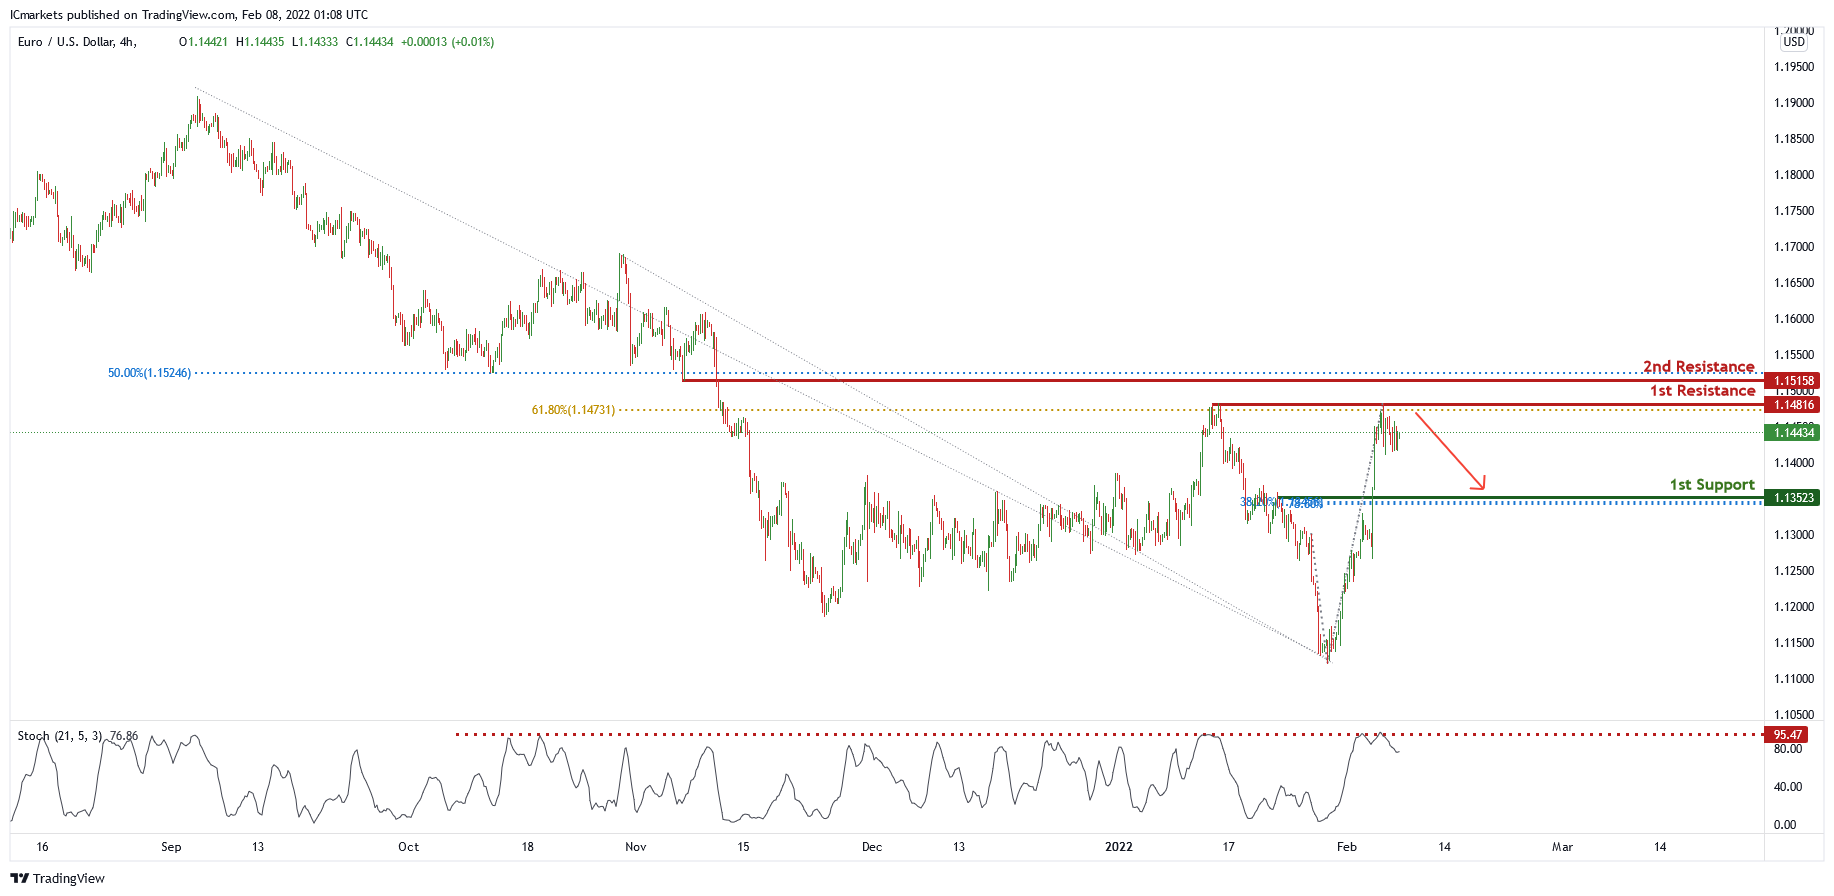
EUR/USD :
On the H4 chart, price is near the 1st resistance level of 1.14816 which is also 61.8% Fibonacci retracement. Price can potentially dip to the 1st support level of 1.13523 in line with 38.2% Fibonacci retracement and 78.6% Fibonacci projection. Our bearish bias is supported by the stochastic indicator as price is trading below it.
Areas of consideration :
- H4 1st support at 1.13523
- H4 1st resistance at 1.14816
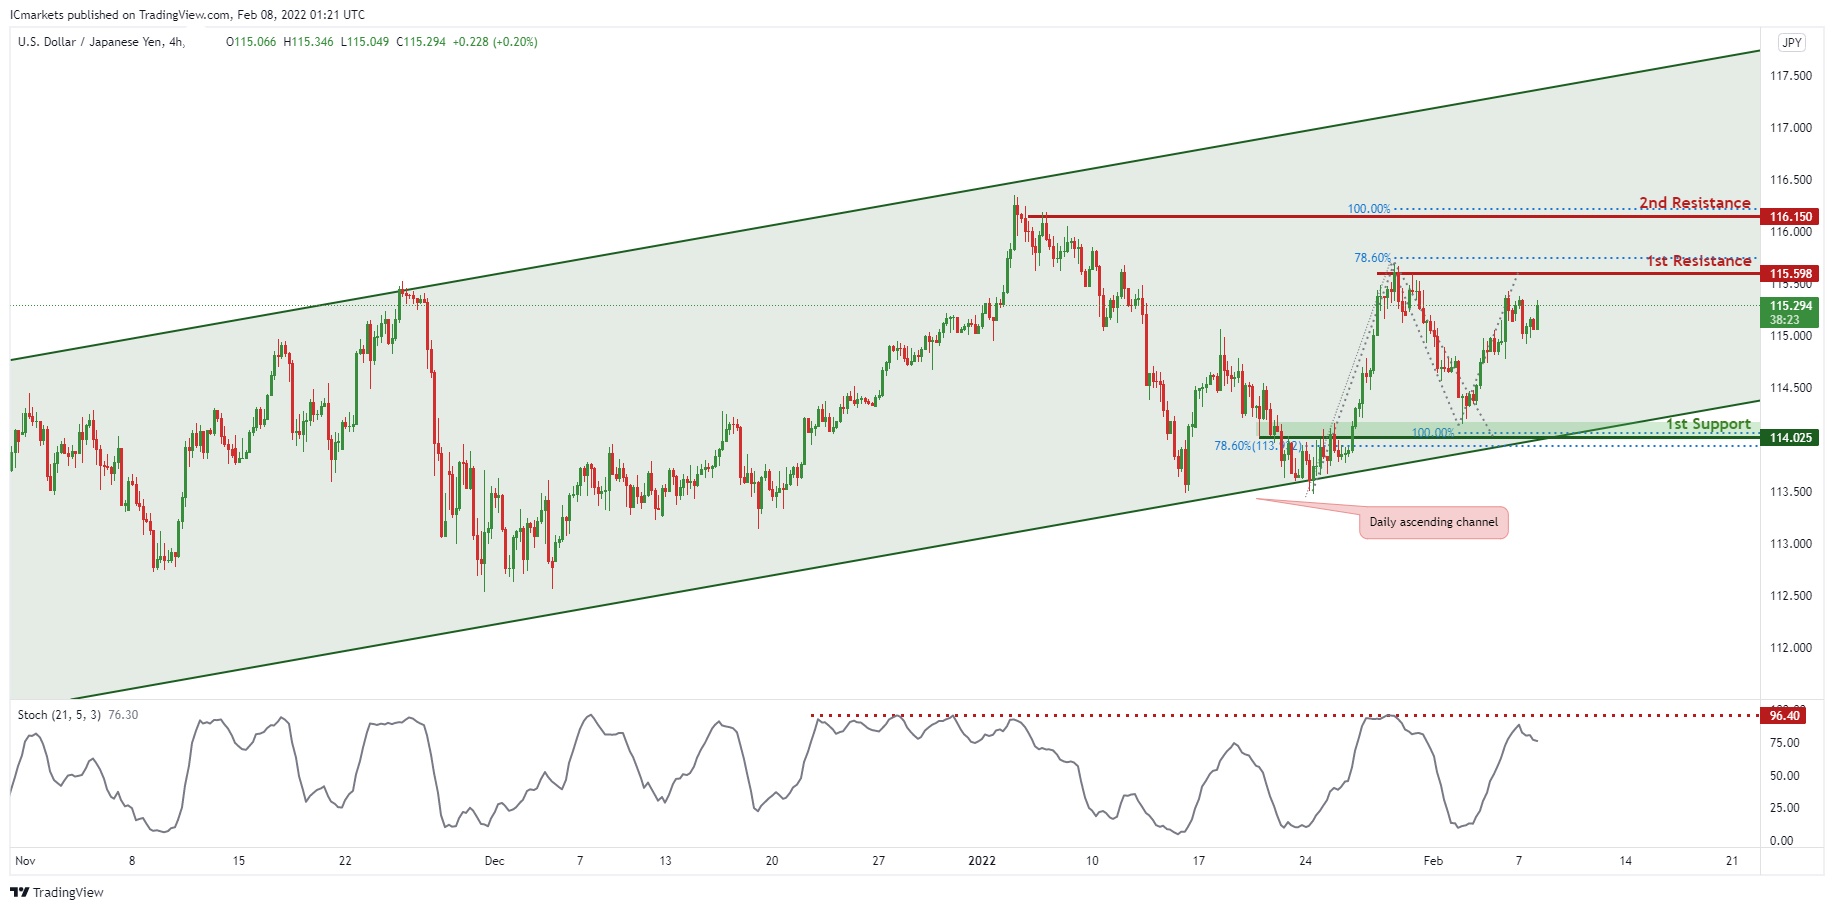
USD/JPY:
On the H4 chart,in reference to last week’s analysis, price indeed bounced at 1st Support and it is reaching our potential 1st Resistance level @ 115.598.
Price is trading in an ascending channel signifying an overall bullish momentum, however, we can expect a short-term bearish drop from 1st Resistance level in line with horizontal resistance and 78.6% Fibonacci projection towards 1st Support in line with previous swing low and 100% Fibonacci projection. Our bearish bias is further supported by the stochastic indicator where the %K line is at the resistance level.
Areas of consideration:
- H4 1st support at 114.025
- H4 1st resistance at 115.598
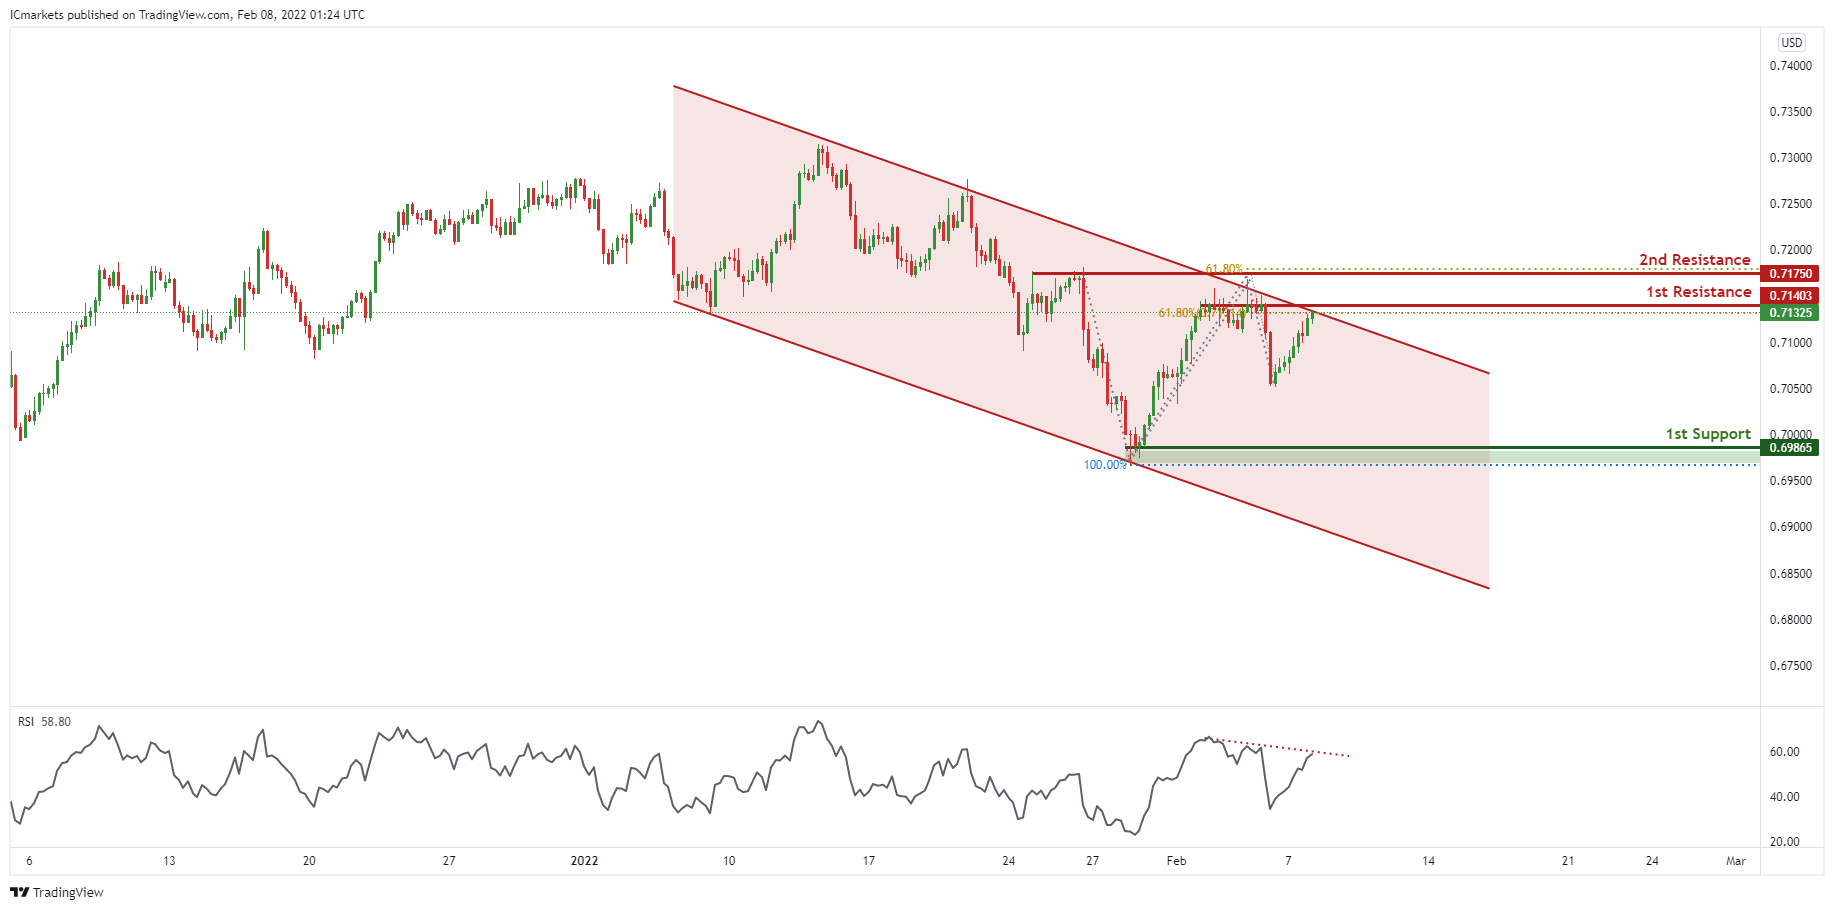
AUD/USD:
On the H4 timeframe, in reference to last week’s analysis, price indeed dropped from the resistance level. Price is abiding to the descending channel, signifying an overall bearish momentum. We can expect price to drop from 1st Resistance in line with 61.8% Fibonacci retracement towards 1st Support in line with previous swing low and 100% Fibonacci projection. Our bearish bias is further supported by the RSI indicator where it is abiding to the descending trendline resistance.
Areas of consideration:
- H4 1st Support level 0.69865
- H4 1st resistance level 0.71403
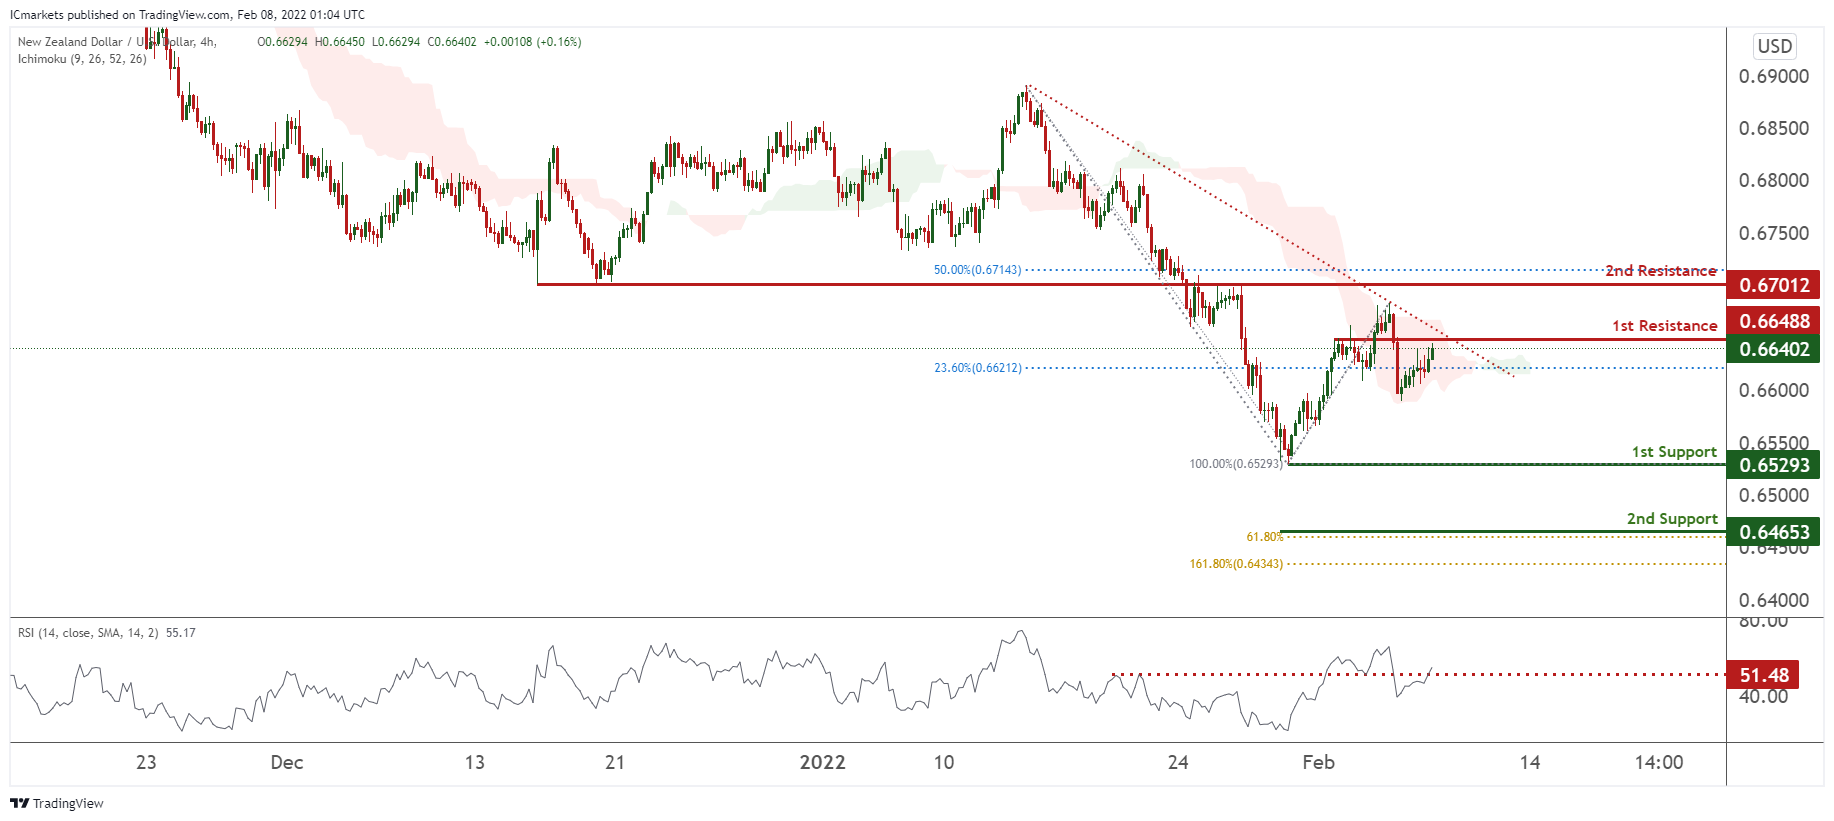
NZD/USD:
On the H4 timeframe, prices were on bearish momentum and are abiding to our descending trendline. We see potential for prices to dip from our 1st resistance at 0.66488 in line with 23.6% Fibonacci retracement towards our 1st support at 0.65293 in line with 100% Fibonacci retracement. Our bias is further supported by prices facing resistance in the Ichimoku Clouds and RSI being at levels where dips previously occurred. Alternatively, our stop loss will be placed at 2nd resistance at 0.67012 in line with 50% Fibonacci retracement.
Areas of consideration:
- H4 time frame, 1st resistance at 0.66488
- H4 time frame, 1st support at 0.65293
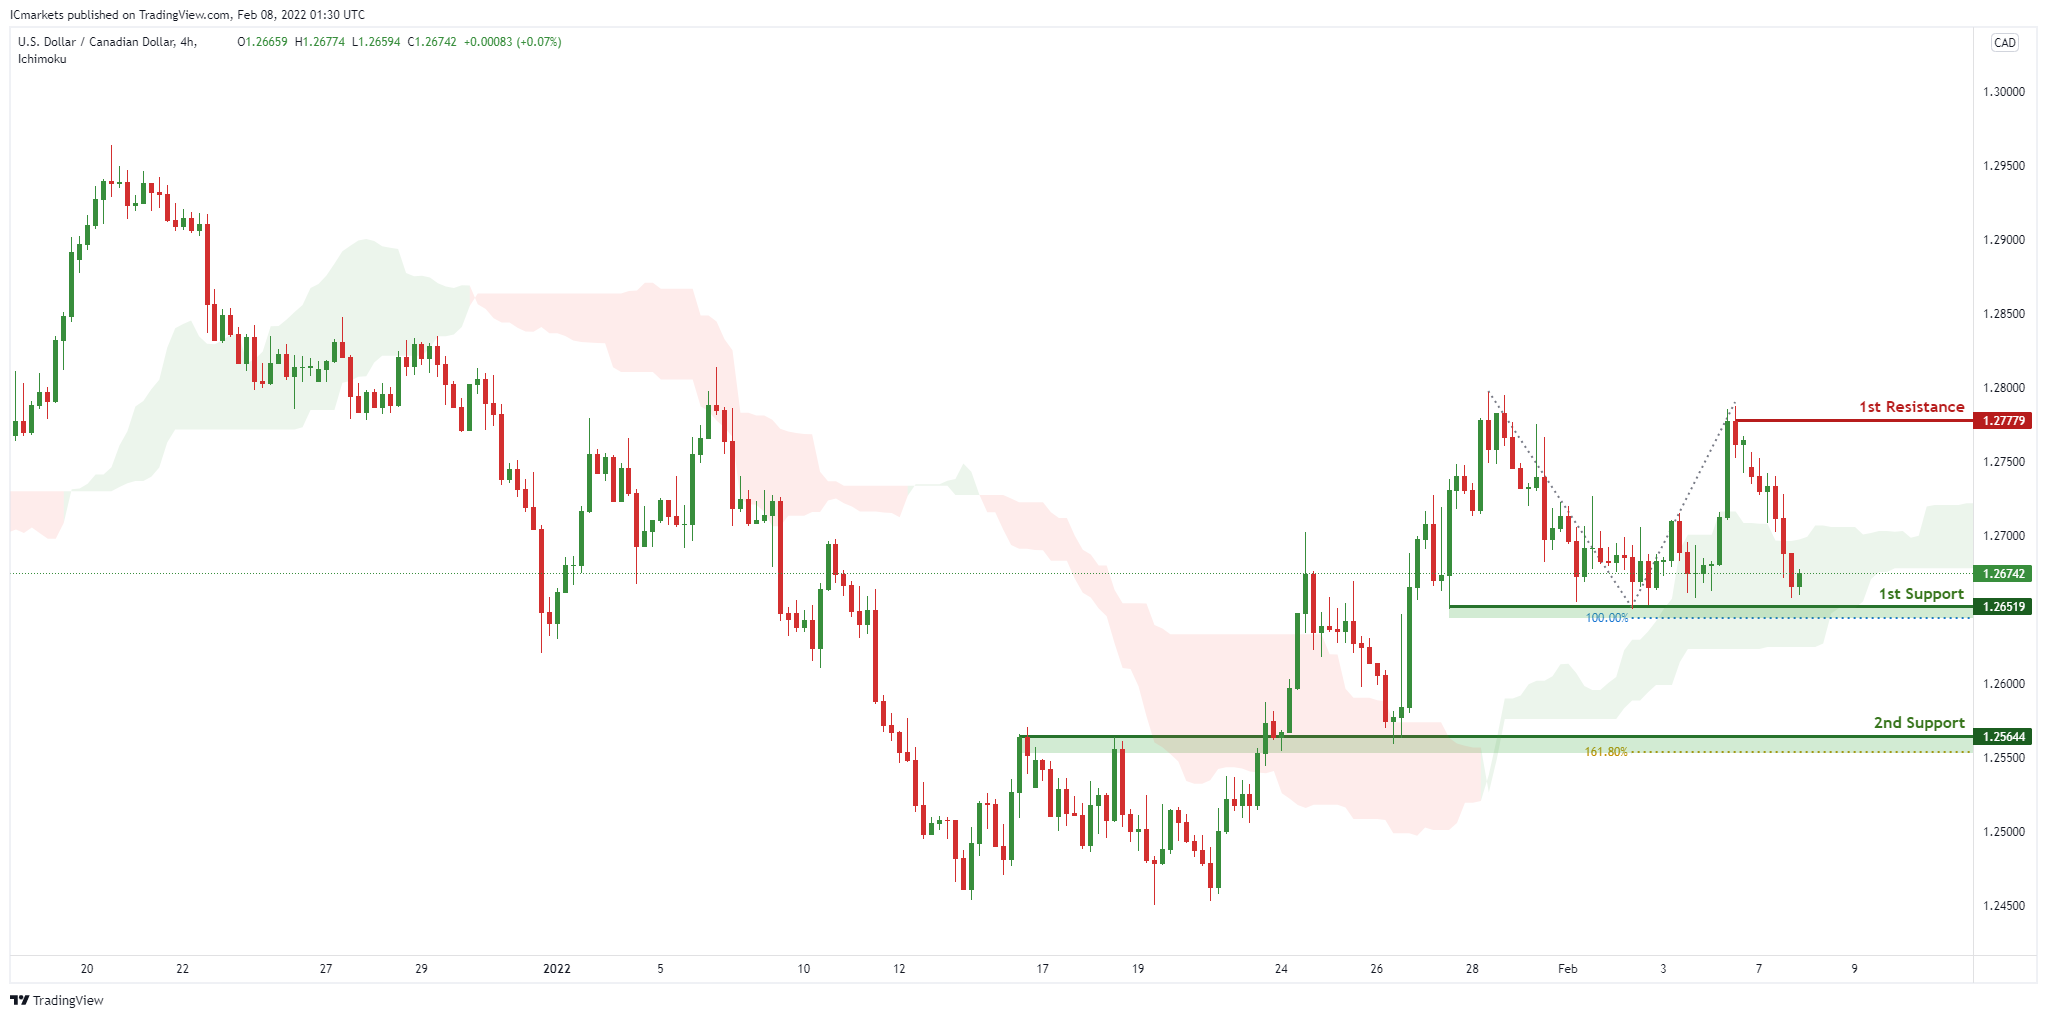
USD/CAD:
On the H4, with prices moving above the ichimoku cloud, we see the potential for a bounce from our 1st support at 1.26519 in line with horizontal swing low support and 100% Fibonacci projection towards our 1st resistance at 1.277779 in line with horizontal swing high resistance. Alternatively, price may break 1st support structure and head for 2nd support at 1.25644, in line with the horizontal overlap support.
Areas of consideration:
- H4 time frame, 1st support at 1.26519
- H4 time frame, 1st resistance at 1.277779
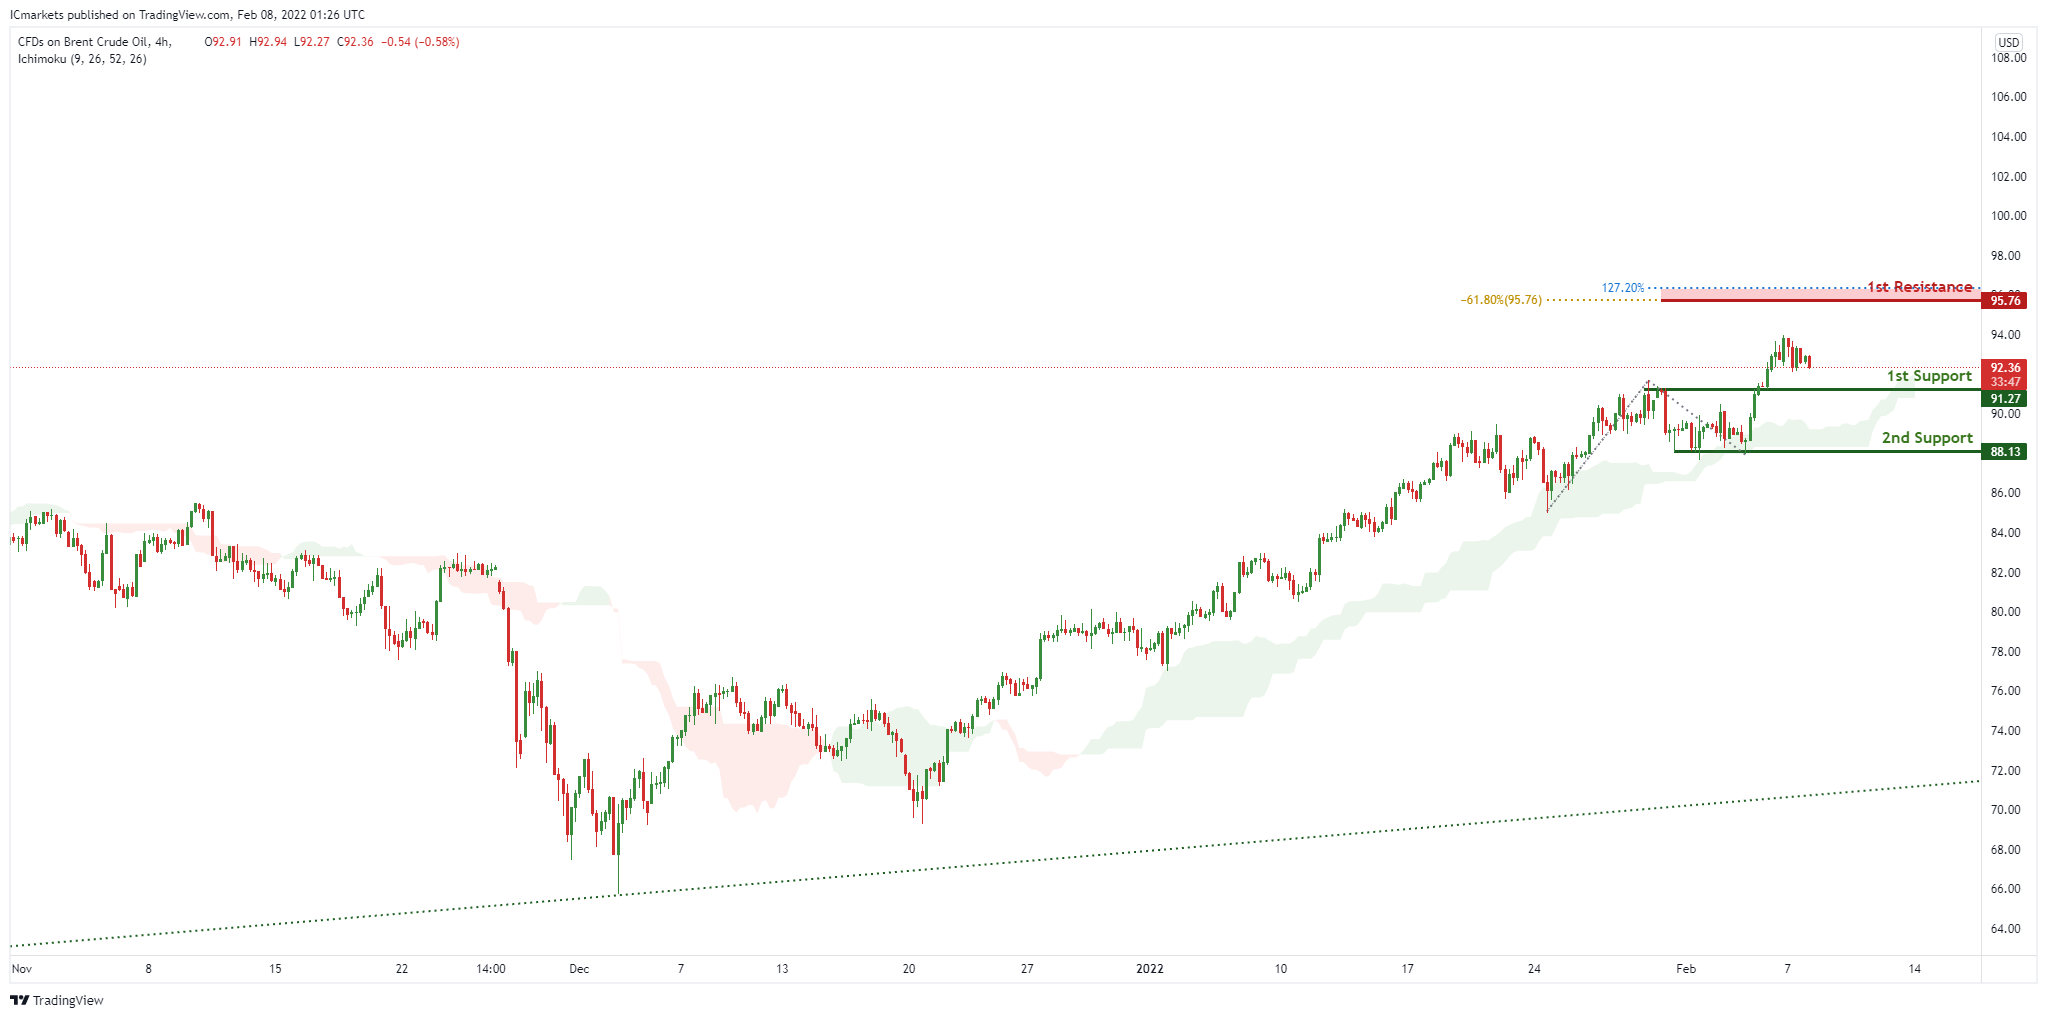
OIL:
On the H4, with prices moving above the ichimoku cloud, we see the potential for a bounce from our 1st support at 91.27 in line with horizontal overlap support towards our 1st resistance at 95.76 in line with the 127.2% Fibonacci extension and -61.8% Fibonacci expansion. Alternatively, price may break 1st support structure and head for 2nd support at 88.13, in line with the horizontal swing low support.
Areas of consideration:
- H4 time frame, 1st resistance of 95.76
- H4 time frame, 1st support of 91.27
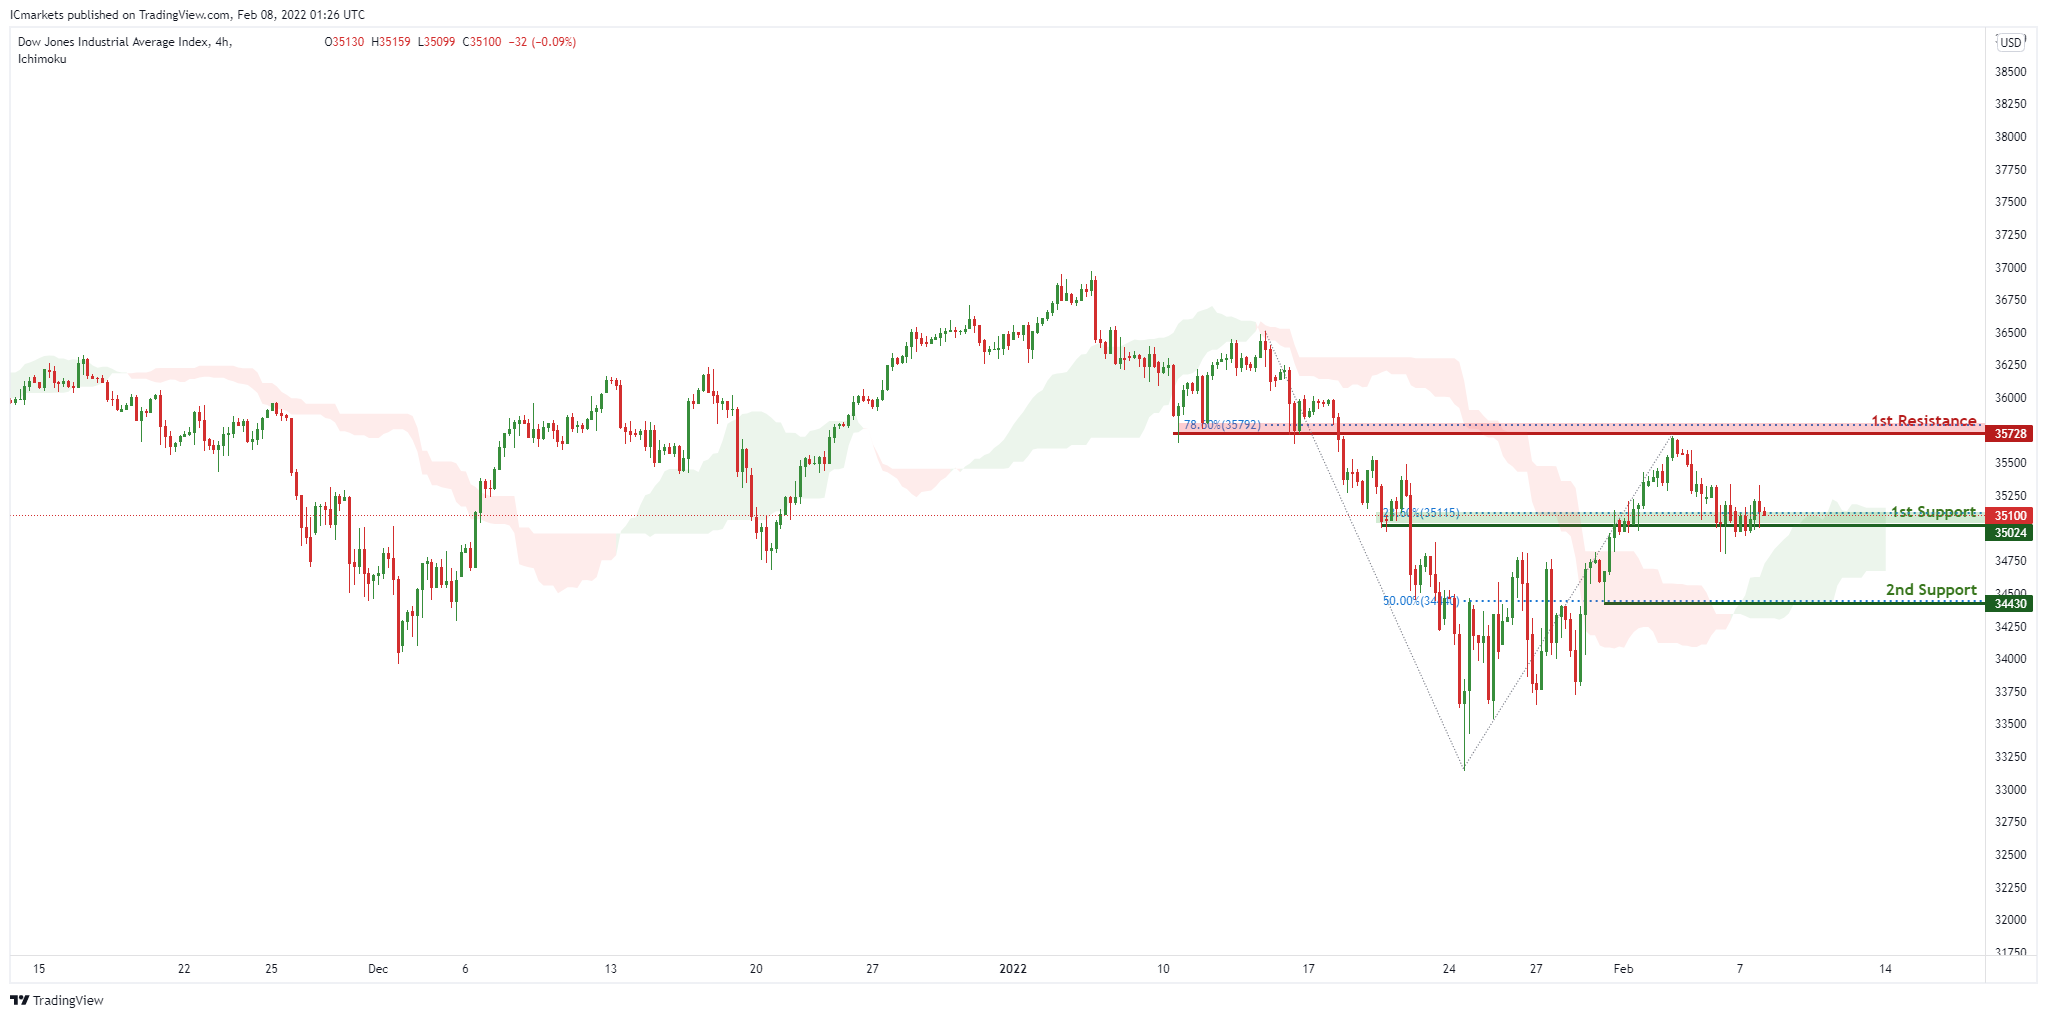
Dow Jones Industrial Average:
On the H4, with price moving above the ichimoku cloud, signifying an overall bullish momentum. We can expect price to rise to our 1st resistance at 35728 in line horizontal graphical swing high resistance and 78.6% Fibonacci retracement from our 1st support in line with horizontal overlap support and 23.6% Fibonacci retracement level at 35024. Alternatively, price may break 1st support structure and head for 2nd support, which coincides with 50% Fibonacci retracement level at 34430.
Areas of consideration:
- H4 time frame, 1st resistance of 35728
- H4 time frame, 1st support of 35024
The accuracy, completeness and timeliness of the information contained on this site cannot be guaranteed. IC Markets does not warranty, guarantee or make any representations, or assume any liability regarding financial results based on the use of the information in the site.
News, views, opinions, recommendations and other information obtained from sources outside of www.icmarkets.com.au, used in this site are believed to be reliable, but we cannot guarantee their accuracy or completeness. All such information is subject to change at any time without notice. IC Markets assumes no responsibility for the content of any linked site.
The fact that such links may exist does not indicate approval or endorsement of any material contained on any linked site. IC Markets is not liable for any harm caused by the transmission, through accessing the services or information on this site, of a computer virus, or other computer code or programming device that might be used to access, delete, damage, disable, disrupt or otherwise impede in any manner, the operation of the site or of any user’s software, hardware, data or property.


