
EUR/USD:
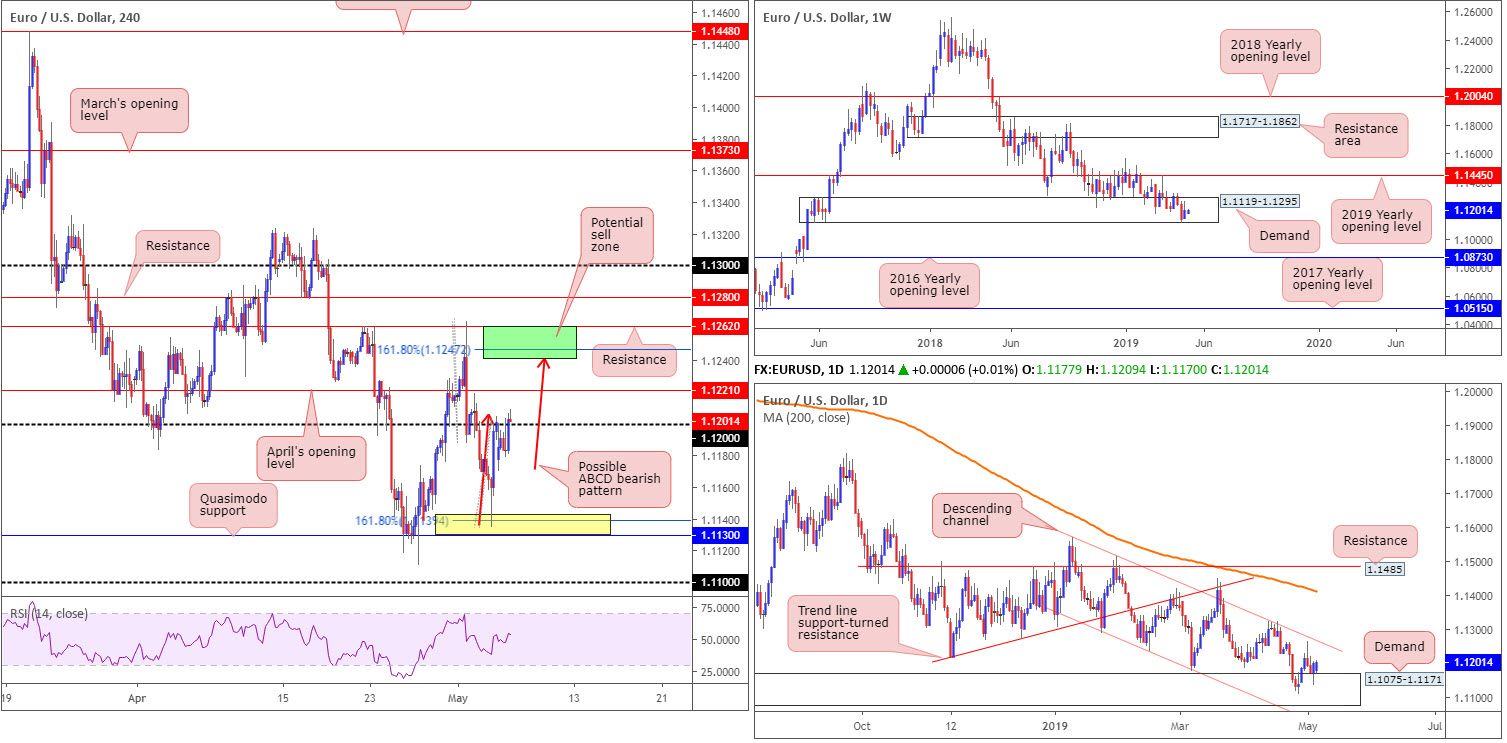
The EUR/USD started the week around 1.1177, marginally lower than Friday’s close. Despite an undesirable open, the pair had little trouble recovering lost ground during early Asia and concluded the day reclaiming 1.12+ status on the H4 timeframe. Above 1.12, as you can see, has April’s opening level at 1.1221 in sight, followed by a rather interesting area of resistance (green) at 1.1262/1.1241 (comprised of a resistance level at 1.1262, a potential ABCD measured move [red arrows] at 1.1241 and a connecting 161.8% Fibonacci ext. point at 1.1247).
On more of a broader perspective, our technical studies have buyers and sellers battling for position within the lower limits of a long-standing weekly demand zone coming in at 1.1119-1.1295. Continued buying may call for a test of weekly resistance plotted at 1.1445, the 2019 yearly opening level, whereas a break lower has the 2016 yearly opening level at 1.0873 in view.
Daily activity continues to dip its toes into demand priced at 1.1075-1.1171 (glued to the underside of the current weekly demand area). Note price action concluded Monday rebounding relatively strongly from the top edge of the zone on this timeframe, potentially setting the stage for an approach to nearby channel resistance taken from the high 1.1569.
Areas of consideration:
Although the market may struggle to reach the H4 green sell zone at 1.1262/1.1241 today, it is certainly an area worthy of note for future use. In addition to its H4 confluence, the zone merges closely with the daily channel resistance highlighted above.
Should 1.1262/1.1241 enter the mix quicker than expected, traders are urged to wait and see if H4 price is able to chalk up a bearish candlestick formation before pulling the trigger. That way, you have not only identified seller intent, you also have entry and risk levels to work with (according to the pattern’s structure).
Today’s data points: EU Economic Forecasts; FOMC Member Quarles Speaks.
GBP/USD:
Sterling reclaimed a large portion of Friday’s NFP-induced gains Monday, weakened on the back of comments from senior Labour figures, who chucked cold water over the prospect of an imminent cross-party development.
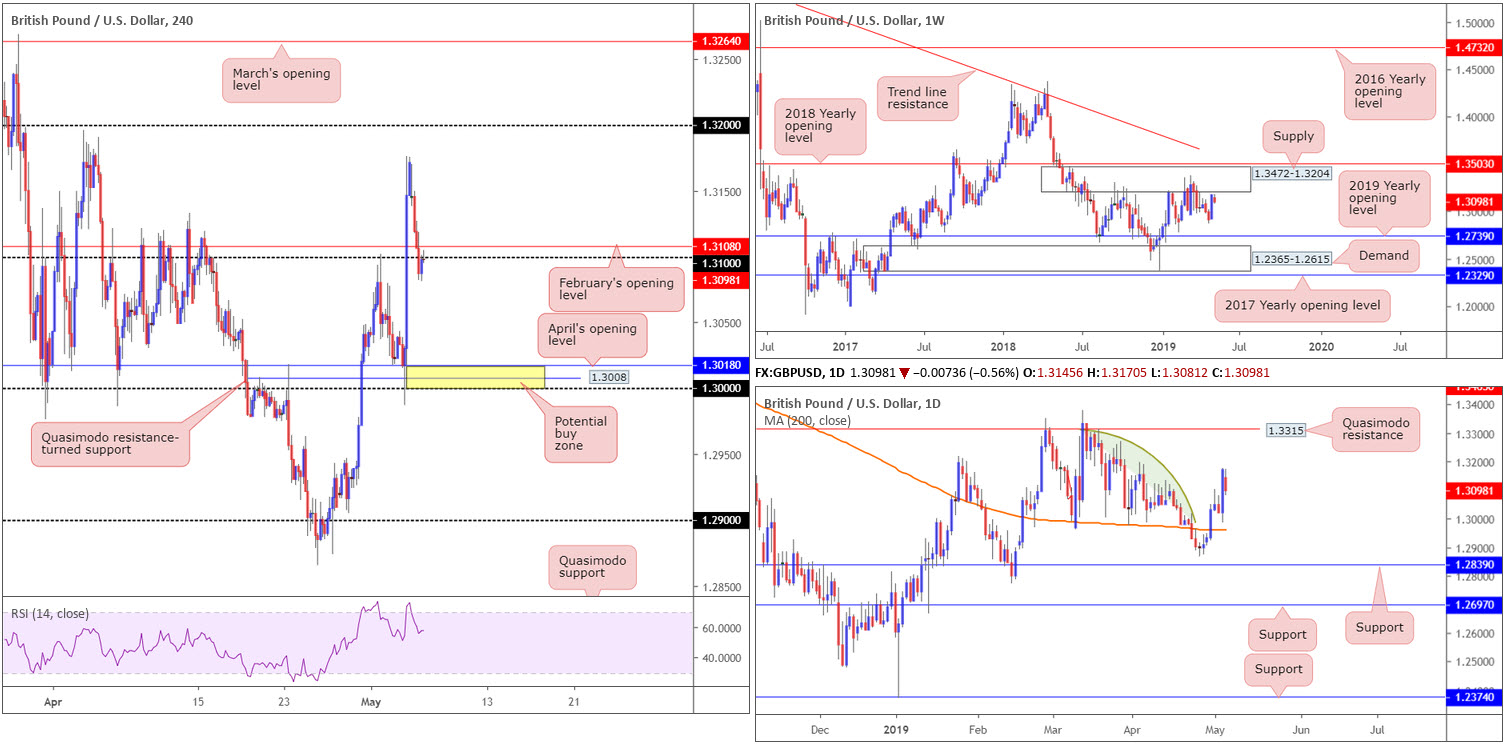
From a technical viewpoint, the H4 candles trade sub 1.31, as we write, dipping from Friday’s peak of 1.3176. Assuming price action remains defensive beneath the said psychological mark, sellers have room to manoeuvre towards April’s opening level plotted at 1.3018, shadowed closely by support at 1.3008 and then the key figure 1.30 (yellow zone).
Higher-timeframe flows has weekly price displaying signs of weakness ahead of a notable supply zone at 1.3472-1.3204, situated a few points south of the 2018 yearly opening level at 1.3503. Having observed this area hold price action lower on a number of occasions in the past, history has a good chance of repeating itself here should the area eventually be tested.
Daily movement, on the other hand appears to be trading in no man’s land between Quasimodo resistance at 1.3315 and the 200-day SMA (orange). Traders may also want to acknowledge to the left of current price limited supply is visible (the green arc pattern is there to mark consumed supply – notice price action filled each supply before turning lower).
Areas of consideration:
According to the H4 timeframe, two possible scenarios may play out:
- A simple retest play at the underside of 1.31. Should price action hold the underside of this number in the shape of a bearish candlestick formation (entry and risk parameters can be determined according to the pattern’s rules), a sell from here, targeting the 1.30/1.3018 H4 support region is an option.
- The H4 support area mentioned above at 1.30/1.3018, although a target for shorts, is also a base worthy of longs in light of its local confluence. There is a cautionary point to include, however, and that’s the threat of a fakeout occurring through 1.30, which is common viewing around psychological numbers to run stops. For that reason, waiting for additional confirmation to form before pulling the trigger is recommended.
Today’s data points: MPC Member Cunliffe Speaks; MPC Member Haldane Speaks; FOMC Member Quarles Speaks.
AUD/USD:
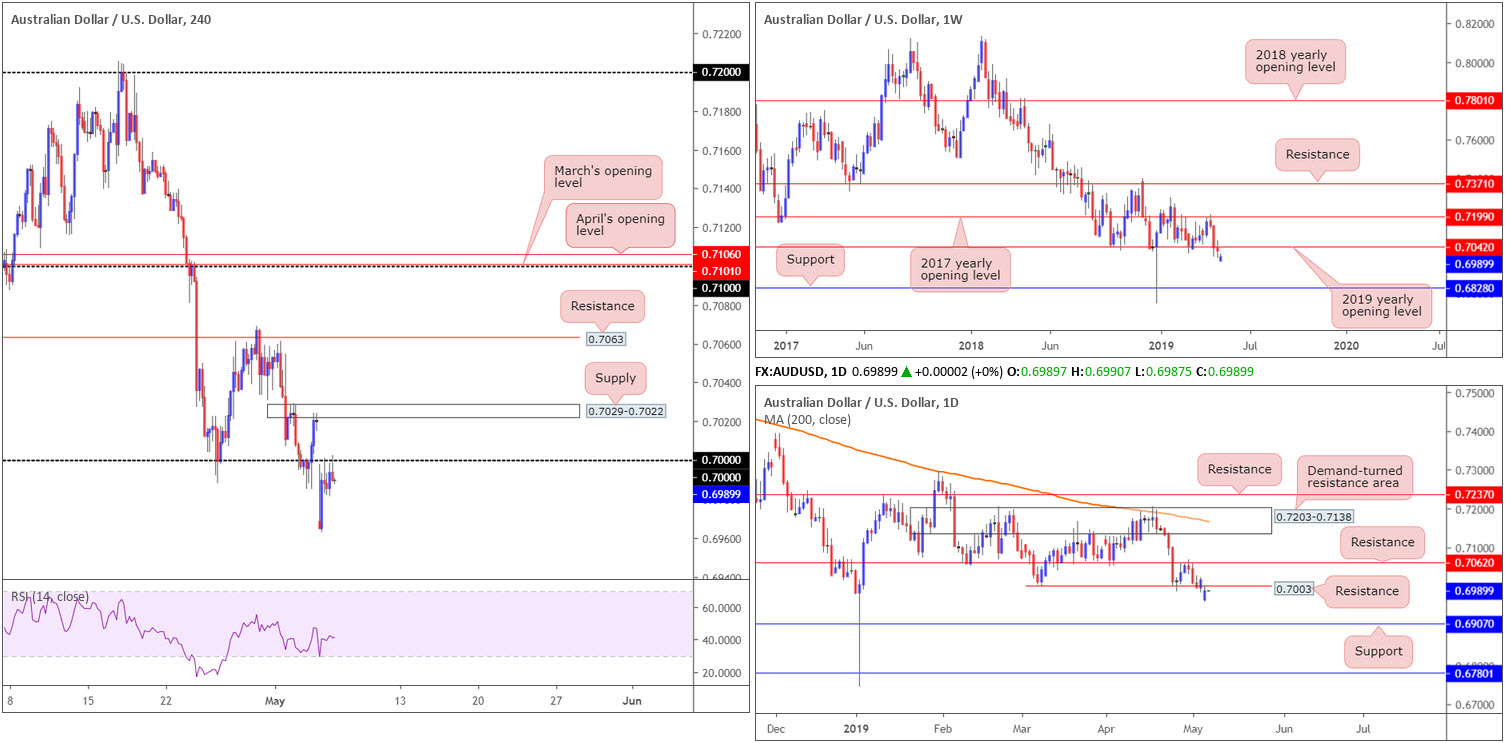
The Australian dollar declined sharply in the initial hour of trading Monday, after concerns resurfaced regarding US tariff threats. As is evident from the H4 chart, the candles failed to recover the weekend’s losses against its US counterpart, concluding the day consolidating beneath the psychologically important 0.70 handle.
Above 0.70 on the H4 timeframe, price action has a supply zone drawn from 0.7029-0.7022 in view, trailed by a resistance level coming in at 0.7063. It might also be of interest to some traders to note the research team sees limited support in view beneath 0.70 until 0.69.
Higher-timeframe analysis shows the pair trading beneath the 2019 yearly opening level at 0.7042 on the weekly timeframe. Subject to sellers remaining in the driving seat below 0.7042, the pair is effectively starved of support until shaking hands with 0.6828 – more than 200 points.
The story on the daily timeframe has the unit testing waters just south of a support-turned resistance level at 0.7003. A rejection off of this level could potentially stretch as far south as support at 0.6907, whereas a move higher has resistance to target at 0.7062.
Areas of consideration:
On account of the above, traders are urged to keep eyes open for a rejection off the underside of 0.70 today (preferably by way of a H4 bearish candlestick formation [entry/risk parameters can be defined according to this structure]), targeting daily support at 0.6907 as an initial take-profit zone.
Today’s data points: Australian Retail Sales m/m; Australian Trade Balance; Australian Cash Rate and RBA Rate Statement; FOMC Member Quarles Speaks.
USD/JPY:
US/China trade was the central theme Monday, with weekend tweets from US President Trump threatening to raise tariffs on $200 billion of Chinese goods, consequently powering fears that trade negotiations were on the verge of collapse.
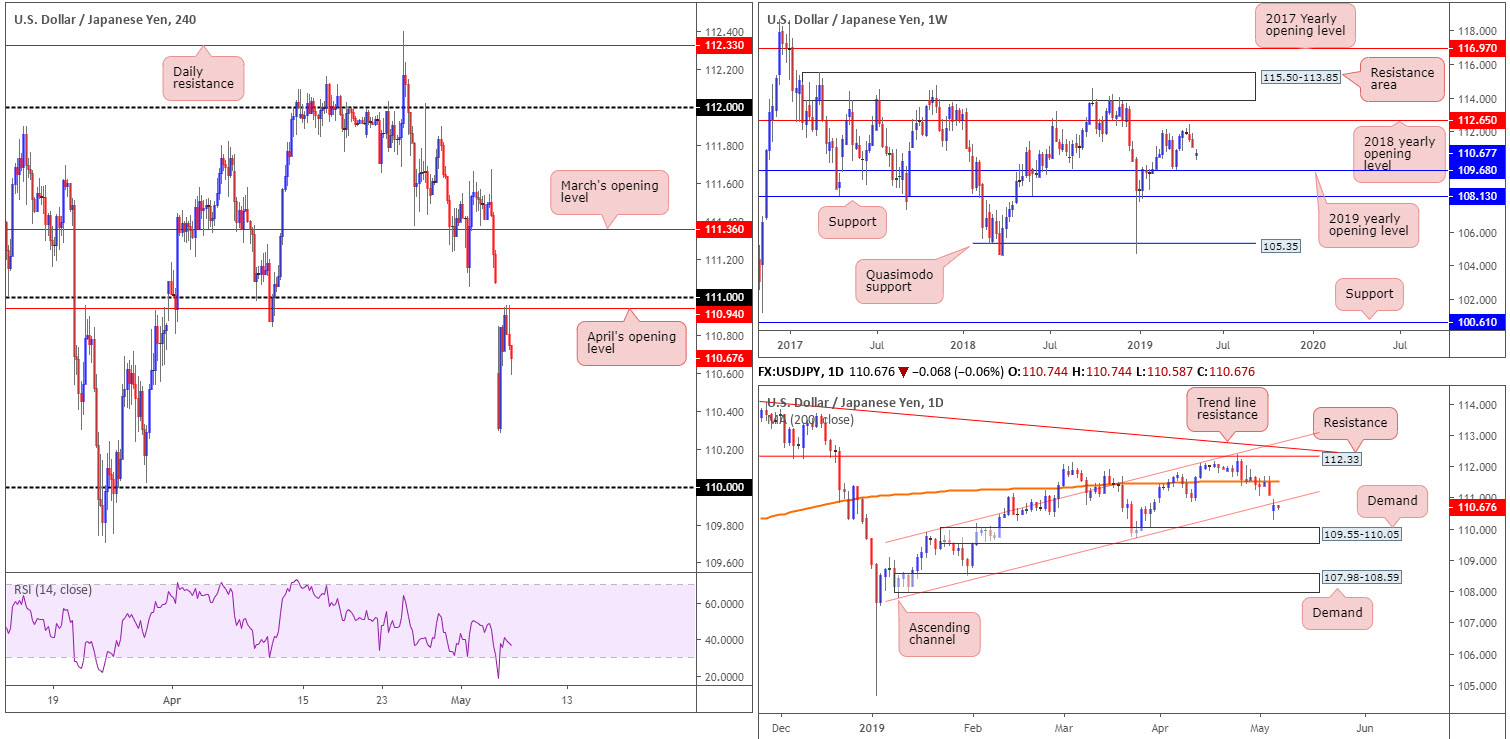
The Japanese yen was the main G10 beneficiary amid the risk-off start to the week, in which USD/JPY gapped below the 111 handle to lows of 110.28. Price action chalked up a steady intraday recovery following the open, with the unit retesting the underside of April’s opening level at 110.94 (sited just south of the 111 handle) and holding form.
In terms of where we stand on the daily timeframe, yesterday’s bout of selling also pulled price outside of its ascending channel formation (107.77). This has potentially set the stage for a run towards demand priced in at 109.55-110.05. Further selling on the weekly timeframe has the 2019 yearly opening level at 109.68 to target.
Areas of consideration:
Having seen all three timeframes exhibit scope to press for lower ground, an ideal scenario would be for the H4 candles to revisit 111ish again. A retest of this handle, coupled with additional bearish confirmation – think candlestick confirmation or an MA crossover – is likely to draw interest, targeting Monday’s session low point of 110.28 as the initial base for targets. The reason behind requiring additional confirmation when all three timeframes display room to probe lower is due to the round numbers being prone to fakeouts and the weekend gap (above 111) still open for a fill.
Today’s data points: FOMC Member Quarles Speaks.
USD/CAD:
Outlook unchanged.
The US dollar rose strongly vs. its Canadian counterpart in the early hours of Monday, as markets responded to US President Trump threatening to raise tariffs on $200 billion of Chinese goods over the weekend via Twitter.
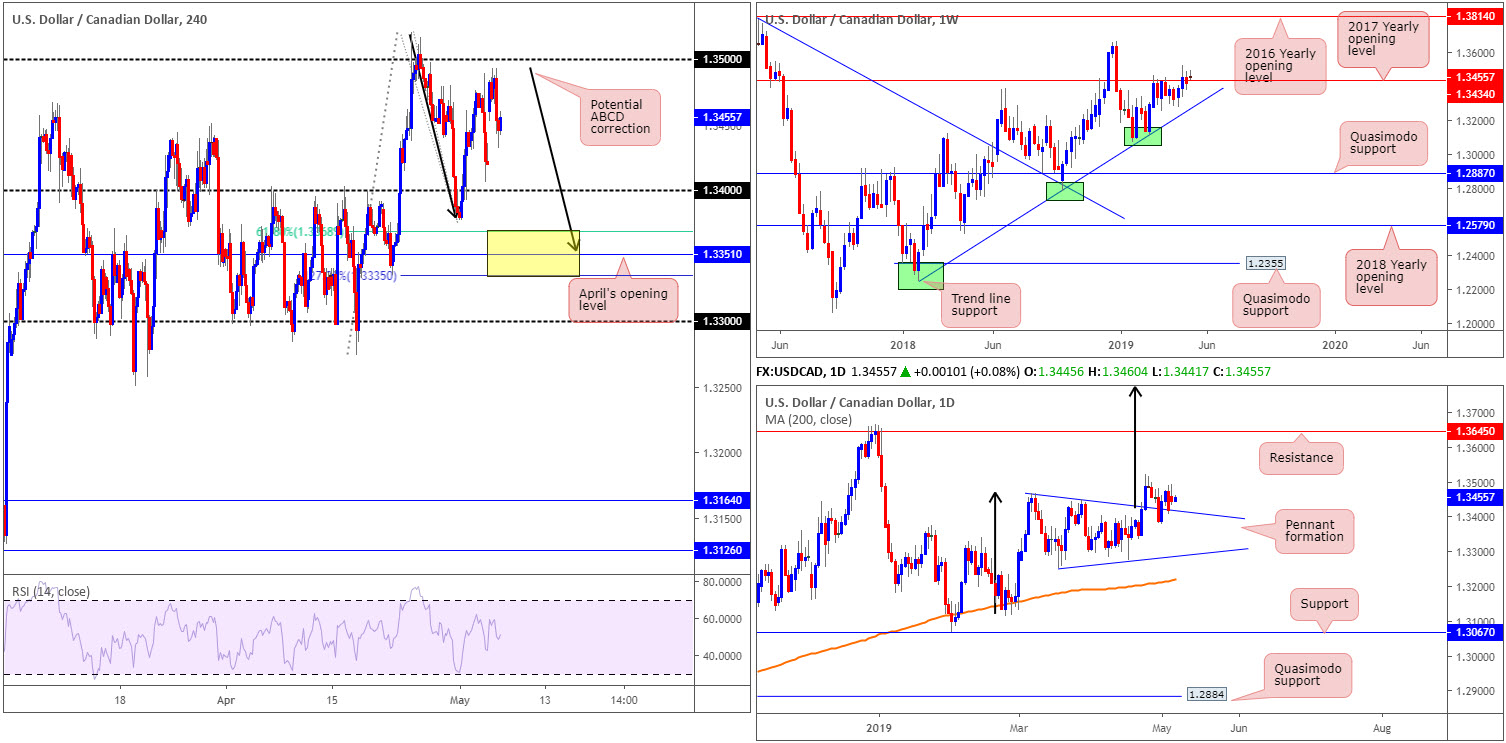
Following an advance to session highs of 1.3494, the H4 candles formed a tight consolidation just south of the 1.35 handle, though did eventually manage to fill a portion of the weekend’s gap in the later stages of the day. 1.34 could hold price action higher early week, though the more appealing area of support (in terms of H4 confluence) resides lower down on the chart between (yellow) at 1.3335/1.3368. Comprised of April’s opening level at 1.3351 as the centre line, a 61.8% Fibonacci support value at 1.3368 and a potential ABCD (black arrows) 127.2% Fibonacci ext. point at 1.3335, this zone offers reasonably strong local confluence.
On a wider perspective, longer-term flows remain circulating around the 2017 yearly opening level at 1.3434. Beneath this base, traders’ crosshairs are fixed on trend line support taken from the low 1.2247, whereas continued buying could eventually lead to a move materialising in the direction of the 2018 yearly high of 1.3664.
A closer reading of price action shows the daily candles continue to feed off support drawn from the top edge of a pennant pattern (1.3467). Although the traditional price target (calculated by taking the distance from the beginning of the preceding move and adding it to the breakout price) will remain on the chart (black arrows), the next upside target from a structural standpoint falls in around resistance at 1.3645.
Areas of consideration:
On account of our technical studies, 1.34 is a level of support to watch today given its close connection with the top edge of the daily pennant pattern.
The yellow H4 zone highlighted above at 1.3335/1.3368 is also likely to offer a bounce this week, in view of its H4 confluence.
Irrespective of which area is chosen (if any), traders may want to consider waiting and seeing if the H4 candles chalk up a bullish candlestick signal (entry and risk can then be determined according to the pattern’s rules) before pulling the trigger.
Today’s data points: FOMC Member Quarles Speaks; CAD Ivey PMI.
USD/CHF:
Outlook unchanged.
A large chunk of Friday’s losses from the latest US employment release were reclaimed Monday as the unit headed northbound and clocked a peak just south of 1.02 at 1.0196. In terms of the market’s technical structure, little has changed. For that reason, much of the following segment will echo points put forward in Monday’s briefing.
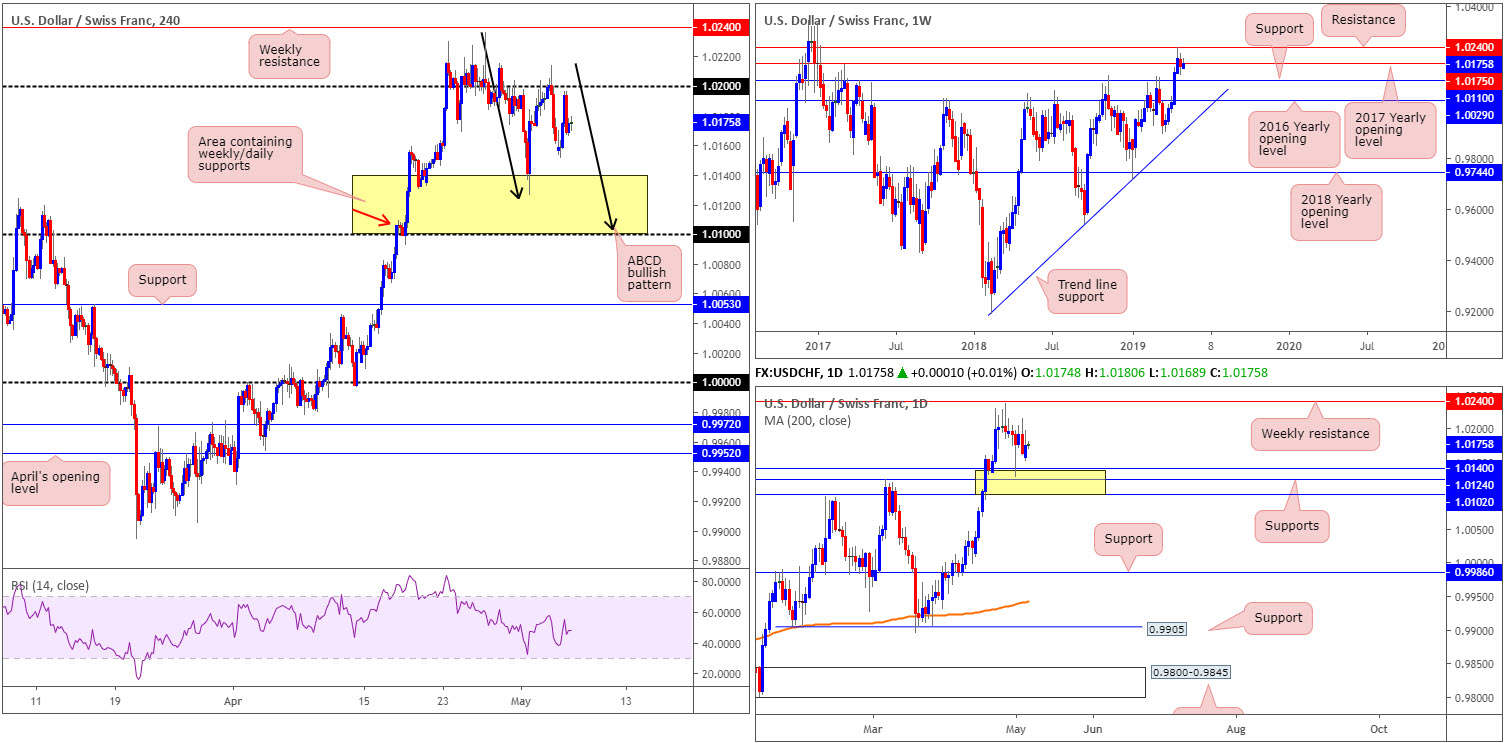
Starting with a look at the weekly timeframe, renewed selling interest emerged last week after recently coming into close contact with resistance at 1.0240, consequently hauling price action marginally beneath its 2017 yearly opening level at 1.0175. Though the chart shows signs of seller intent, traders may want to recognise support resting close by at 1.0110, followed by the 2016 yearly opening level at 1.0029.
By way of a bearish engulfing pattern, daily movement ended the week facing a possible test of three nearby layers of support coming in at 1.0102/1.0140. Note this area also happens to hold the weekly support mentioned above at 1.0110 within. A move below here, nonetheless, exhibits scope to press as far south as support coming in at 0.9986.
According to H4 structure, the pair is in the process of chalking up an ABCD measured correction (black arrows) that terminates a few points north of 1.01. The yellow zone enveloping the ABCD termination point represents the area of daily supports between 1.0102/1.0140.
Areas of consideration:
Keeping it as simple as possible, the research team has eyes on the yellow area of daily supports, in particular the lower boundary of the zone: the H4 ABCD termination point around 1.0103. Without waiting for additional confirmation, traders are likely looking to enter at 1.0103 and position stops just south of nearby H4 demand (red arrow) at 1.0093-1.0108.
Today’s data points: FOMC Member Quarles Speaks.
Dow Jones Industrial Average:
US equities overturned the majority of their losses Monday as concerns over US President Donald Trump’s threat to increase tariffs on Chinese goods faded.
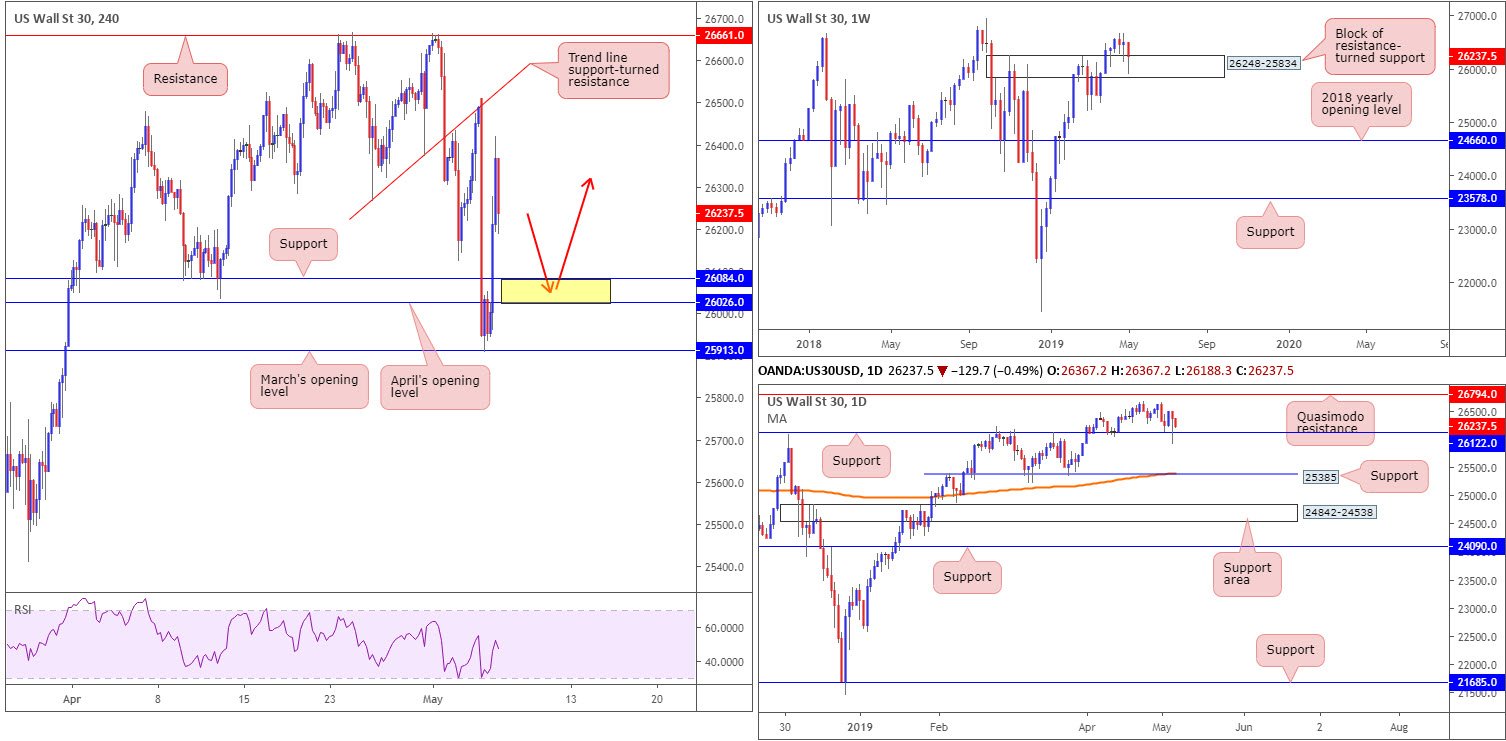
The Dow Jones Industrial Average dropped more than 2.00% at the open from a H4 trend line support-turned resistance etched from the low 26265, clocking a session low of 25907 and challenging March’s opening level at 25913 on the H4 timeframe. As evident from the chart, price action climbed back above April’s opening level at 26026 and reached highs of 26421.
Interestingly, yesterday’s movement pencilled in a hammer candlestick pattern on the daily timeframe off support drawn from 26122. In the event this draws in sufficient interest, the next port of call can be seen at a Quasimodo resistance taken from 26794. In conjunction with daily structure, weekly price is also seen shaking hands with a resistance-turned support area at 26248-25834. If further buying develops this week, the next call to the upside on this timeframe can be seen around the all-time high of 26939.
Areas of consideration:
With both weekly and daily structures portending higher moves, a retest of the yellow H4 zone comprised of April’s opening level at 26026 and H4 support at 26084 may be of interest this morning. Conservative traders might wish to allow the move some latitude to develop before pulling the trigger by waiting and seeing if H4 price chalks up a bullish candlestick signal. Traders then have the option of entering based on the candlestick’s rules of engagement.
Today’s data points: FOMC Member Quarles Speaks.
XAU/USD (GOLD):
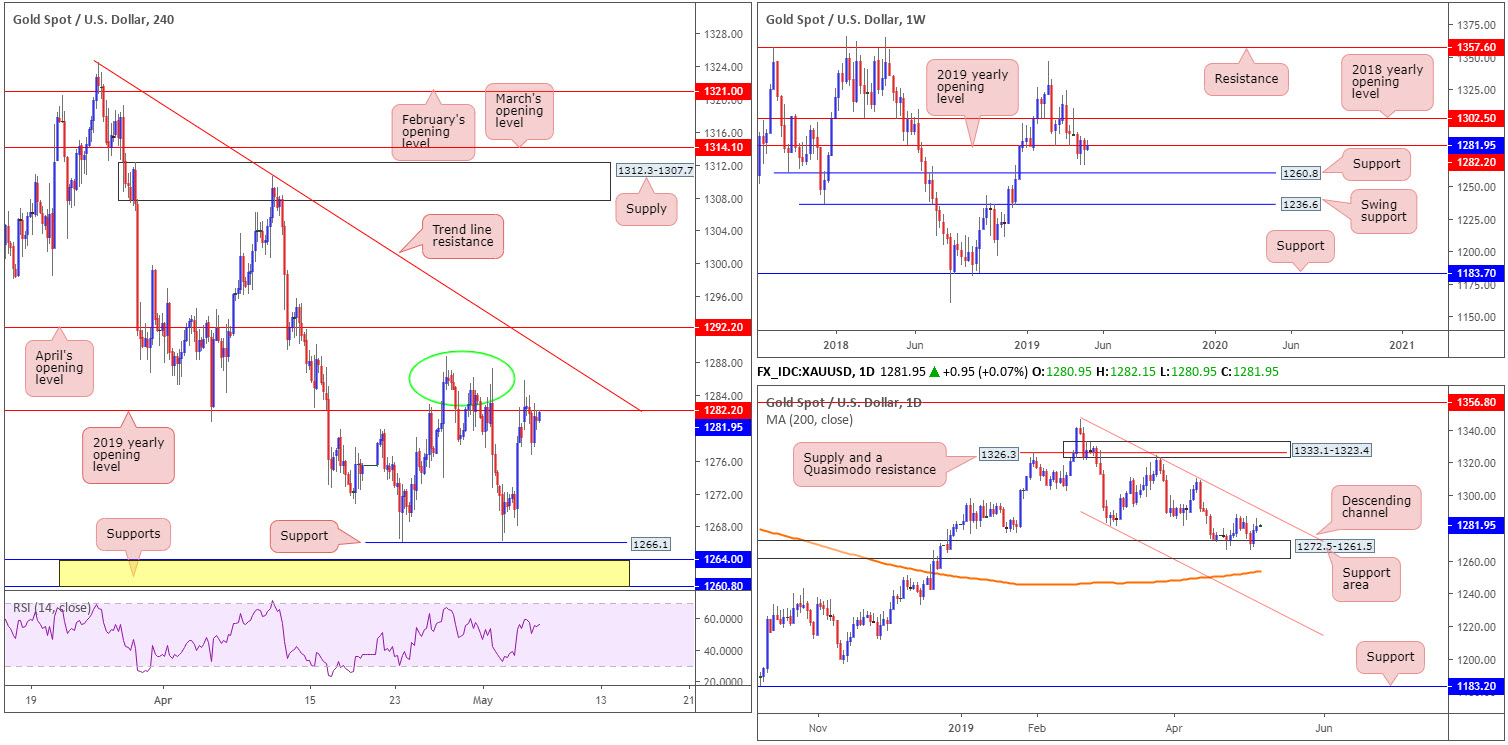
In $ terms, the price of spot gold climbed marginally higher Monday, up 0.16%. According to weekly price, bullion remains teasing the underside of its 2019 yearly opening level at 1282.2. Further selling from this point has support coming in at 1260.8, whereas a move above 1282.2 may call for an approach in the direction of the 2018 yearly opening level at 1302.5.
Contrary to weekly structure suggesting a move lower, daily flow is seen making headway off a support area coming in at 1272.5-1261.5, Supported since mid-April, the next upside target from here can be seen around channel resistance drawn from the high 1346.7.
The H4 candles now face possible resistance emerging around the 2019 yearly opening level on the weekly timeframe at 1282.2, followed by a lump of resistance around the 1284.0ish region (green circle). Not too far above here, traders may also recognise trend line resistance extended from the high 1324.5, shadowed closely by April’s opening level at 1292.2.
Areas of consideration:
Given the H4 candles remain languishing beneath the 2019 yearly opening level at 1282.2, coupled with a block of H4 resistance (green circle) seen nearby at 1284.0ish, Friday and Monday’s bullish run may be hindered today.
As such, traders can ‘expect’ a move lower this week, targeting H4 support at 1266.1 as the initial port of call (positioned within the walls of the current daily support area at 1272.5-1261.5). Should a notable H4 bearish candlestick pattern print from 1282.2 today, therefore, a short could be considered (entry and risk levels can then be determined according to the pattern’s guidelines).
The accuracy, completeness and timeliness of the information contained on this site cannot be guaranteed. IC Markets does not warranty, guarantee or make any representations, or assume any liability with regard to financial results based on the use of the information in the site.
News, views, opinions, recommendations and other information obtained from sources outside of www.icmarkets.com.au, used in this site are believed to be reliable, but we cannot guarantee their accuracy or completeness. All such information is subject to change at any time without notice. IC Markets assumes no responsibility for the content of any linked site. The fact that such links may exist does not indicate approval or endorsement of any material contained on any linked site.
IC Markets is not liable for any harm caused by the transmission, through accessing the services or information on this site, of a computer virus, or other computer code or programming device that might be used to access, delete, damage, disable, disrupt or otherwise impede in any manner, the operation of the site or of any user’s software, hardware, data or property.


