
Key risk events today:
RBA Cash Rate and Rate Statement; Australia Annual Budget Release; ECB President Lagarde Speaks; Canada Trade Balance; Fed Chair Powell Speaks.
(Previous analysis as well as outside sources – italics).
EUR/USD:
Europe’s single currency kicked off the week in fine form against a broadly softer US counterpart, largely backed on a revival of risk appetite.
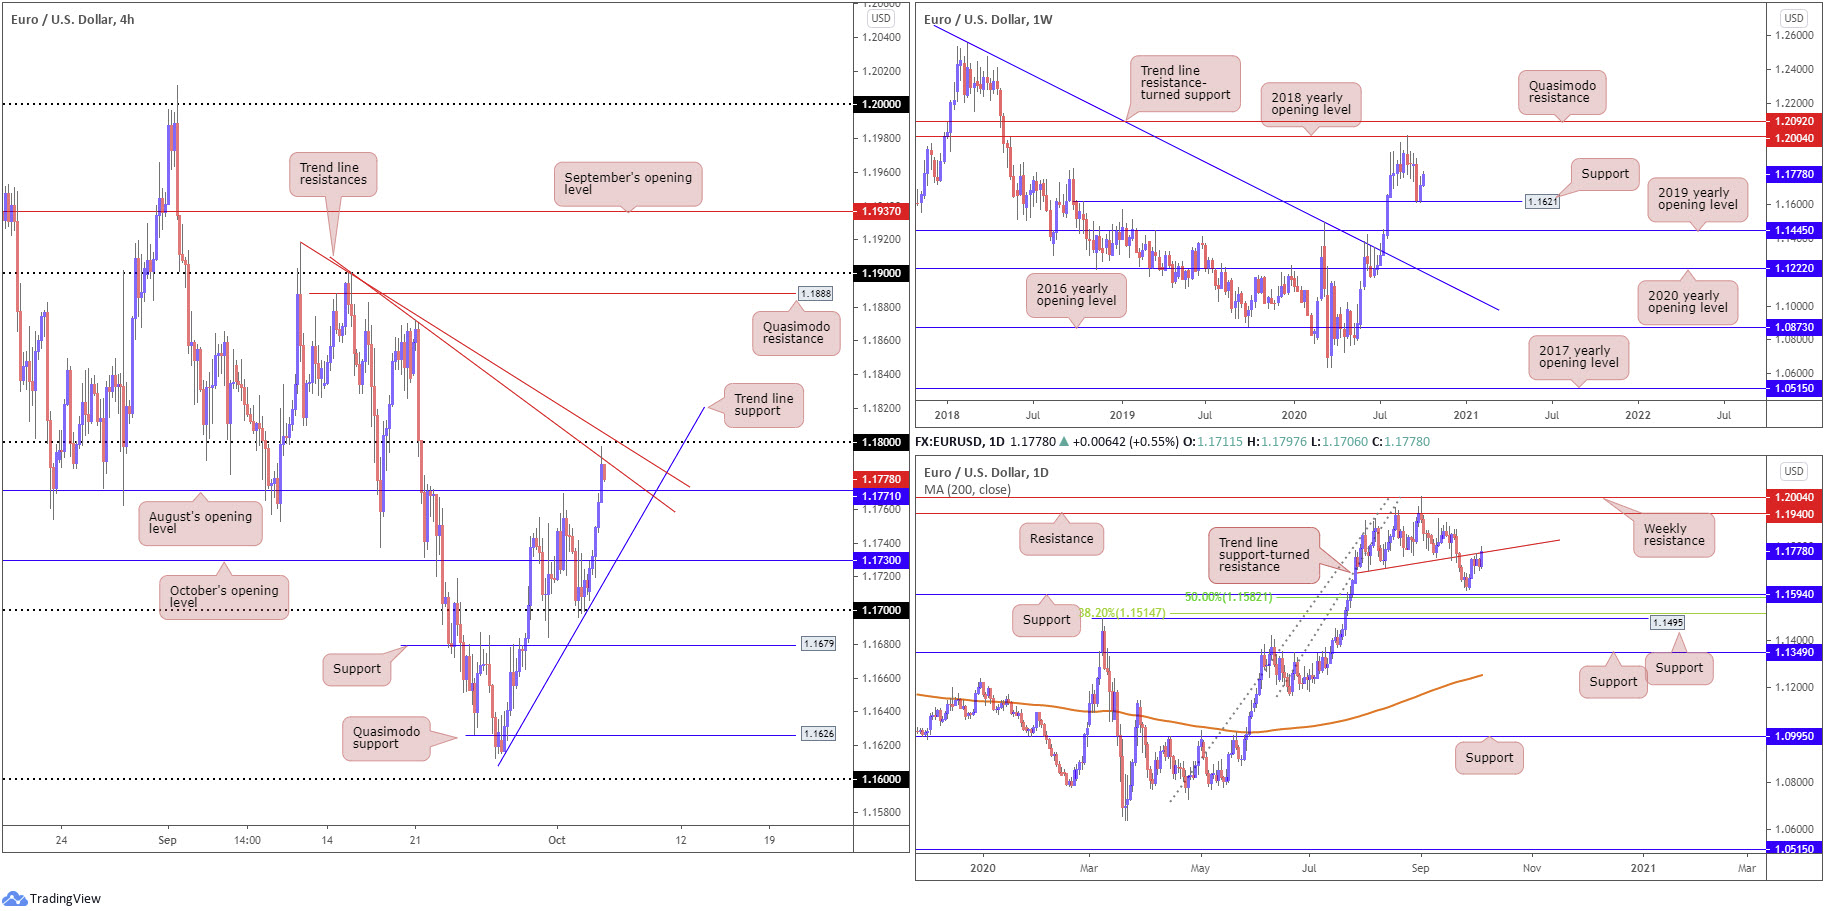
Technically, H4 confronted trend line resistance, extended from the high 1.1900, after climbing August’s opening value at 1.1771 (now serving as possible support). Overhead, we have another trend line resistance in view, taken from the high 1.1917, and also the round number 1.18. Above the said resistances, we do not see much on offer until Quasimodo resistance at 1.1888.
Further out on the weekly timeframe, price action recently responded to minor support at 1.1621, situated just north of the 2019 yearly opening value at 1.1445. An extension to the upside potentially throws the 2018 yearly opening value at 1.2004 back into action.
A closer reading of price action on the daily timeframe reveals the unit challenging a trend line support-turned resistance, etched from the low 1.1695. Violating this line calls for resistance at 1.1940, whereas a rejection shines the spotlight on support at 1.1594 (and 50.0% retracement ratio at 1.1582).
Areas of consideration:
In the event 1.18 cedes ground today, a continuation to H4 Quasimodo resistance at 1.1888 could be on the cards. This setup also falls in line with weekly direction. This may appeal to breakout buyers (conservative traders are likely to seek at least a 1.18 retest before committing).
August’s opening value at 1.1771 could also stand in as support today. Failure here points to a test of H4 trend line support, taken from the low 1.1616.
GBP/USD:
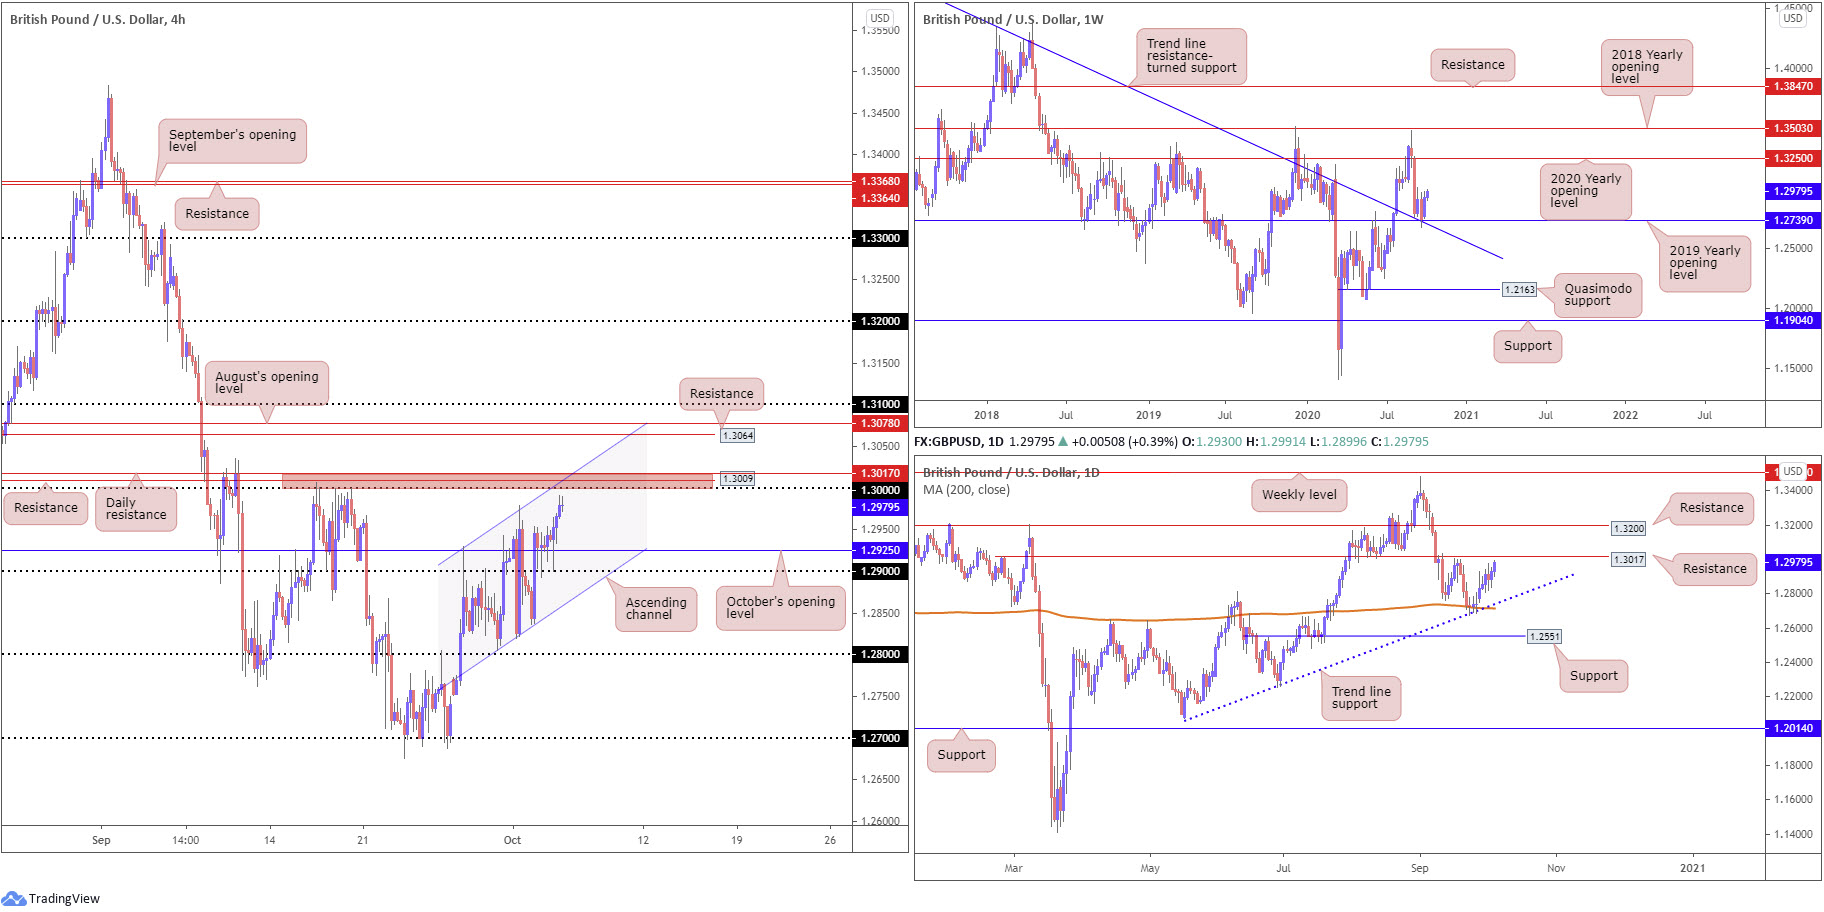
Sterling adopted an offensive phase Monday, in tandem with the greenback’s decline. Following an initial blip through October’s opening value at 1.2925 to lows just ahead of the 1.29 handle, H4, after conquering last Thursday’s 1.2978 peak, is now stationed within striking distance of the key figure 1.30.
Additional resistance can be seen around 1.30: H4 resistance at 1.3009 and daily resistance at 1.3017 (red). On the daily timeframe, the 200-day SMA (orange – 1.2714) and joining trend line support, extended from the low 1.2075, reside to the downside. Above 1.3017 resistance exposes another layer of resistance at 1.3200.
From the weekly timeframe, GBP/USD finished last week higher by nearly 200 points after crossing swords with support at 1.2739, a 2019 yearly opening value. Technicians will acknowledge the level also blends with trend line resistance-turned support, extended from the high 1.5930. In terms of resistance, price has room to advance as far north as the 2020 yearly opening value at 1.3250. Crossing 1.2739, on the other hand, registers a bearish setting, with the 1.2251 June 29 low targeted, closely shadowed by Quasimodo support priced in at 1.2163.
Areas of consideration:
For those who read Monday’s technical briefing you may recall the following (italics):
Buyers, technically speaking, enter the first full week of October with the upper hand, exhibiting room for an intraday push higher on all three timeframes to at least the 1.30 neighbourhood.
With the above in mind, seeking bullish scenarios above October’s opening value at 1.2925 on the H4 in early trading could be an option.
With the help of the 1.29 region, October’s opening value served buyers well on Monday.
Going forward, despite weekly price forecasting additional space to advance, 1.3017/1.30 resistance (red zone on the H4) is marked as a potentially troublesome obstacle for buyers. For that reason, bearish themes could emerge from this region today. Breaking above the area, nonetheless, is likely to prompt further buying to H4 resistance at 1.3064, August’s opening value at 1.3078 and the 1.31 handle.
AUD/USD:
The Australian dollar trades modestly higher against its US counterpart, reinforced by renewed risk appetite.
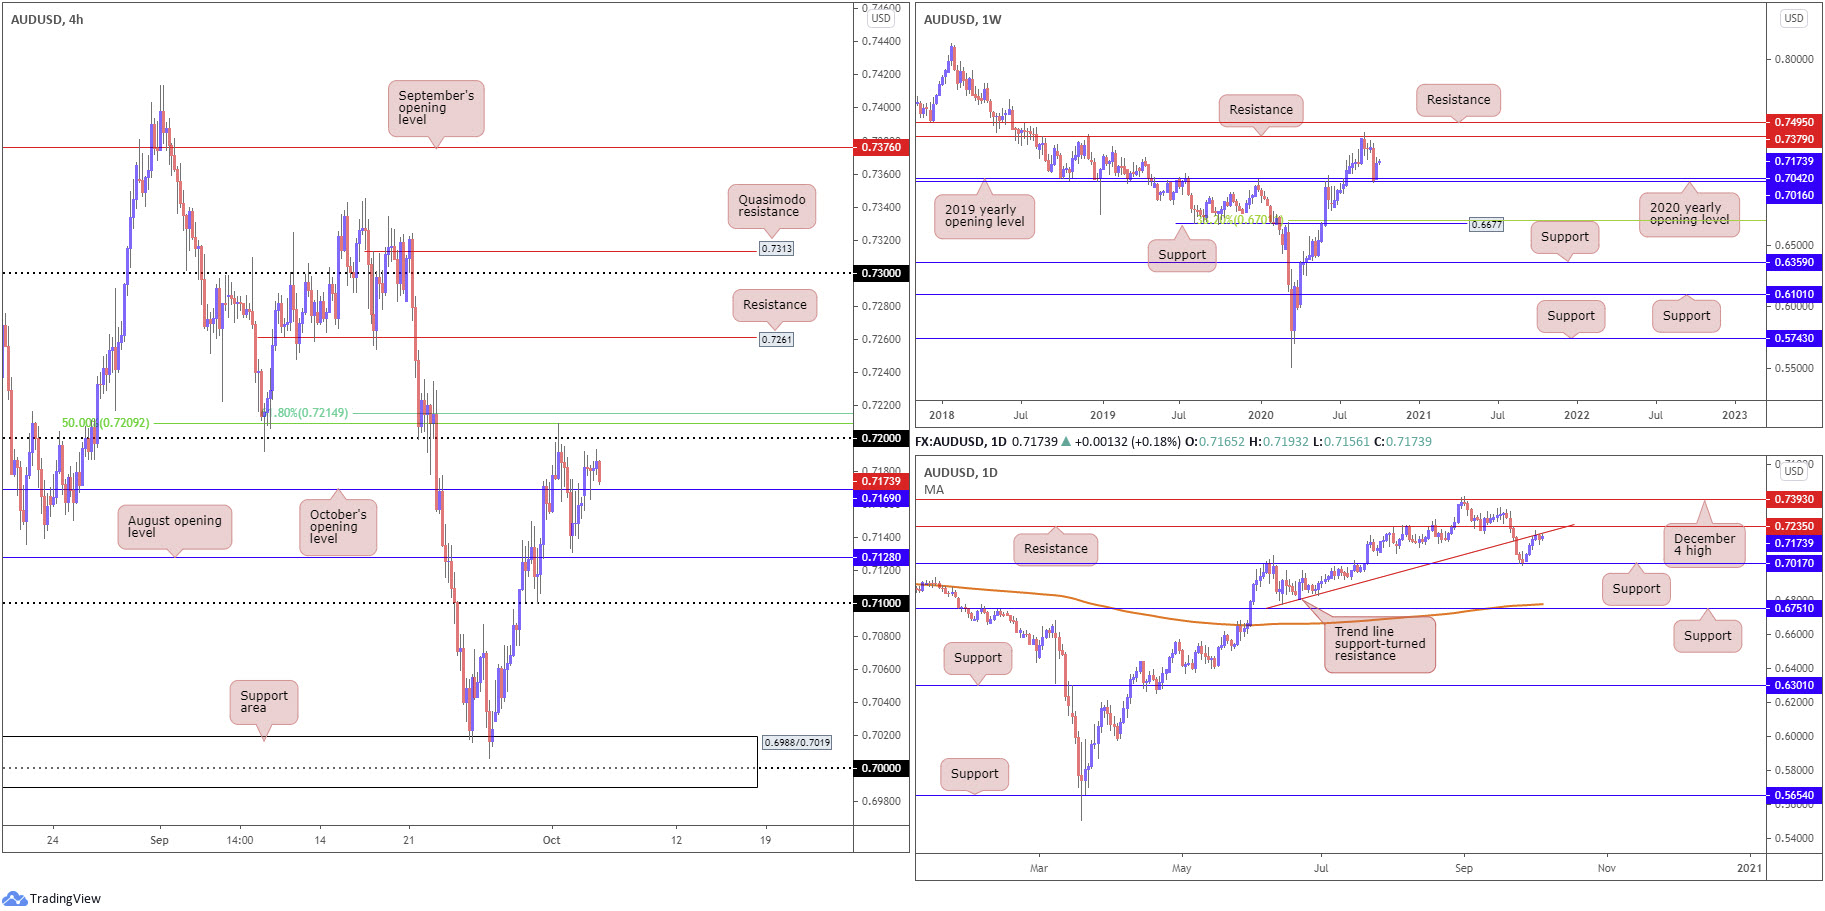
Amidst a lacklustre performance, however, technical development is limited across the three timeframes analysed. Most notable is H4 closing above October’s opening value at 0.7169, consequently shining the headlights on the 0.72 handle and a 50.0% retracement ratio at 0.7209 (positioned a few pips under a 61.8% Fibonacci retracement ratio at 0.7214).
From the weekly timeframe:
Buyers pencilled in a strong presence off the 2020 and 2019 yearly opening values at 0.7016 and 0.7042 last week, respectively, following a 3.6% decline the week prior. Additional bullish sentiment could target as far north as resistance at 0.7379. It might also be worth noting the trend in this market remains to the upside, therefore the rebound from 0.7016/0.7042 may be interpreted as a dip-buying signal. Should the market fail to extend recovery gains, support priced in at 0.6677 is next in the firing range, alongside a 38.2% Fibonacci retracement ratio at 0.6701.
From the daily timeframe:
The rebound from support at 0.7017 sparked a wave of buying last week, drawing enough impetus to challenge trend line support-turned resistance, extended from the low 0.6776 (sited just south of resistance coming in at 0.7235). Above here, traders’ crosshairs will likely be fixed on (December 4 high resistance) at 0.7393.
Areas of consideration:
Buyers, based on the weekly timeframe, face resistance on the daily chart. For that reason, bearish scenarios could still present themselves.
Should H4 hold above October’s opening value at 0.7169, another run at 0.72 (and Fibonacci resistances) could be in the offing. Breakout buyers eyeing a move above 0.72, on the back of weekly price rebounding from support, must contend with daily resistance at 0.7235. Conservative traders are likely to seek at least a H4 close above 0.7235 before considering bullish positions.
Breaking back under 0.7169, on the other hand, signals daily strength from trend line resistance.
USD/JPY:
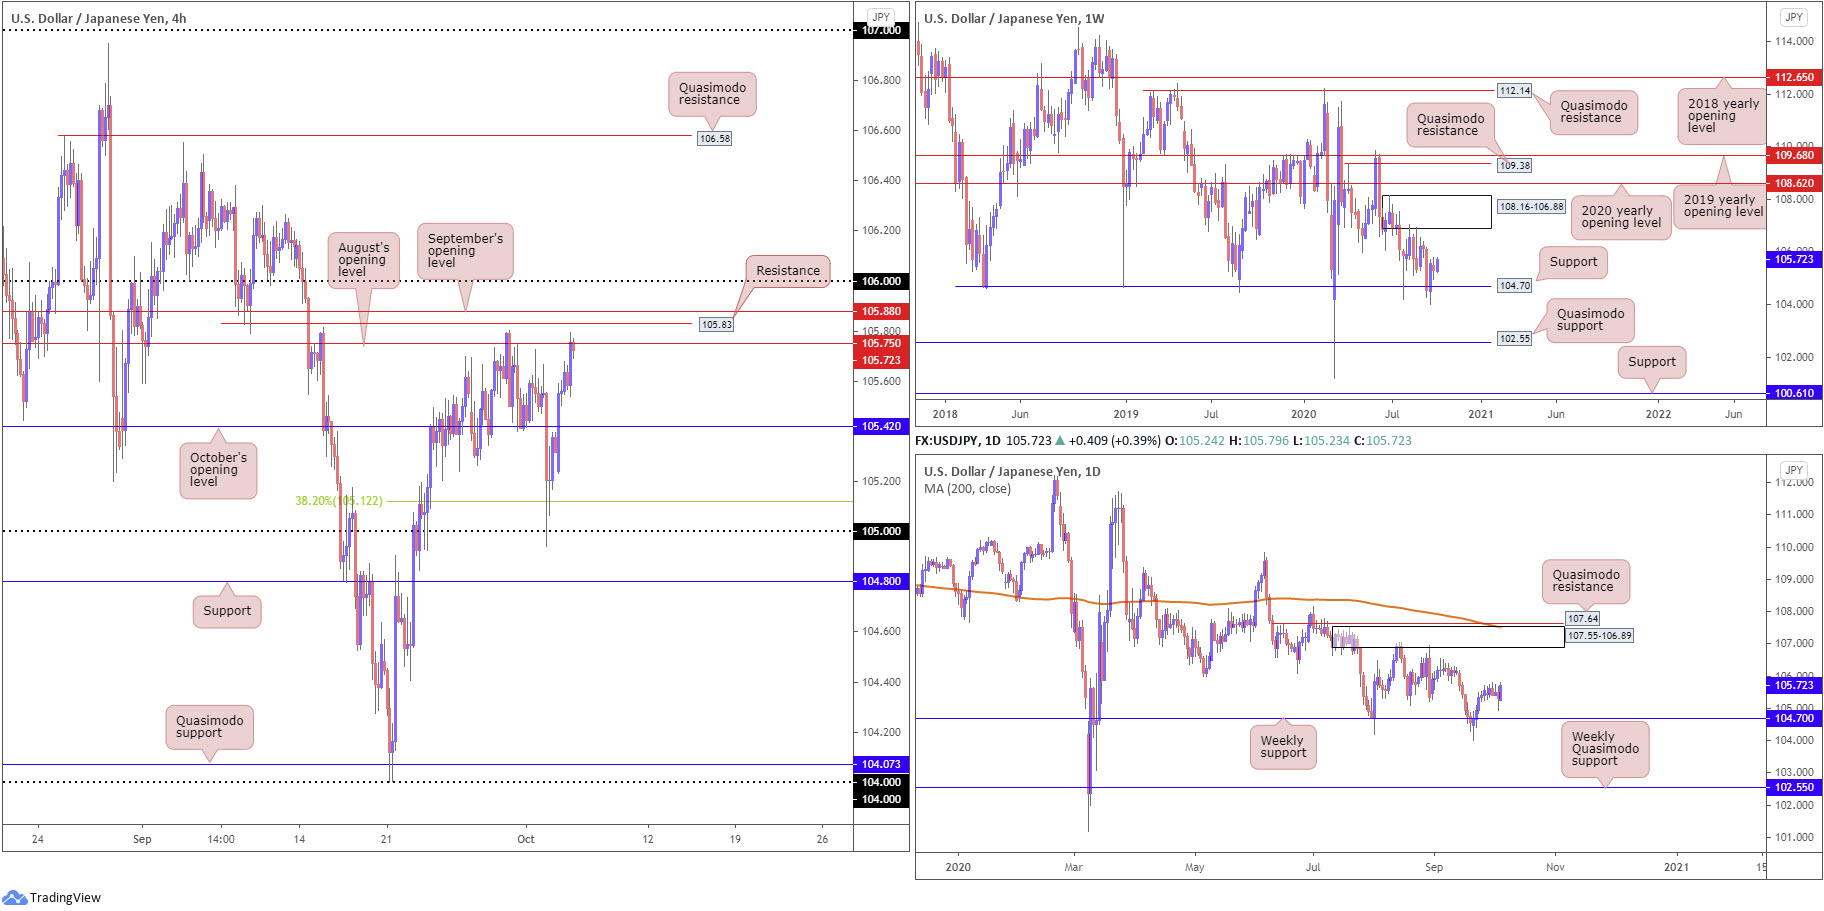
Upbeat risk sentiment dented demand for the safe-haven Japanese yen Monday, consequently lifting USD/JPY through October’s opening value at 105.42 to recently shake hands with August’s opening value at 105.75. Stationed just south of H4 resistance at 105.83, as well as September’s opening value ay 105.88 and the round number 106, 105.75 actually served sellers well heading into the closing stages of September.
From the weekly timeframe:
Supply at 108.16-106.88 remains prominent on the weekly timeframe, capping upside since price made its way off support at 104.70 at the end of July. The aforementioned support also recently made a second showing, with price rebounding nearly 1%. Both areas, therefore, remain firmly on the watchlist. Quasimodo support at 102.55 offers a feasible target beyond current support in the event we turn south, while removing supply draws the 2020 yearly opening value at 108.62 into the fight.
From the daily timeframe:
Supply at 107.55-106.89, an area housed within the lower boundary of weekly supply mentioned above at 108.16-106.88, remains on the radar. Upside momentum derived from weekly support at 104.70 highlights the possibility of readdressing the aforementioned supply. Of note, the daily area also benefits from nearby Quasimodo resistance at 107.64 and the 200-day SMA (orange – 107.50).
Areas of consideration:
Sellers are unlikely to muster enough strength off August’s opening value at 105.75, though a pop to resistance at 105.83 (a prior Quasimodo support level) and September’s opening value at 105.88 could draw in mild selling interest.
According to the higher timeframes, however, bulls may eventually take over this market until around the 106.88/89ish region (the lower edges of higher timeframe supply). Therefore, breakout moves above 106 are also likely watched going forward.
USD/CAD:
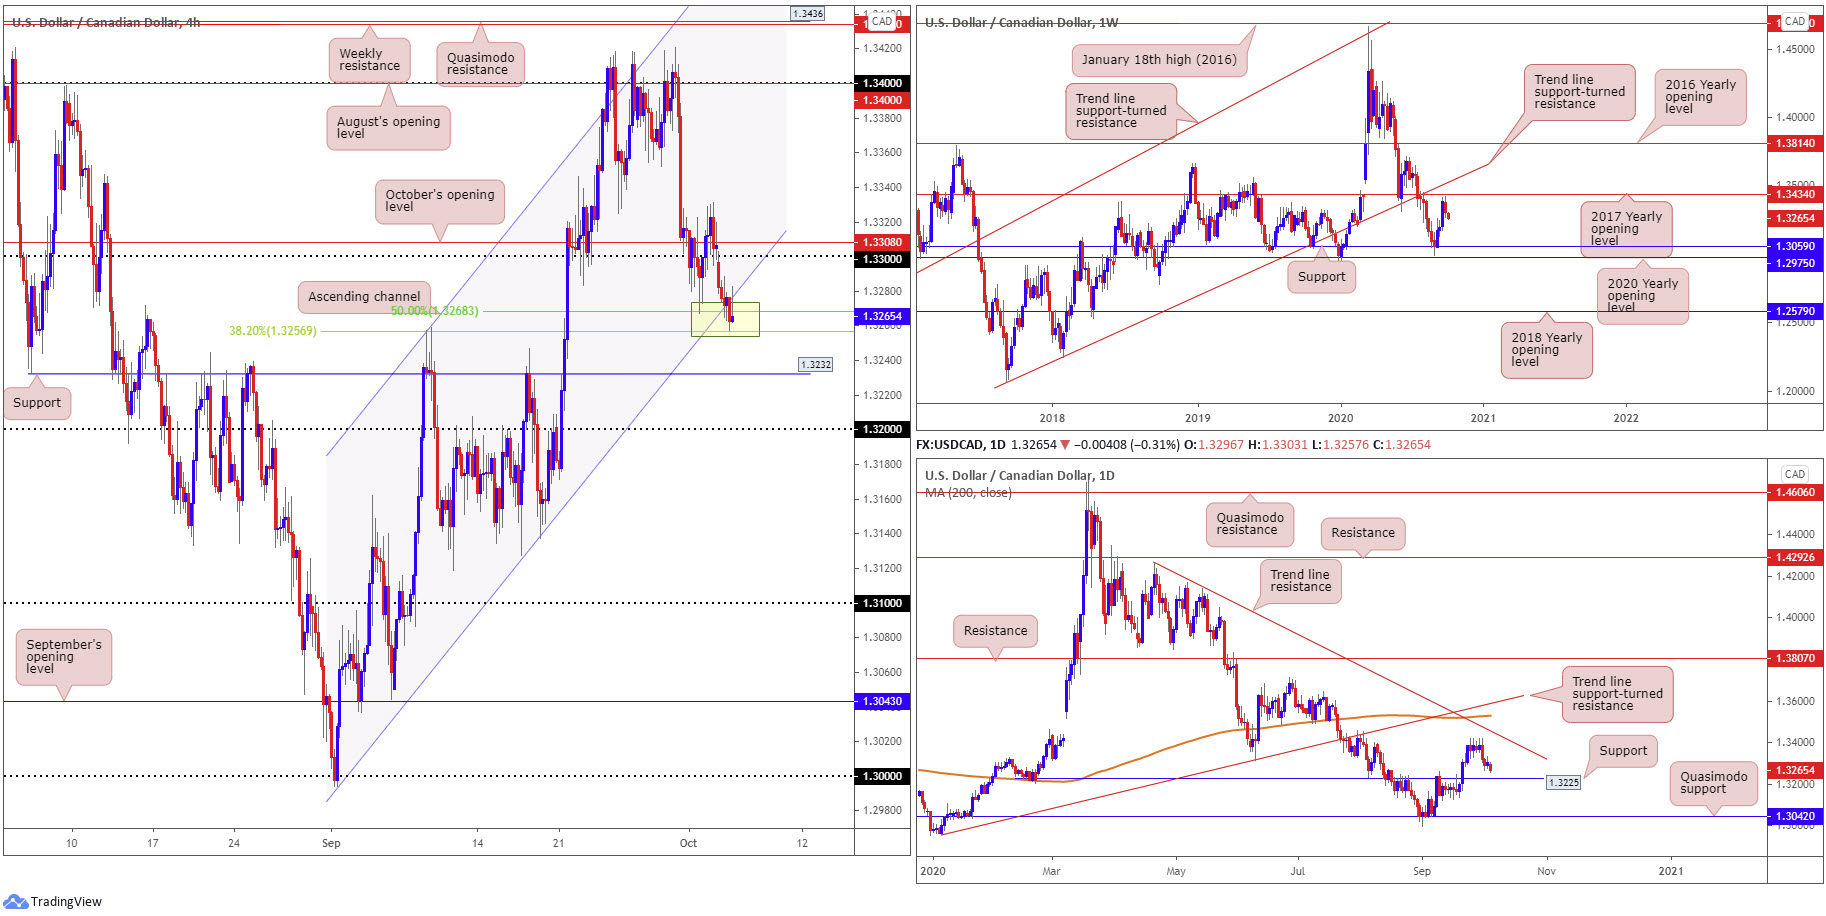
Robust oil prices (strengthening the Canadian dollar), together with upbeat risk sentiment denting USD demand, weighed on USD/CAD Monday.
H4 softened through the 1.33 handle and, in recent hours, crossed swords with channel support, extended from the low 1.2994, joined with a 38.2% Fibonacci retracement ratio at 1.3256 and a 50.0% retracement ratio at 1.3268 (yellow). As you can see, buyers have attempted to regain control of things, though has so far proved fruitless.
The above could be due to weekly price coming within touching distance of the 2017 yearly opening value at 1.3434 (sited just under trend line support-turned resistance, taken from the low 1.2061) last week. Follow-through selling on the weekly timeframe could eventually tug the currency pair back to support at 1.3059, pinned just north of the 2020 yearly opening value at 1.2975. In addition to this, daily price demonstrates room for sellers to push for support coming in at 1.3225. Resistance on the daily timeframe is not expected to make an appearance until trend line resistance, etched from the high 1.4265. Directly above here also rests the 200-day SMA (orange – 1.3529) and a trend line support-turned resistance, taken from the low 1.2957.
Areas of consideration:
- The area shaded in yellow on the H4 (channel support and Fibonacci convergence) appears to be hanging on by a thread. However, until the Fibonacci levels give out, buyers could still make a show.
- Another H4 level worth taking into account is support priced in at 1.3232, owing to the base fusing with daily support at 1.3225.
USD/CHF:
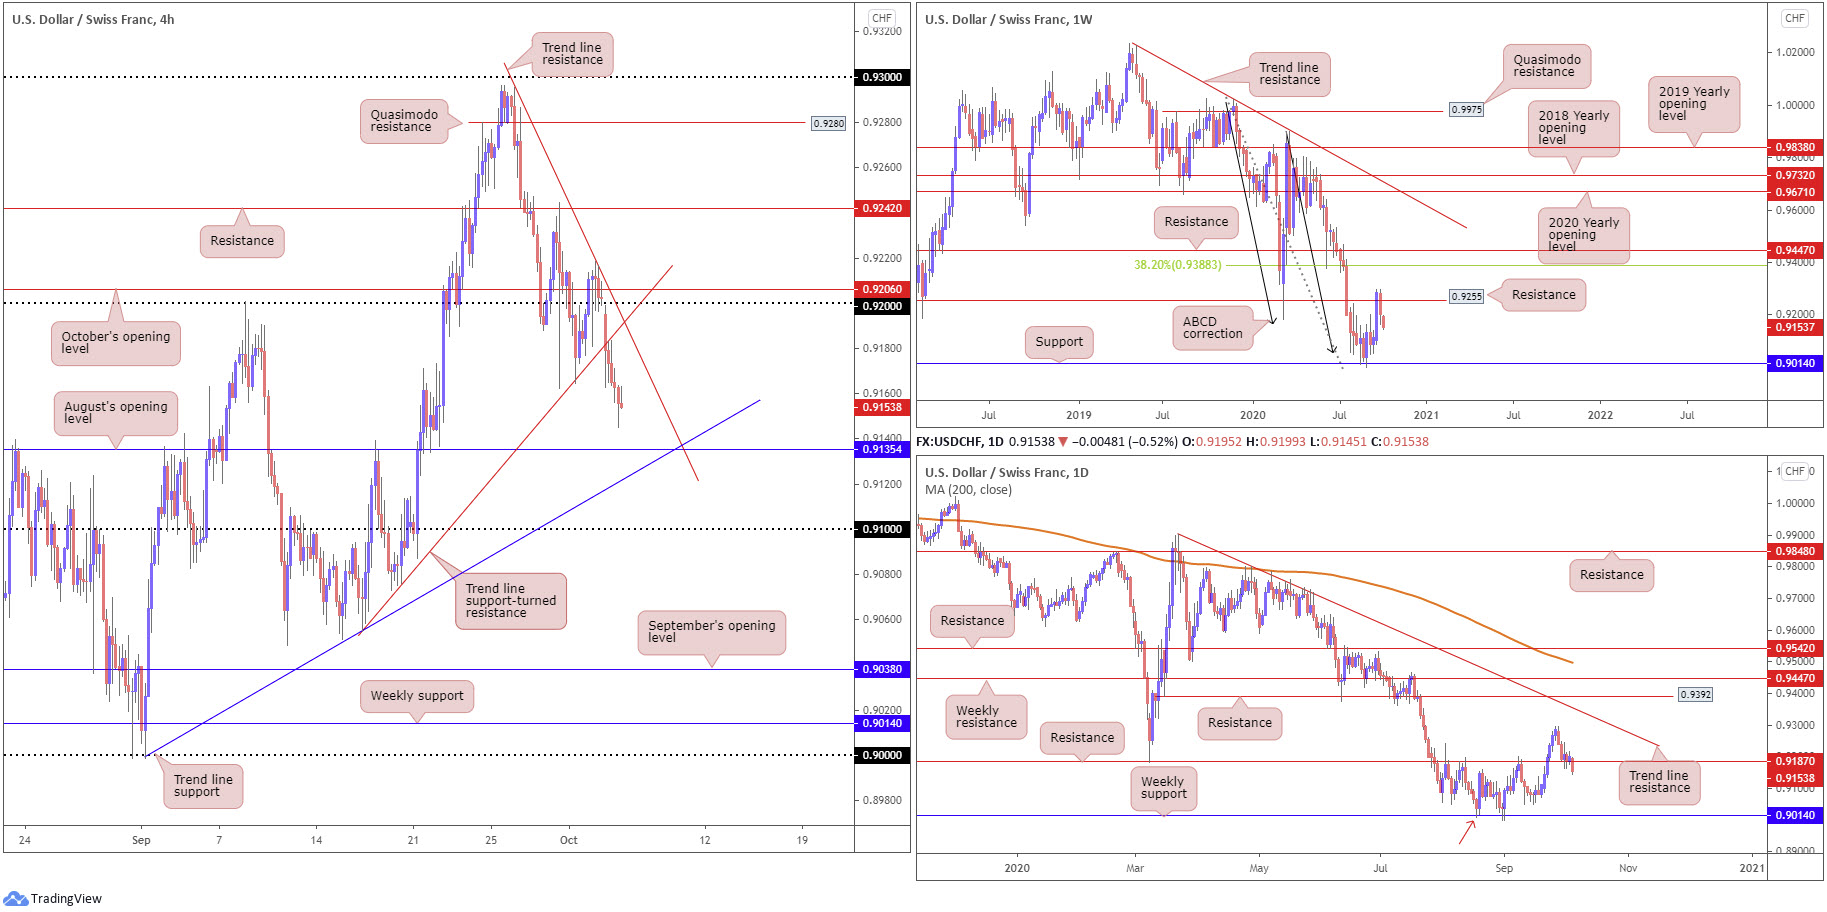
Led by broad USD weakness and a flight to perceived safe-haven assets Monday, USD/CHF lost grip of the 0.92 handle on the H4 and voyaged through trend line support, extended from the low 0.9055. This also shined the spotlight on August’s opening value at 0.9135 (and trend line support [0.8998]), with a break perhaps propelling things towards the 0.91 barrier.
Further afield, resistance at 0.9255 (a previous Quasimodo support level) recently put in an appearance on the weekly timeframe. This follows a recent rebound from support at 0.9014, potentially gleaning additional impetus from ABCD support at 0.9051 (black arrows). Should buyers regain consciousness, the focus above current resistance falls in at a 38.2% Fibonacci retracement ratio at 0.9388, a common take-profit target out of ABCD patterns (derived from legs A-D).
What’s interesting from the daily timeframe is price tunnelled through support at 0.9187 yesterday, a critical level during August and September. Dropping through this support potentially offers an early cue to further weakness on the weekly timeframe, targeting the aforementioned weekly support (also stands as a Quasimodo support on the daily chart – red arrow).
Areas of consideration:
August’s opening value at 0.9135 on the H4 and trend line support (0.8998) are likely to be monitored levels today, as is H4 trend line resistance from the high 0.9295.
According to the higher timeframes, H4 is headed south of 0.9135. A test of H4 trend line resistance, therefore, might interest intraday sellers today. Alternatively, failure to test the aforementioned trend line resistance, a break beyond trend line support (0.8998) may catch the attention of intraday breakout sellers, targeting 0.91 as an initial take-profit target.
Dow Jones Industrial Average:
Reports of US President Donald Trump’s improving health condition echoed an optimistic tone Monday, lifting major US equity benchmarks. The Dow Jones Industrial Average advanced 465.83 points, or 1.68%; the S&P 500 rallied 60.18 points, or 1.80% and the Nasdaq traded higher by 257.47 points, or 2.32%.
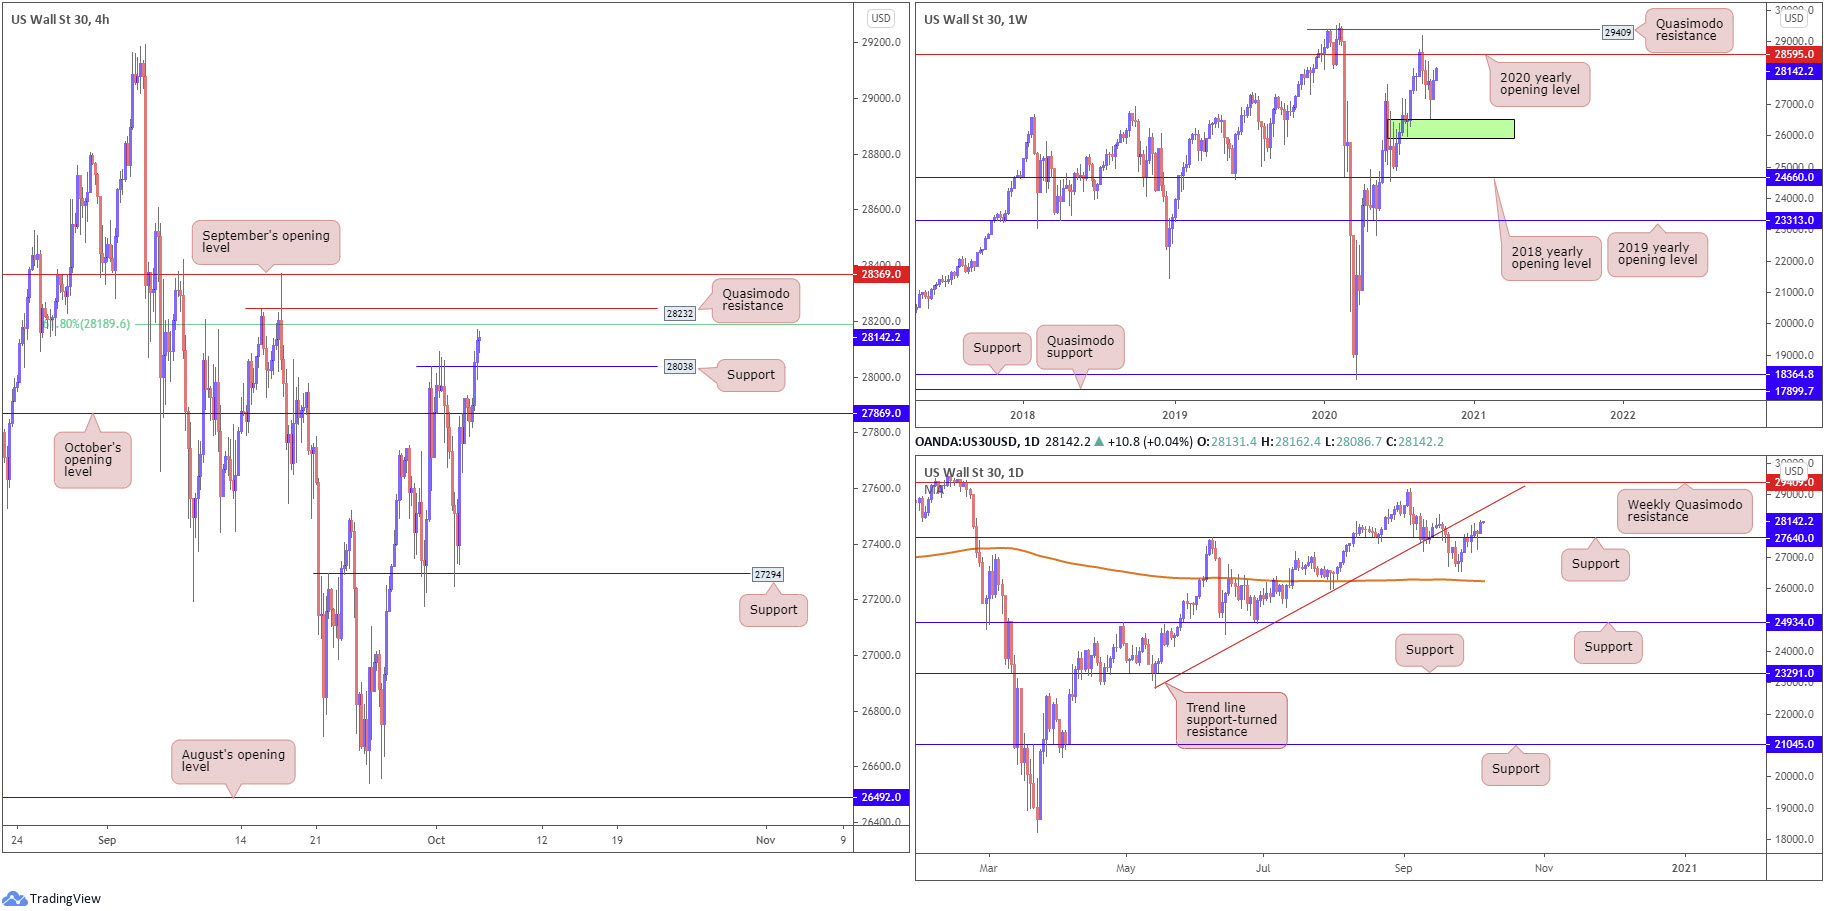
On the technical front, price action on the weekly timeframe is seen charging towards the 2020 yearly opening value at 28595, placed ahead of Quasimodo resistance at 29409. This follows a recent spike to lows at 26541, missing demand (green) at 25916-26523 by a hair.
Technical action on the daily timeframe printed a hammer candlestick formation off support at 27640 on Friday, with Monday following through to the upside. Sustained buying may find the unit engages with a trend line support-turned resistance, extended from the low 22803, which happens to intersect with the 2020 yearly opening value at 28595 highlighted above on the weekly timeframe.
Recent buying elevated the H4 candles above October’s opening value at 27869 and also Quasimodo resistance at 28038, both of which now represent possible support levels. A 61.8% Fibonacci retracement ratio at 28189 is seen as the next upside target, closely shadowed by Quasimodo resistance plotted at 28232 and then September’s opening value at 28369.
Areas of consideration:
For those who read Monday’s technical briefing you may recall the following (italics):
Sellers may not have the firepower to extend price south of October’s opening value on the H4 at 27869 this week, knowing we have room to push higher on the weekly timeframe and daily price recently concluded off support by way of a hammer candle pattern.
As a result, bullish themes could be found above 27869, targeting H4 Quasimodo resistance at 28038, followed by a 61.8% Fibonacci retracement ratio at 28189. However, the 2020 yearly opening value at 28595 on the weekly timeframe, along with daily trend line resistance, is likely marked as an ultimate upside target this week.
According to the higher timeframes, further buying is in the offing. H4 support at 28038 (and also October’s opening value at 27869), therefore could be retested today and provide a stage for possible bullish scenarios.
XAU/USD (GOLD):
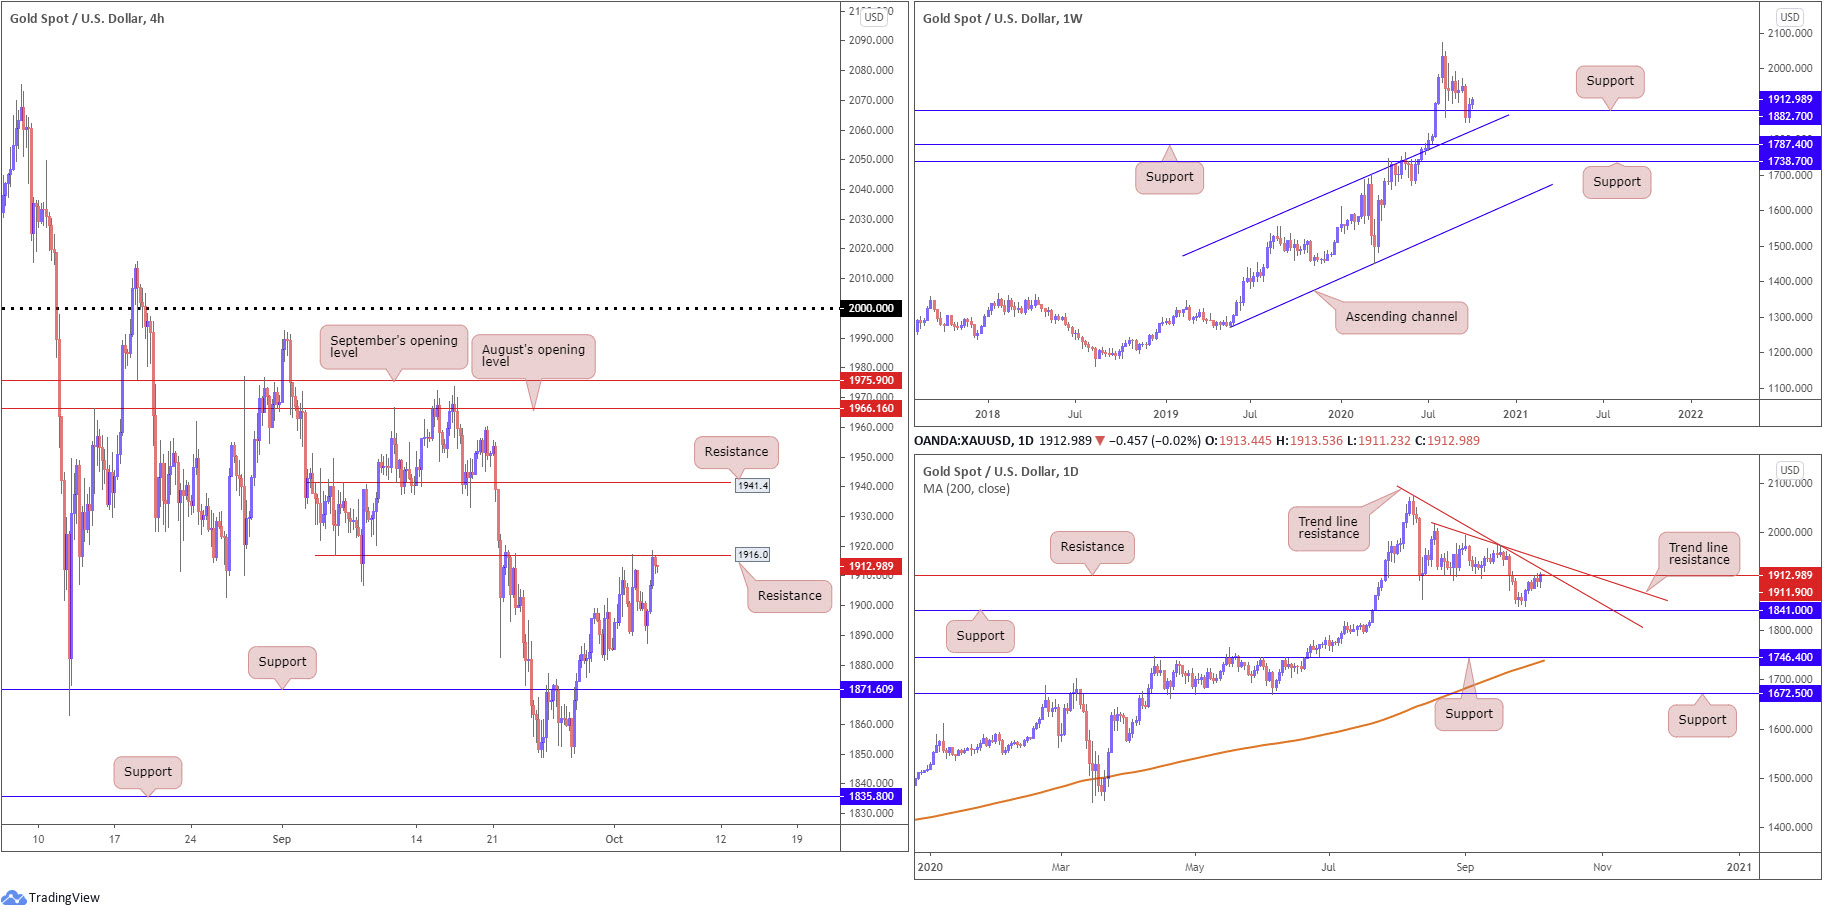
With the US dollar index exploring lower levels, bullion rallied on Monday, adding 0.7%.
As aired in Monday’s technical briefing, the research team pointed out the yellow metal is seen attempting to regain some status above support at $1,882 on the weekly chart, despite leaving behind channel resistance-turned support, etched from the high $1,703. It was also put forward that should buyers maintain a dominant position north of $1,882 this week, are traders likely to seek all-time peaks at $2,075?
Things get complicated on the daily timeframe, however, as resistance at $1,911 recently made an appearance
This is a reasonably solid S/R level that’s sited just south of trend line resistance, taken from the high $2,075, as well as another trend line resistance, drawn from the high $2,015. To the downside, nonetheless, the yellow metal could stretch as far south as support at $1,841, fixed just beneath the $1,848 September 28 low.
Monday’s rally, as you can see, took price back to H4 resistance at $1,916. It seems buyers are just too strong around $1,890 right now, hindering attempts to reach for support at $1,871. A close above $1,916 may call for H4 resistance at $1,941, in line with weekly price holding above support at $1,882.
Areas of consideration:
There is clear conflict in this market right now.
On the one side, weekly buyers are trying to buy into the current uptrend (decisively higher since 2016) off support at $1,882. The flip side, nevertheless, shows daily resistance in play at $1,911, as well as H4 resistance at $1,916.
While bearish scenarios may form off the H4/daily resistance combination, buyers, technically speaking, likely hold the stronger hand here (higher timeframes usually take precedence over lower timeframes). Bullish signals, therefore, may be found should H4 close above its resistance level at $1,916.
The accuracy, completeness and timeliness of the information contained on this site cannot be guaranteed. IC Markets does not warranty, guarantee or make any representations, or assume any liability regarding financial results based on the use of the information in the site.
News, views, opinions, recommendations and other information obtained from sources outside of www.icmarkets.com.au, used in this site are believed to be reliable, but we cannot guarantee their accuracy or completeness. All such information is subject to change at any time without notice. IC Markets assumes no responsibility for the content of any linked site.
The fact that such links may exist does not indicate approval or endorsement of any material contained on any linked site. IC Markets is not liable for any harm caused by the transmission, through accessing the services or information on this site, of a computer virus, or other computer code or programming device that might be used to access, delete, damage, disable, disrupt or otherwise impede in any manner, the operation of the site or of any user’s software, hardware, data or property.


