Key risk events today:
RBA Cash Rate and Rate Statement; German Constitutional Court Ruling; UK Final Services PMI; Canada Trade Balance; US ISM Non-Manufacturing PMI; New Zealand Employment Change q/q and Unemployment Rate.
(Previous analysis as well as outside sources – italics).
EUR/USD:
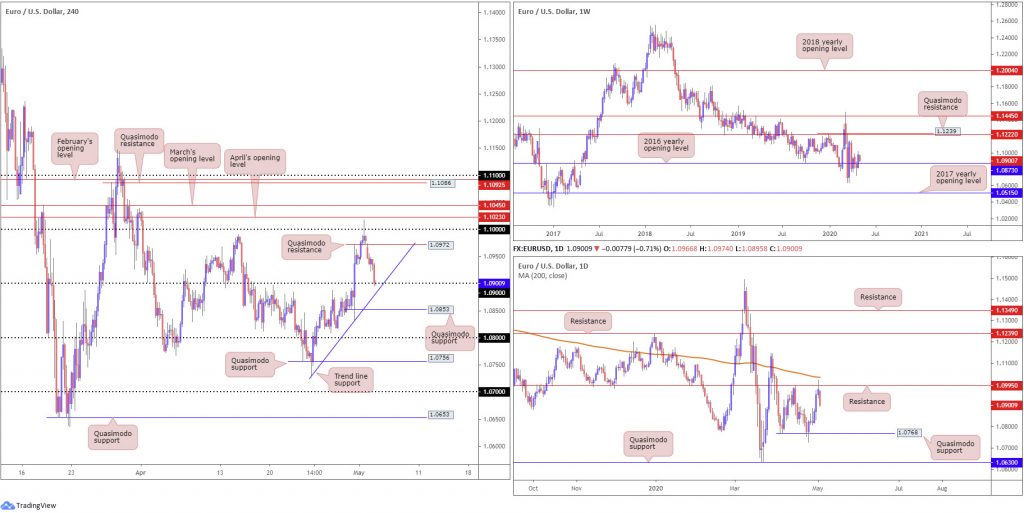
EUR/USD exhibited a clear defensive play Monday as the US dollar index, or DXY, recovered in dominant fashion, reclaiming the 99.00 handle.
At the tail end of Friday’s session, H4 action on EUR/USD rushed buy stops above the key figure 1.10, though topped at 1.1019 before turning lower and settling at 1.0978. This – coupled with price action on the daily timeframe shaking hands with resistance at 1.0995 – was evidently enough to entice sellers towards 1.09 on the H4 timeframe yesterday.
Beneath 1.09, breakout sellers will likely have eyeballs on Quasimodo support at 1.0853 as an initial target, though weekly support, in the form of the 2016 yearly opening level, at 1.0873, could also hamper downside.
Areas of consideration:
South of 1.09 and nearby H4 trend line support (extended from the low 1.0727) likely contains a number of sell-stops. Given weekly support is positioned close by at 1.0873, we could witness a run of stops through 1.09 into weekly support. A bounce from this higher-timeframe level, one that observes a H4 close form back above 1.09, will likely be viewed as a strong buy signal, targeting H4 Quasimodo resistance at 1.0972, and quite possibly 1.10.
GBP/USD:
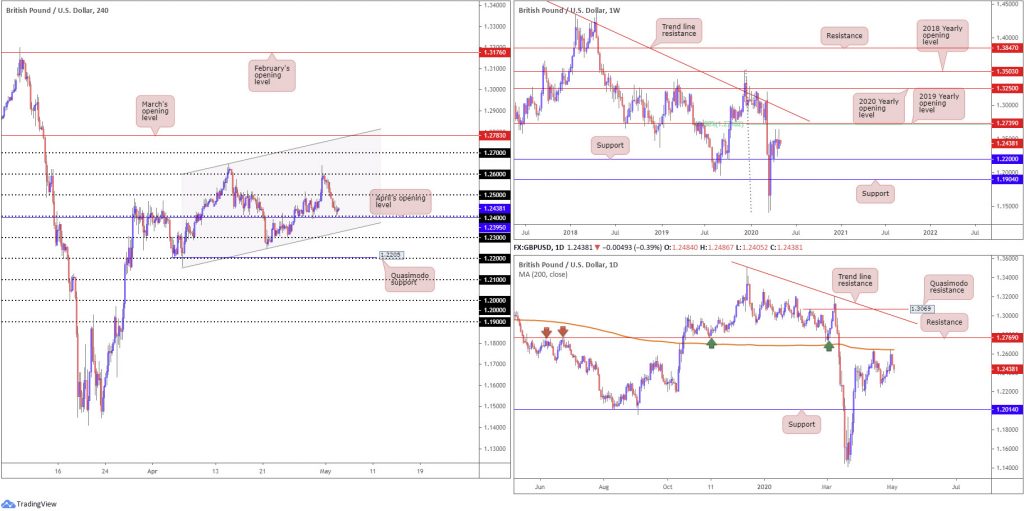
Sterling maintained a defensive stance against the buck Monday, extending Friday’s 100-pip decline off 1.26. As can be seen on the H4 chart this morning, the candles put in a bottom ahead of 1.24 and April’s opening level at 1.2395. Sub 1.24 we can see channel support, extended from the low 1.2163, with a break highlighting 1.23 as potential support.
From the weekly timeframe, support at 1.2200 remains a pivotal base, holding price action higher since the beginning of April. Scope to explore higher ground is also visible until reaching the 2019 yearly opening level at 1.2739, which aligns closely with a 61.8% Fibonacci retracement ratio at 1.2718. A break of the aforementioned levels reveals a long-standing trend line resistance, taken from the high 1.5930. In addition to the above, we can also see the pair pulling back from historic lows at 1.1409, therefore sellers could eventually make a run for fresh lows. Note the primary trend remains facing south in this market.
The 200-day SMA (orange – 1.2644) remains a dominant fixture on the daily timeframe, providing resistance on two occasions in April. Friday, as evident from the chart, finished in the shape of a bearish inside day, snapping a two-day bullish phase and underlining the 1.2247 April 21 low as possible support. Directly north of the SMA value, traders may also want to acknowledge notable resistance coming in from 1.2769. Monday witnessed mild follow-through selling emerge, but not really anything to get excited about.
Areas of consideration:
There’s not much happening in this market, as far as technical positions go – technical confluence is limited.
1.24 on the H4 timeframe may generate buyer interest, knowing it merges closely with April’s opening level at 1.2395. A move beyond this number, however, is equally likely owing to both weekly and daily price showing room to explore lower levels. Breakout selling sub 1.24 is unfortunately tricky seeing as channel support lurks close by and could hinder downside.
AUD/USD:
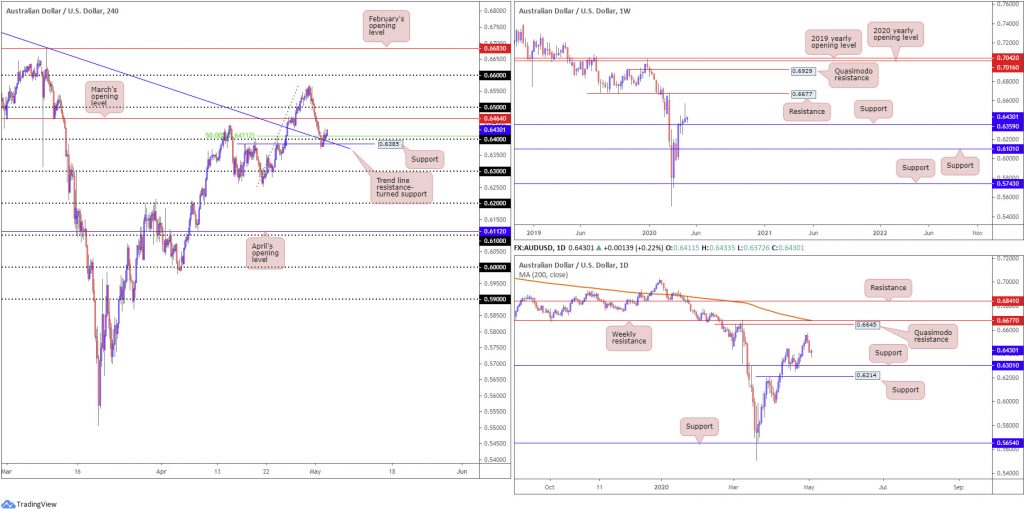
It was a reasonably subdued session Monday, ranging between 0.6433/0.6372. Interestingly, however, the H4 candles came into contact with the 0.64 handle, a noted support in Monday’s technical briefing. Although a key figure by and of itself, 0.64 also comes together with a notable trend line resistance-turned support, taken from the high 0.7031, a Quasimodo resistance-turned support at 0.6385 and a 50.0% retracement value at 0.6411. Sub 0.64, limited support exists until crossing swords with the 0.63 handle, which also represents daily support mentioned above at 0.6301.
The story on the weekly timeframe has price circling above support at 0.6359, following last week’s shooting star candlestick configuration. Although the candlestick signal is a mark of seller intent, price is likely to find difficulty attracting sellers this week due to noted support. With that being the case, pencilling in resistance at 0.6677 may be an idea in the event we pop higher.
From the daily timeframe, support at 0.6301 may eventually come under fire, with support at 0.6214 also perhaps entering the mix. With respect to resistance, a Quasimodo formation at 0.6645 is in sight, parked just ahead of the weekly resistance level mentioned above at 0.6677 and the 200-day SMA (orange – 0.6680).
Areas of consideration:
With 0.64 holding firm, buyers from this region will have March’s opening level at 0.6464 in sight (an ideal location to consider reducing risk to breakeven), with follow-through moves potentially reaching out to 0.65.
USD/JPY:
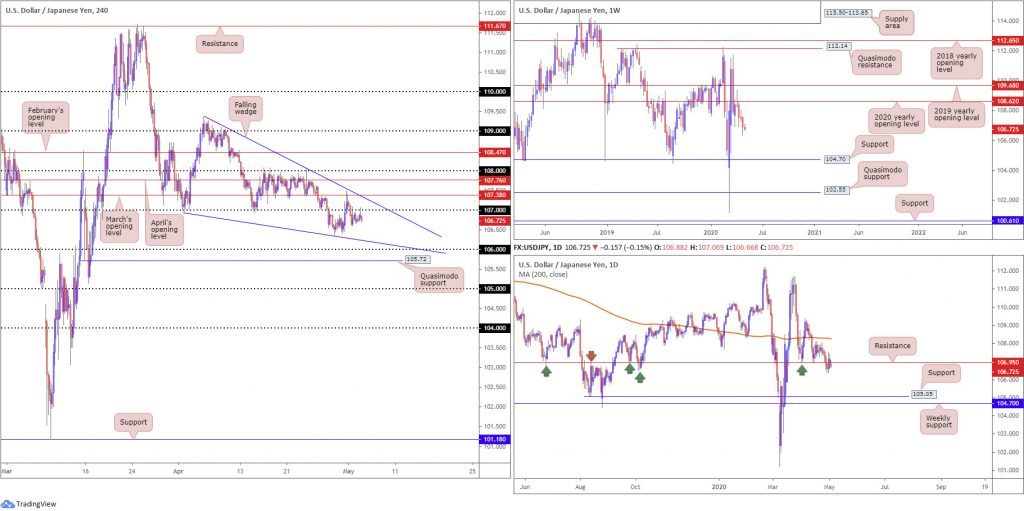
USD/JPY exhibited a gentle start to the week, circling around the underside of the 107 handle on the H4 timeframe. In view of Monday’s lacklustre performance, much of the following piece will echo thoughts put forward in Monday’s technical briefing.
The weekly timeframe continues to emphasise a bearish tone south of the 2020 yearly opening level at 108.62. Last week, as you can see, extended losses to lows of 106.35, with support not expected to emerge until reaching 104.70.
Resistance at 106.95 maintains a presence on the daily timeframe.106.95 boasts notable history (arrows), therefore moves south of the base could see an approach form to support at 105.05. Additional resistance is not seen on this timeframe until reaching the 200-day SMA (orange – 108.26).
In addition to H4 action testing 107 as resistance, pattern-based traders will also recognise a falling wedge forming between 109.38/106.92. The 106 handle is also a worthwhile level to have on the watchlist this week, closely shadowed by Quasimodo support priced in at 105.72.
Areas of consideration:
While price could potentially continue compressing within the H4 falling wedge pattern, a fakeout through orders at 106 to Quasimodo support at 105.72 is a scenario worth underlining. A whipsaw through 106 followed up with a H4 close north of the round number could signal buyers want to take things higher. However, this would entail going up against daily sellers from resistance at 106.95 and weekly directional flow.
In terms of resistance on the H4 scale, keep eyes on the 107 handle and March’s opening level at 107.38. Daily resistance at 106.95, as you’re probably aware, reinforces 107.
USD/CAD:
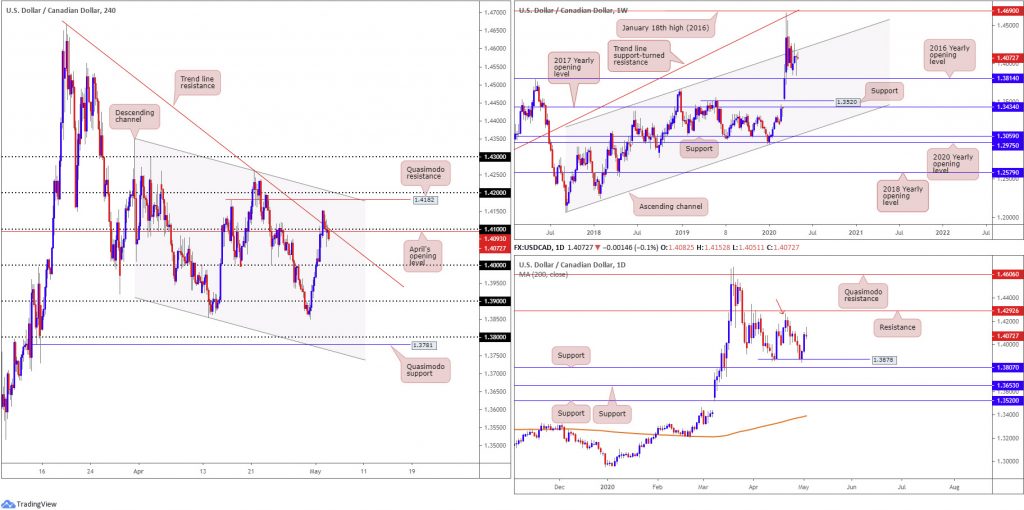
USD/CAD failed to build on earlier gains Monday, a move that whipsawed through buy-stop liquidity above 1.41, H4 trend line resistance, taken from the high 1.4667, and April’s opening level at 1.4093. The session ended in mildly negative territory, treading water sub 1.41, with traders’ crosshairs likely fixed on the key figure 1.40. In the event buyers regain consciousness, additional resistance resides at 1.4182, a Quasimodo formation, followed by channel resistance, extended from the high 1.4349, and the round number 1.42.
Further out on the weekly timeframe, price action is meandering beneath a long-term channel resistance, etched from the high 1.3661. To the downside, the 2016 yearly opening level at 1.3814 denotes support on this scale.
Thanks to an end-of-week advance in the form of a near-full-bodied bullish candle, a daily double-bottom support may form at 1.3878. However, traditional interpretation would have the peak at 1.4265 engulfed (red arrow) before confirming the formation as a buy signal. This would also entail overturning resistance at 1.4292. Space below 1.3878 offers little room for manoeuvre with support positioned at 1.3807. Monday, as you can see, finished by way of a shooting star candlestick configuration, emphasising a bearish tone.
Areas of consideration:
The move north of H4 trend line resistance and round number 1.41 likely tripped a huge amount of buy stops. This, along with H4 price reclaiming 1.41 to the downside, could lead to further selling materialising to 1.40 today However, conservative traders may seek a retest at 1.41 as resistance before committing.
Should we rotate higher today, on the other hand, H4 Quasimodo resistance at 1.4182, channel resistance, extended from the high 1.4349, and the round number 1.42 could be a resistance area worthy of attention. Not only does it come with H4 confluence, the noted weekly channel resistance intersects with the H4 levels.
USD/CHF:
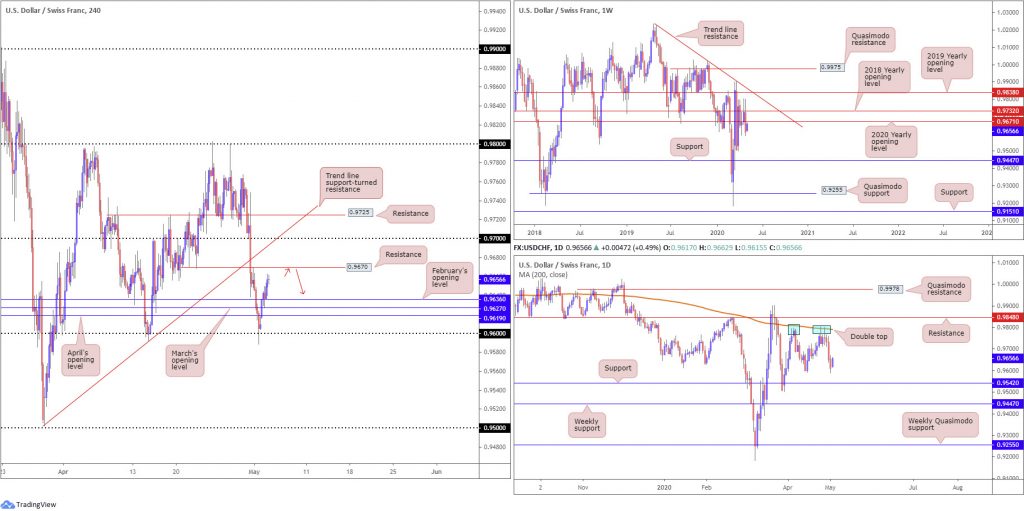
In lockstep with the US dollar index, USD/CHF gained nearly 50 pips Monday, or 0.50%, consequently building on Friday’s modest reaction off 0.96 and overthrowing 0.9619/0.9636, a zone made up of April, March and February’s opening levels. Technically speaking on the H4 timeframe, this has placed the unit ahead of resistance at 0.9670, with a breach underlining a possible approach to 0.97, closely merging with a trend line support-turned resistance, drawn from the low 0.9502.
Traders will also likely note the 2020 yearly opening level on the weekly timeframe at 0.9671. This could potentially offer resistance in this market.
The daily timeframe shows price action snapped a four-day bearish phase yesterday, though structure remains pretty much unchanged.
Monday’s technical briefing had the following to say (italics):
Price action on the daily timeframe shows the 200-day SMA (orange – 0.9790) remained steadfast resistance, withstanding two upside attempts in recent trading. Aside from the 0.9592 April 15 low, we have support priced in at 0.9542, situated ahead of weekly support at 0.9447. Pattern traders may also recognise the potential double-top formation around 0.9800 (blue). However, traditional interpretation would have the trough at 0.9592 engulfed before confirming the formation as a sell signal. This would also entail engaging with support mentioned above at 0.9542.
Areas of consideration:
With price action nearing weekly resistance, shaped in the form of the 2020 yearly opening level at 0.9671, attempting to buy at current price could end sour.
H4 resistance at 0.9670, a prior Quasimodo support level, is therefore likely of interest today for shorting opportunities, knowing it merges with weekly resistance. Owing to the possibility of a whipsaw through 0.9670, conservative traders may opt to wait and see if H4 price forms a candlestick signal before pulling the trigger. Downside targets from 0.9670 has 0.9619/0.9636 in view.
Dow Jones Industrial Average:
Major US benchmarks wrapped up Monday modestly higher amid rising oil prices and gains in technology and Internet companies. The Dow Jones Industrial Average added 26.07 points, or 0.11%; the S&P 500 gained 12.03 points, or 0.42%, and the tech-heavy Nasdaq 100 concluded higher by 115.93 points, or 1.33%.
For those who read recent analysis may recognise the following points (italics):
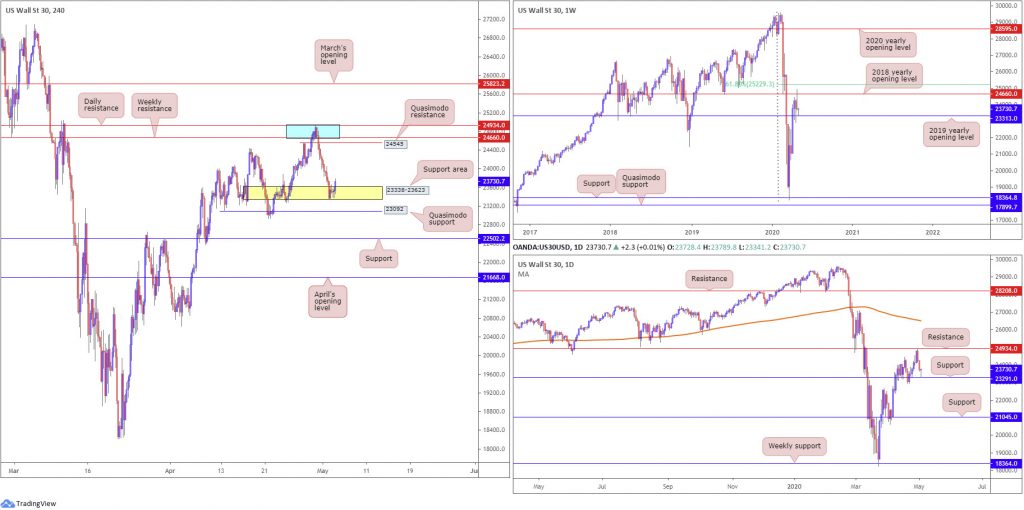
As can be seen from the H4 timeframe this morning, in the shape of a bearish inside candlestick pattern, 24934/24660 contained upside on Thursday, sliding to lows of 23994.
Those short this market will have likely reduced risk to breakeven at this point, with eyes perhaps on the H4 support area at 23338-23623 as an initial take-profit target.
As evident from the H4 chart, price action crossed swords with 23338-23623 on Monday and has modestly reacted.
Technical action on the weekly timeframe bottomed just ahead of the 2019 yearly opening level at 23313 in recent trading, following last week’s rejection off the 2018 yearly opening level at 24660.
From the daily timeframe, we can see price came within touching distance of support at 23291, forming a clear-cut hammer candlestick pattern (bullish signal).
Areas of consideration:
Traders short 24934/24660 have likely liquidated their position out of the H4 support zone at 23338-23623. The chances of a recovery from here is reasonably high, owing to how close we came to higher-timeframe supports. As such, a H4 bullish candlestick signal printed from 23338-23623 would likely excite traders, targeting H4 Quasimodo resistance at 24545.
XAU/USD (GOLD):
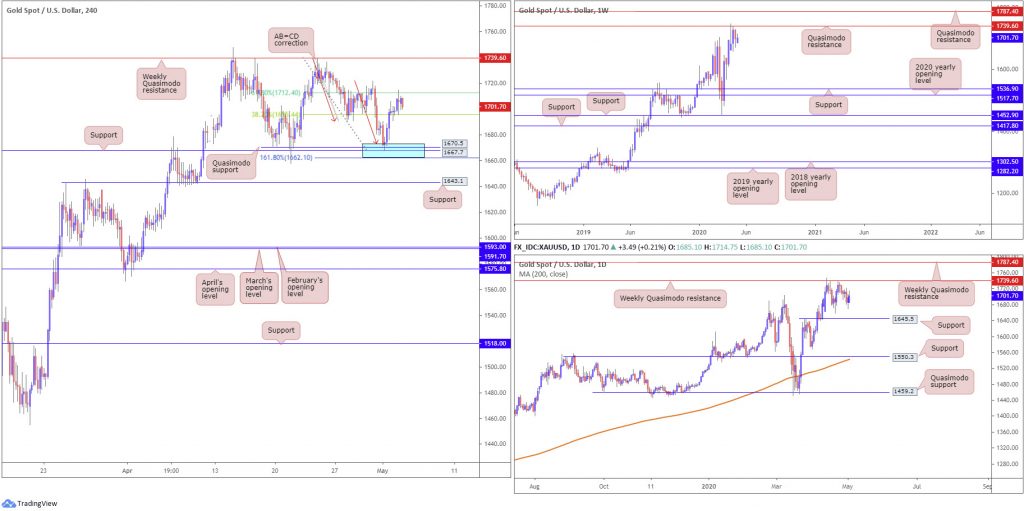
Recent analysis shined the spotlight on a particularly interesting base of H4 support between 1662.1/1673.1 (comprised of a 161.8% Fibonacci extension point at 1662.1, support at 1667.7, Quasimodo support at 1670.5 and an AB=CD correction at 1673.1 [red arrows]).
As evident from the chart, 1662.1/1673.1 (blue) rebounded price action strongly on Friday and continued to explore higher ground Monday. Traders likely reduced risk to breakeven at the 38.2% Fibonacci retracement ratio at 1695.4, with most taking profit at the 61.8% Fibonacci retracement ratio at 1712.4 (common take-profit targets out of AB=CD corrections).
Further afield on the higher timeframes, we can see buyers and sellers squaring off around the underside of a weekly Quasimodo resistance at 1739.6. Downside from this region echoes the possibility of reaching support at 1536.9, while a breach of 1739.6 shifts focus towards another layer of Quasimodo resistance at 1787.4. It may also interest some traders to note the primary trend on gold has faced a northerly trajectory since 2016.
In similar fashion to the weekly timeframe, the weekly Quasimodo formation at 1739.6 is also posted as prominent resistance on the daily chart. The difference can be seen by way of supports: the next support target on the daily timeframe falls in at 1645.5.
Areas of consideration:
Further buying out of 1662.1/1673.1, despite reaching 1712.4 on the H4 timeframe, towards the weekly Quasimodo resistance at 1739.6 is certainly a possibility. Therefore, some traders may leave a portion of their long position open in case of further upside.
In the event we print a H4 close above 1739.6, we’ll likely see breakout buyers make a show, targeting weekly Quasimodo resistance at 1787.4.
The accuracy, completeness and timeliness of the information contained on this site cannot be guaranteed. IC Markets does not warranty, guarantee or make any representations, or assume any liability regarding financial results based on the use of the information in the site.
News, views, opinions, recommendations and other information obtained from sources outside of www.icmarkets.com.au, used in this site are believed to be reliable, but we cannot guarantee their accuracy or completeness. All such information is subject to change at any time without notice. IC Markets assumes no responsibility for the content of any linked site.
The fact that such links may exist does not indicate approval or endorsement of any material contained on any linked site. IC Markets is not liable for any harm caused by the transmission, through accessing the services or information on this site, of a computer virus, or other computer code or programming device that might be used to access, delete, damage, disable, disrupt or otherwise impede in any manner, the operation of the site or of any user’s software, hardware, data or property.
