
DXY:
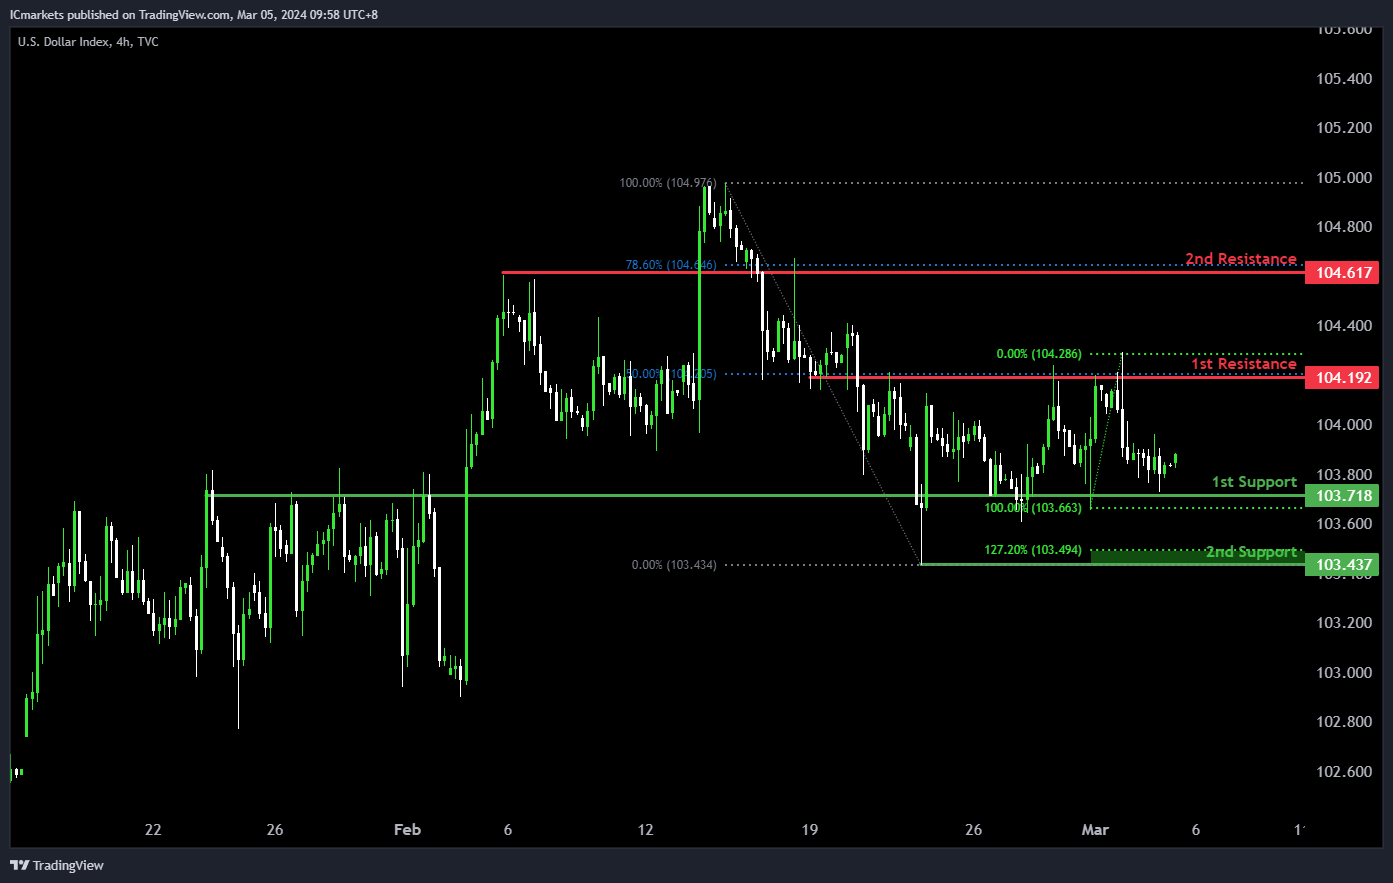
The DXY (US Dollar Index) chart currently indicates a neutral momentum, suggesting a potential scenario of fluctuation between the 1st resistance and 1st support levels.
The 1st support level at 103.71 is identified as an overlap support, coinciding with the 23.60% Fibonacci Retracement level. This level historically indicates a significant area where buying interest has emerged, potentially providing support for the price.
Furthermore, the 2nd support at 103.43 is characterized as a swing low support, coinciding with the 127.20% Fibonacci Extension level. This reinforces its significance as a level where buyers may step in to prevent further decline.
On the resistance side, the 1st resistance level at 104.19 is identified as an overlap resistance, coinciding with the 50% Fibonacci Retracement level. This level may act as a barrier where selling pressure may increase, potentially limiting upward movement in the short term.
Moreover, the 2nd resistance at 104.61 is noted for its presence at the 78.60% Fibonacci Retracement level. This further reinforces its importance as a level where selling pressure may intensify, potentially capping the upward movement of prices.
EUR/USD:
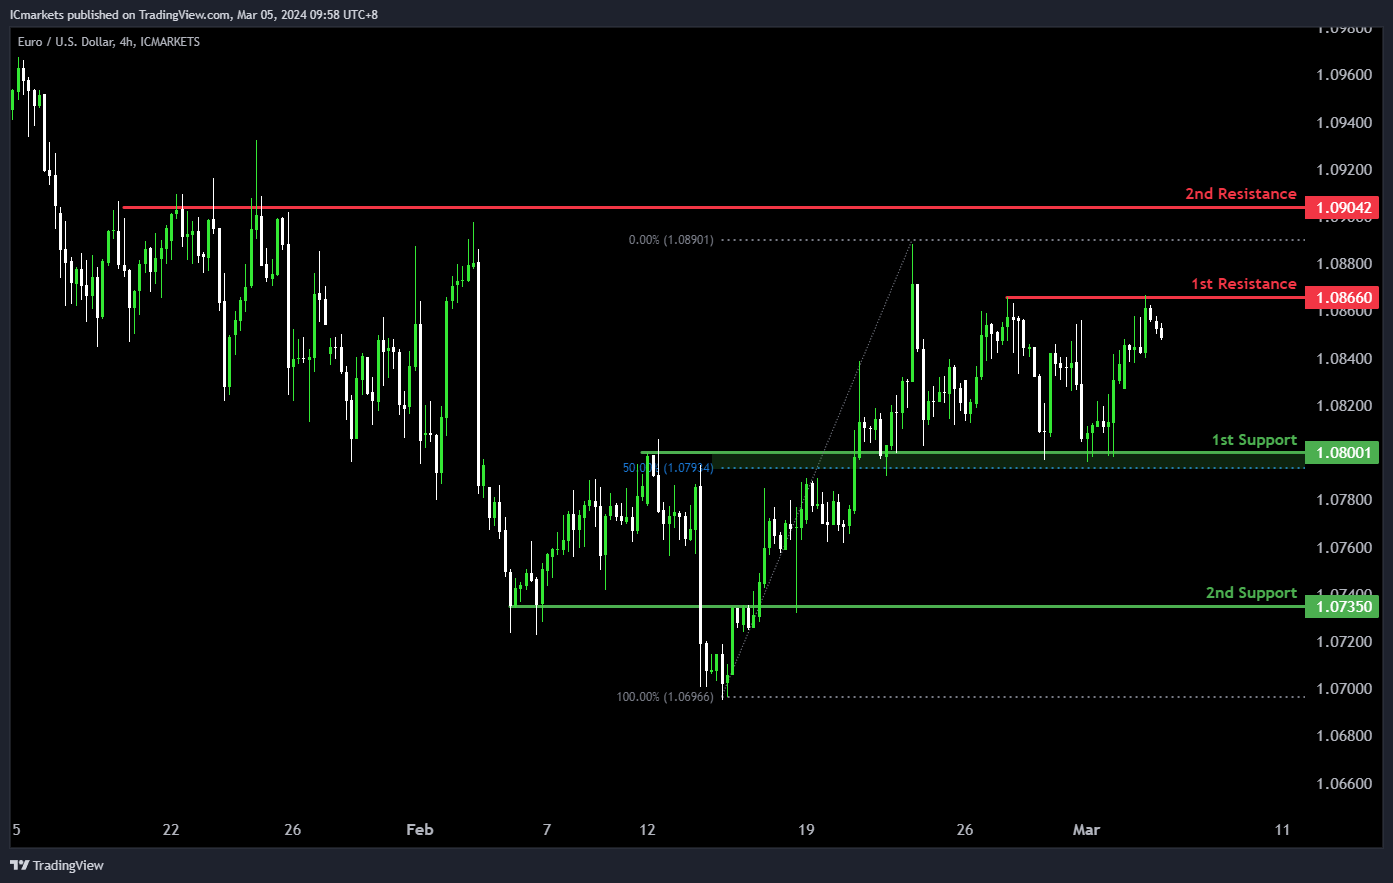
The EUR/USD chart currently reflects a bearish momentum, indicating a potential scenario of a bearish continuation towards the 1st support.
The 1st support level at 1.0800 is recognized as an overlap support, coinciding with the 50% Fibonacci Retracement level. Historically, this level has shown significant buying interest, potentially offering support for the price.
Additionally, the 2nd support at 1.0735 is identified as an overlap support. This further reinforces its significance as a level where buyers may intervene to prevent further decline.
On the resistance side, the 1st resistance level at 1.0866 is characterized as a swing high resistance. This level may act as a barrier where selling pressure could increase, potentially limiting upward movement in the short term.
Furthermore, the 2nd resistance at 1.0904 is noted for its presence as a multi-swing high resistance. This emphasizes its importance as a level where selling interest may intensify, potentially capping the upward movement of prices.
EUR/JPY:
The EUR/JPY chart currently demonstrates bullish momentum, suggesting a potential drop to the 1st support level in the short term before bouncing and rising towards the 1st resistance level.
The 1st support at 161.850 aligns with an overlap support and the 78.60% Fibonacci Projection, indicating a significant historical level where buying interest may emerge. Additionally, the 2nd support at 160.914 corresponds to another overlap support and the 50% Fibonacci Retracement, further reinforcing its potential as a support level.
On the resistance side, the 1st resistance level at 163.724 is identified as a multi-swing high resistance, suggesting a historical barrier to upward movement. Furthermore, the 2nd resistance level at 164.724 aligns with a swing high resistance and the 127.20% Fibonacci Extension, adding to its significance as a potential barrier to further bullish movement.
EUR/GBP:
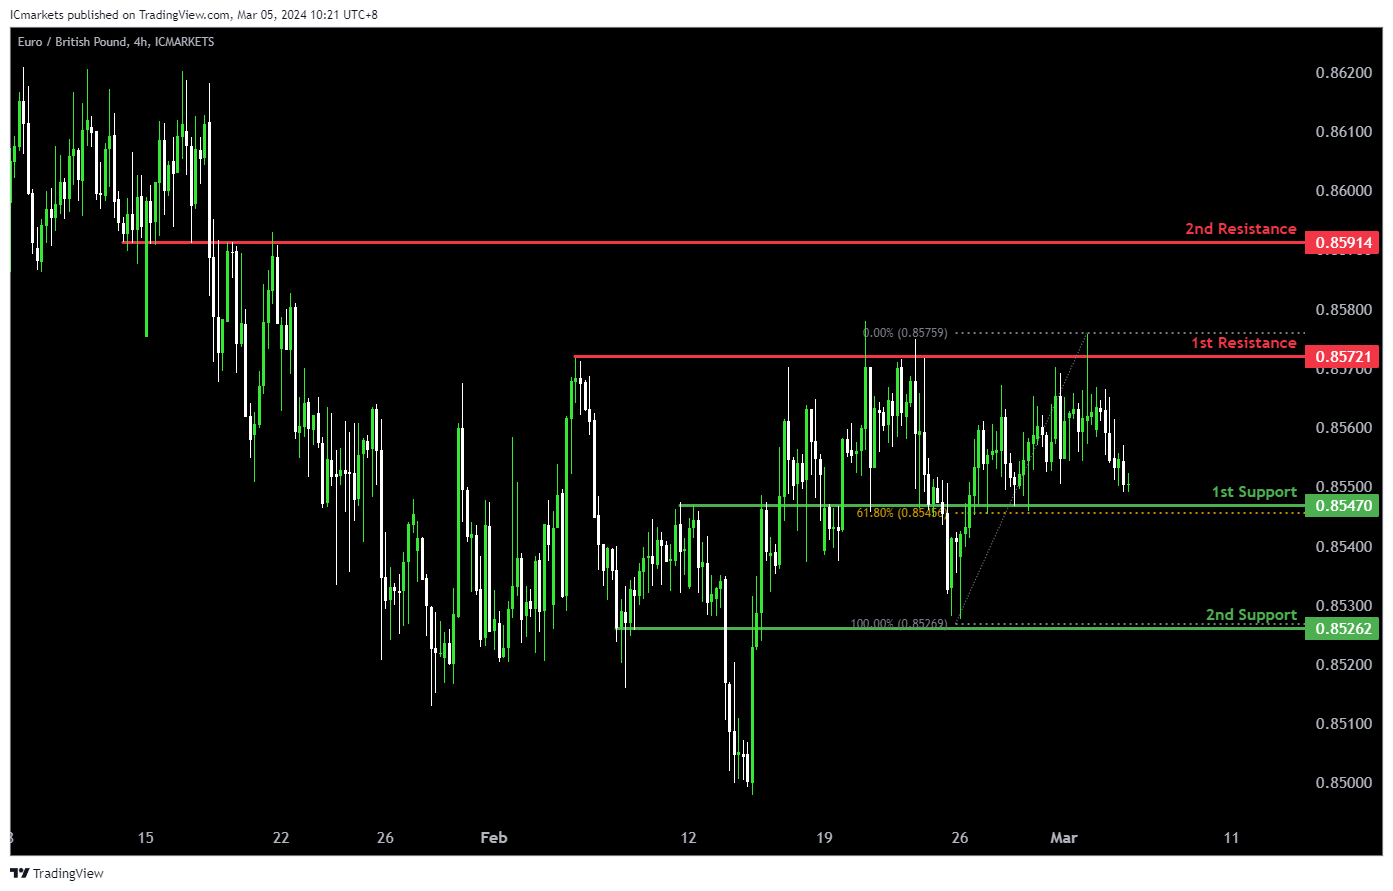
The EUR/GBP chart currently indicates a bearish momentum, suggesting a potential continuation of the downward trend towards the 1st support level.
The 1st support level at 0.8547 aligns with an overlap support and the 61.80% Fibonacci Retracement, indicating a significant historical level where buying interest could emerge. Additionally, the alternative 1st support at 0.8526 corresponds to a pullback support, further reinforcing its potential as a key support level.
On the resistance side, the 1st resistance level at 0.8572 is identified as a multi-swing high resistance, suggesting a historical barrier to upward movement. Moreover, the 2nd resistance level at 0.8591 aligns with an overlap resistance, adding to its significance as a potential barrier to further bullish movement.
GBP/USD:
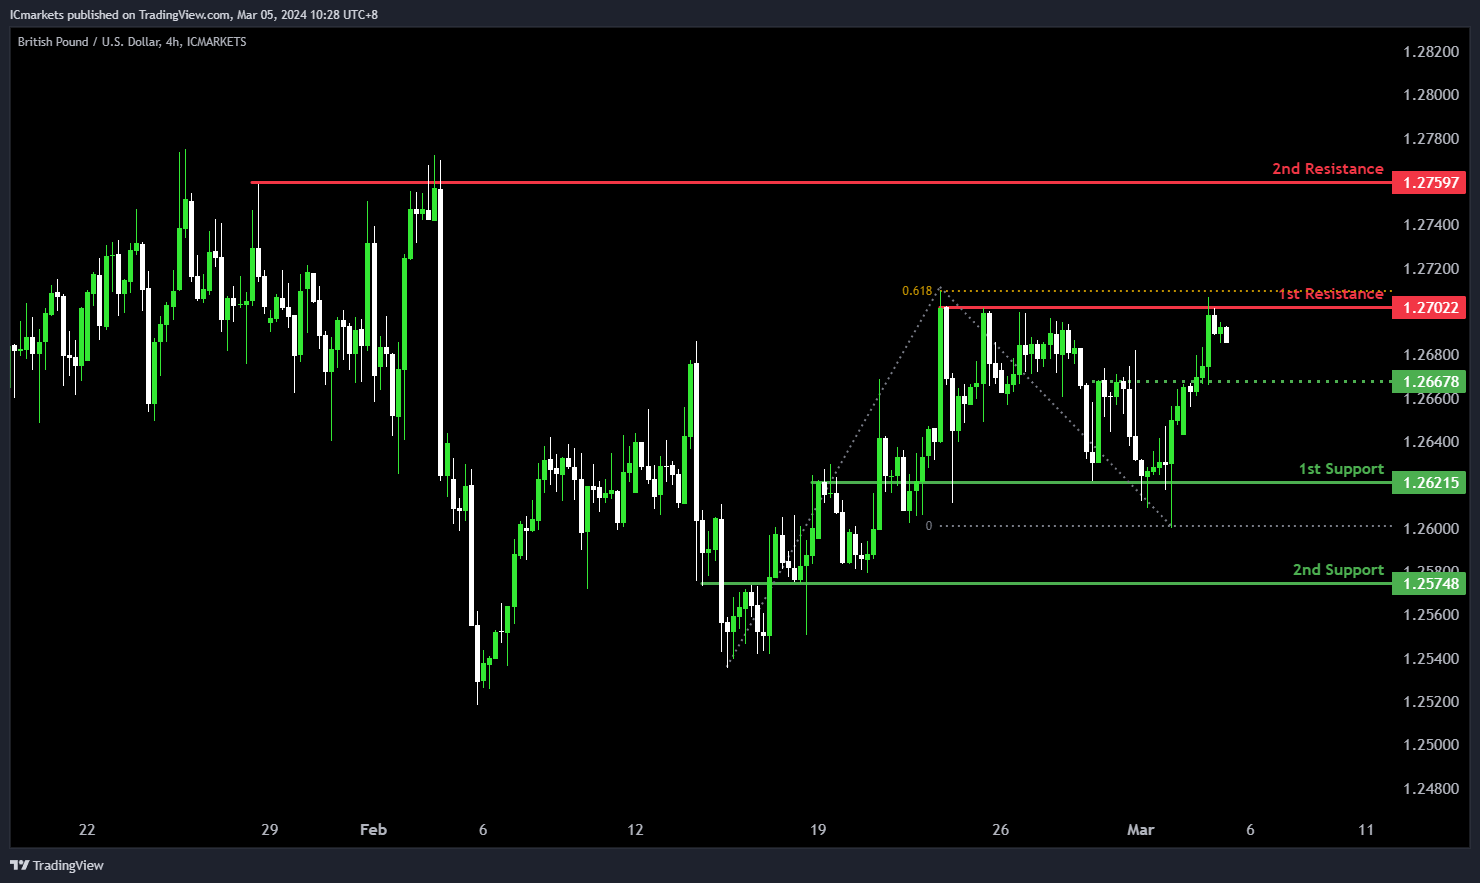
The GBP/USD chart currently exhibits a bearish momentum, suggesting a potential scenario of a bearish continuation towards the 1st support.
The 1st support level at 1.2621 is identified as an overlap support, indicating its historical significance as a level where buying interest has emerged, potentially providing support for the price.
Additionally, the 2nd support at 1.2574 is characterized as an overlap support, further reinforcing its importance as a level where buyers may intervene to prevent further decline. This level also coincides with the 38.20% Fibonacci Retracement, adding to its significance.
On the resistance side, the 1st resistance level at 1.2702 is identified as a multi-swing high resistance. This level may act as a barrier where selling pressure could increase, potentially limiting upward movement in the short term.
Furthermore, the 2nd resistance at 1.2759 is noted for its presence as a multi-swing high resistance, further solidifying its significance as a level where selling interest may intensify, potentially capping the upward movement of prices.
GBP/JPY:
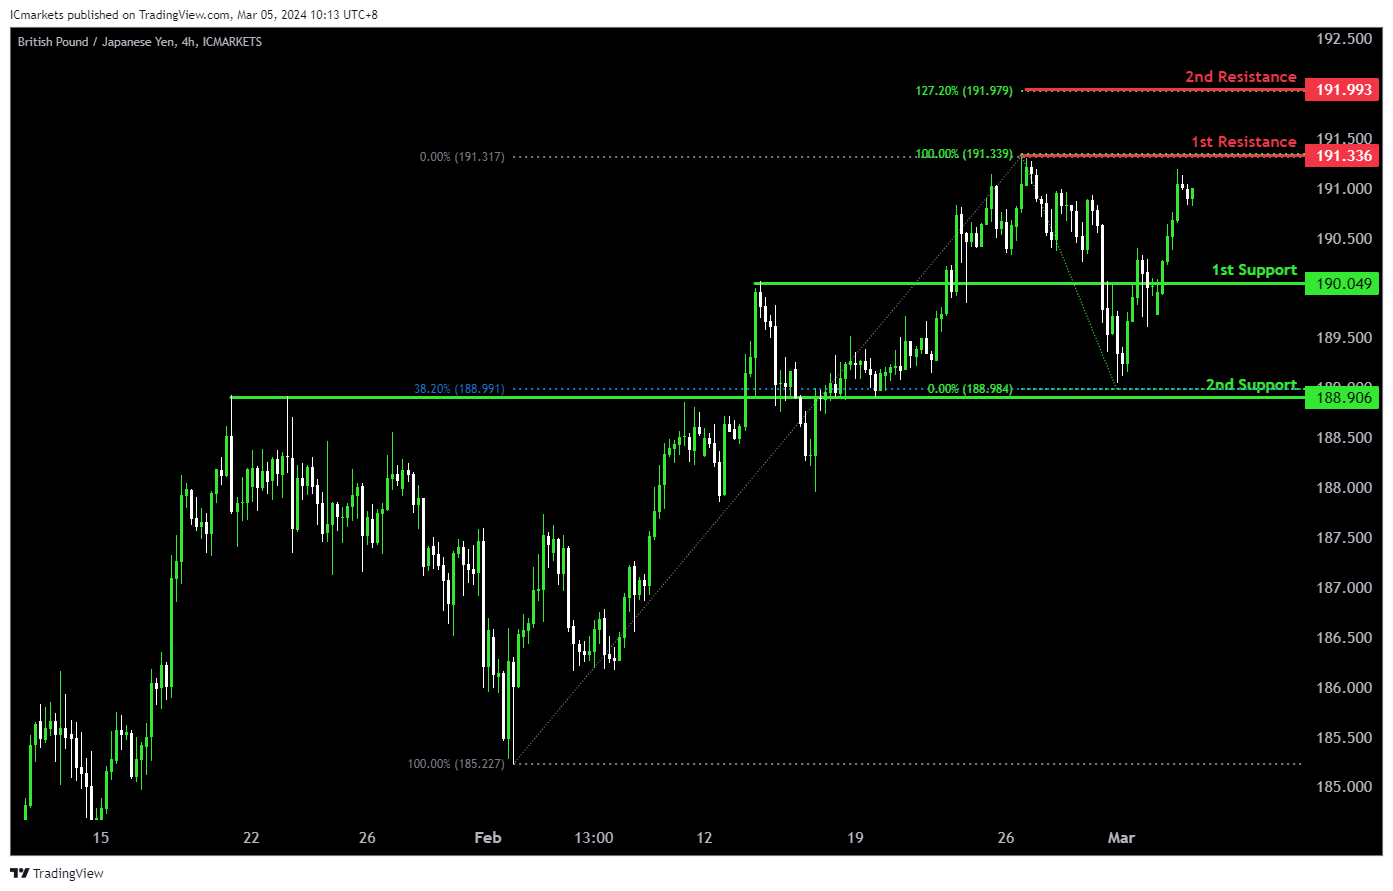
The GBP/JPY chart currently demonstrates bullish momentum, indicating a potential continuation of the upward trend towards the 1st resistance level.
The 1st support level at 190.094 is identified as a pullback support, suggesting a significant level where buying interest could emerge. Additionally, the 2nd support at 188.906 aligns with an overlap support and the 38.20% Fibonacci Retracement, further reinforcing its importance as a potential area of support.
On the resistance side, the 1st resistance level at 191.336 corresponds to a swing high resistance, indicating a historical barrier to upward movement. Moreover, the 2nd resistance level at 191.993 aligns with the 127.20% Fibonacci Extension, adding to its significance as a potential barrier to further bullish movement.
USD/CHF:
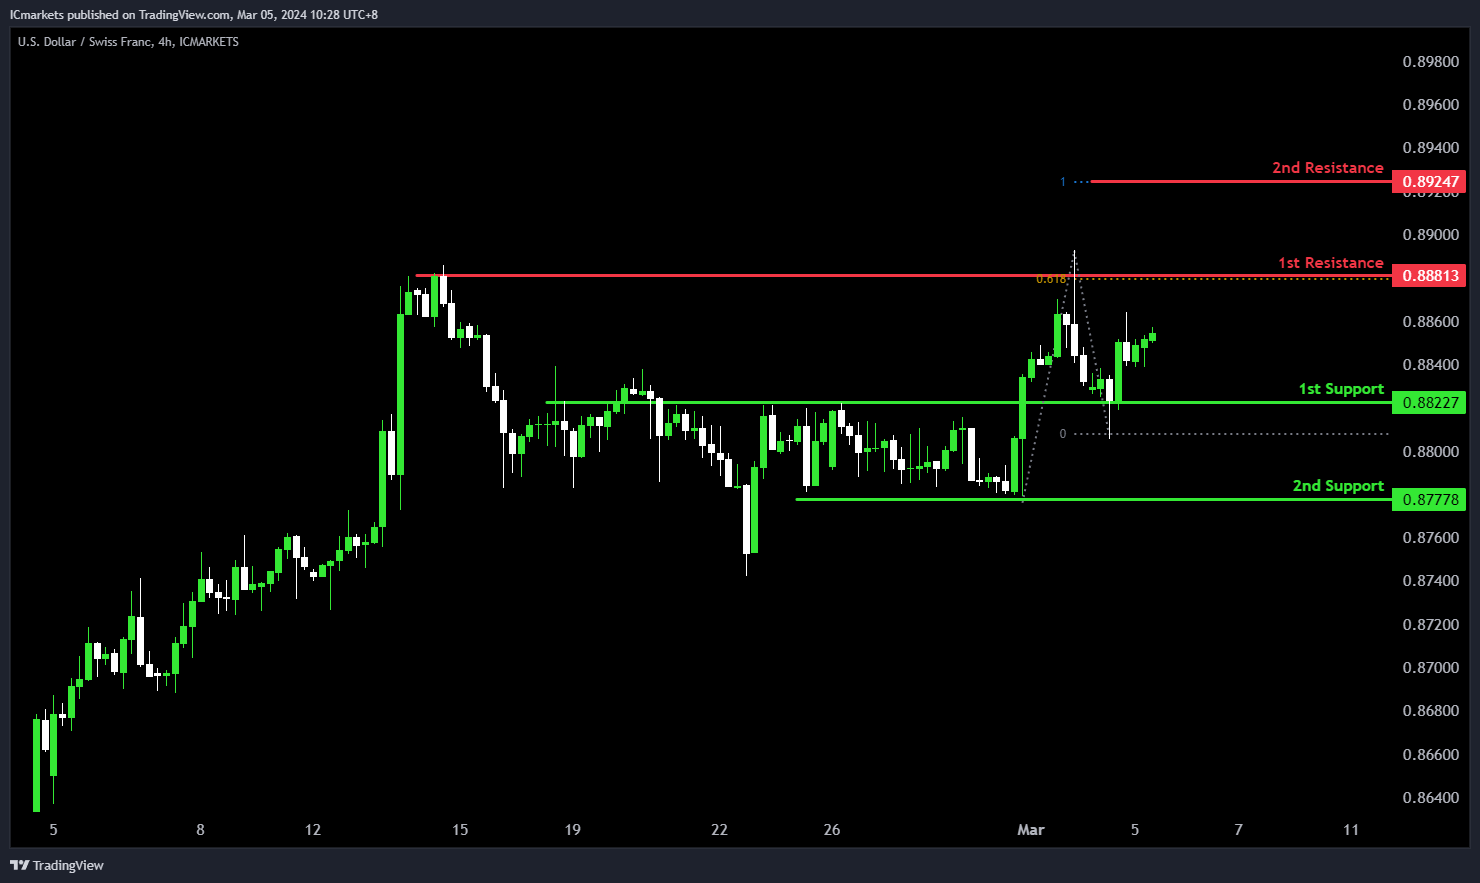
The USD/CHF chart currently exhibits bullish momentum, suggesting a potential scenario of a bullish continuation towards the 1st resistance.
The 1st support level at 0.8822 is identified as an overlap support, indicating its historical significance as a level where buying interest has emerged, potentially providing support for the price.
Moreover, the 2nd support at 0.8777 is characterized as a multi-swing low support, reinforcing its importance as a level where buyers have historically intervened to prevent further decline.
On the resistance side, the 1st resistance level at 0.8881 is identified as a multi-swing high resistance. This level may act as a barrier where selling pressure could increase, potentially limiting upward movement in the short term. Additionally, it aligns with the 61.80% Fibonacci Projection, adding confluence to its significance.
Furthermore, the 2nd resistance at 0.8924 is noted for its presence as an overlap resistance. This level coincides with the 100% Fibonacci Projection, further reinforcing its importance as a level where selling interest may intensify, potentially capping the upward movement of prices.
USD/JPY:
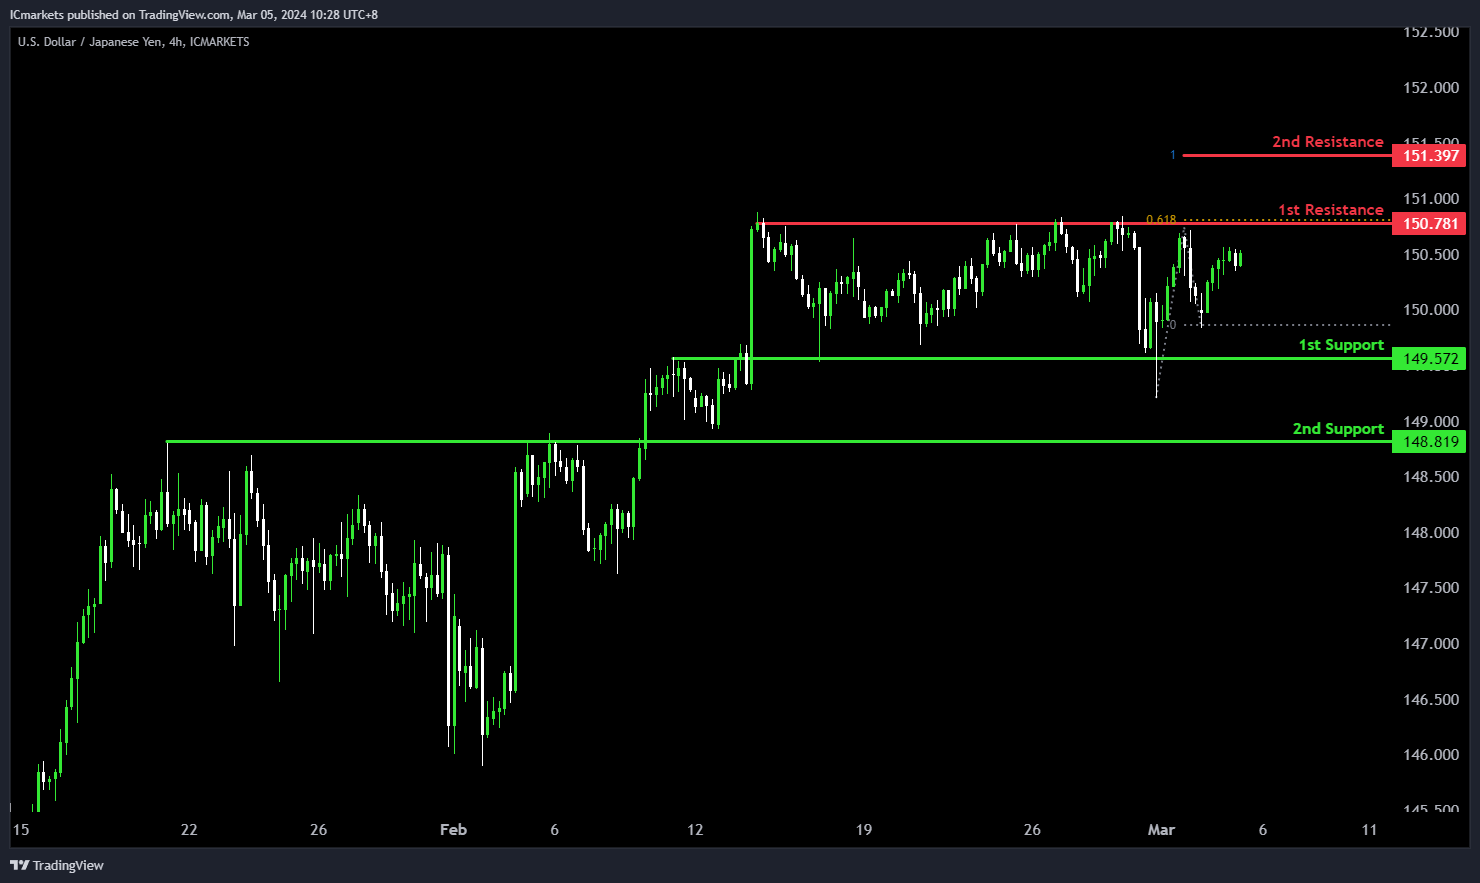
The USD/JPY chart currently exhibits neutral momentum, suggesting a potential scenario of fluctuation between the 1st resistance and 1st support level.
The 1st support level at 149.57 is identified as an overlap support, indicating its historical significance as a level where buying interest has emerged, potentially providing support for the price.
Similarly, the 2nd support at 148.81 is characterized as an overlap support, reinforcing its importance as a level where buyers have historically intervened to prevent further decline.
On the resistance side, the 1st resistance level at 150.78 is identified as a multi-swing high resistance. This level may act as a barrier where selling pressure could increase, potentially limiting upward movement in the short term. Additionally, it aligns with the 61.80% Fibonacci Projection, adding confluence to its significance.
Furthermore, the 2nd resistance at 151.39 is noted for its presence as a significant level, as indicated by the 100% Fibonacci Projection.
USD/CAD:
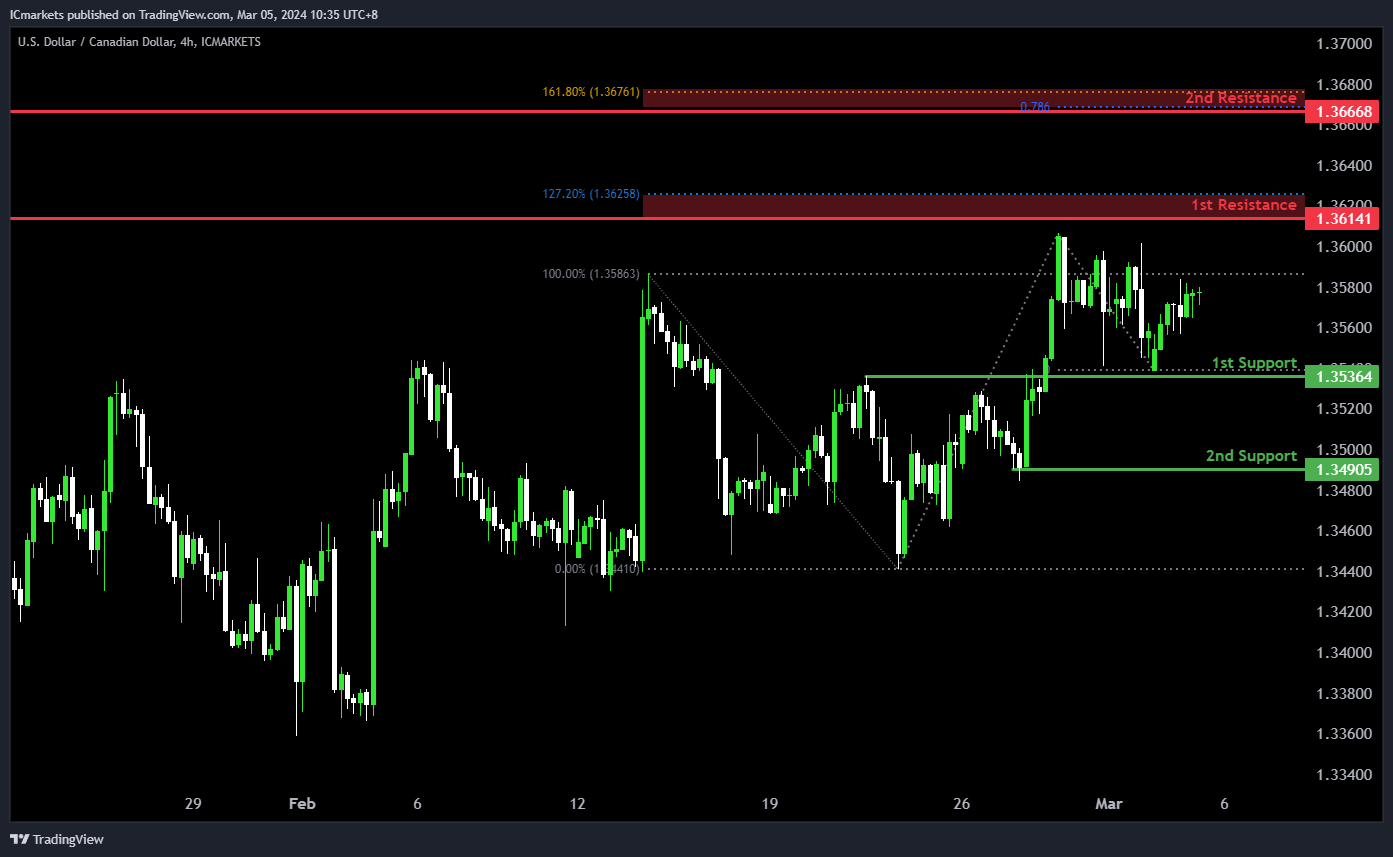
The USD/CAD chart currently exhibits an overall bullish momentum. In this context, there is a potential scenario for price to rise towards the 1st resistance.
The 1st resistance level at 1.3614 is identified as a pullback resistance that aligns close to the 127.20% Fibonacci Extension level. Higher up, the 2nd resistance level at 1.3666 is also marked as a pullback resistance that aligns with a confluence of Fibonacci levels i.e. the 78.60% Projection and the 161.80% Extension, further highlighting its importance as a potential resistance zone.
To the downside, the 1st support level at 1.3536 is identified as an overlap support. Further below, the 2nd support level at 1.3490 is marked as a pullback support, reinforcing its significance as a key support level.
AUD/USD:
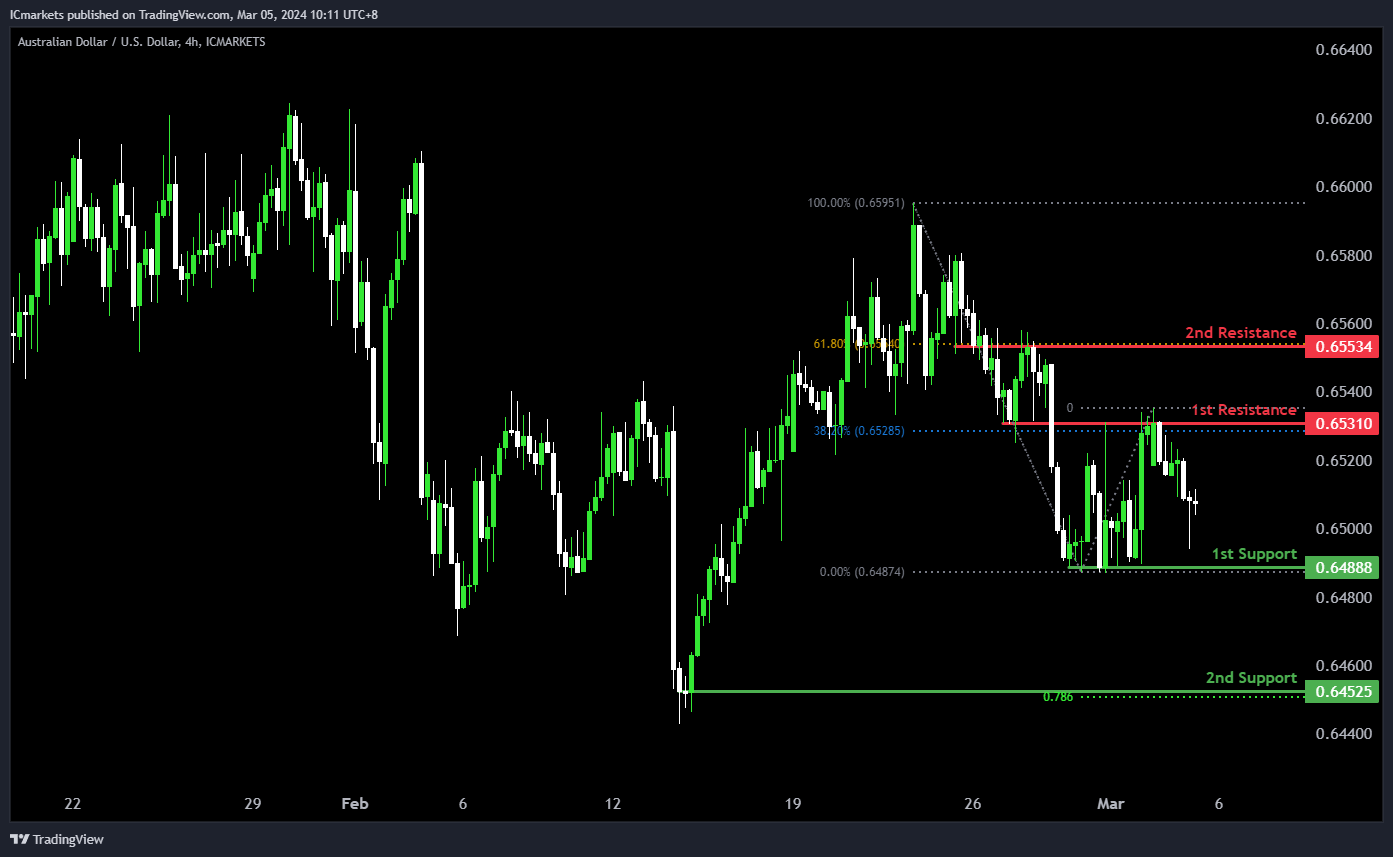
The AUD/USD chart currently exhibits an overall bearish momentum. In this context, there is a potential scenario for price to fall towards the 1st support.
The 1st support level at 0.6488 is identified as a pullback support. Further below, the 2nd support level at 0.6452 is marked as a swing-low support, further emphasizing its importance as a potential support zone.
To the upside, the 1st resistance level at 0.6531 is identified as an overlap resistance that aligns with the 38.20% Fibonacci Retracement level. Higher up, the 2nd resistance level at 0.6553 is also noted as an overlap resistance that aligns with the 61.80% Fibonacci Retracement level, further highlighting its importance as a potential resistance zone.
NZD/USD
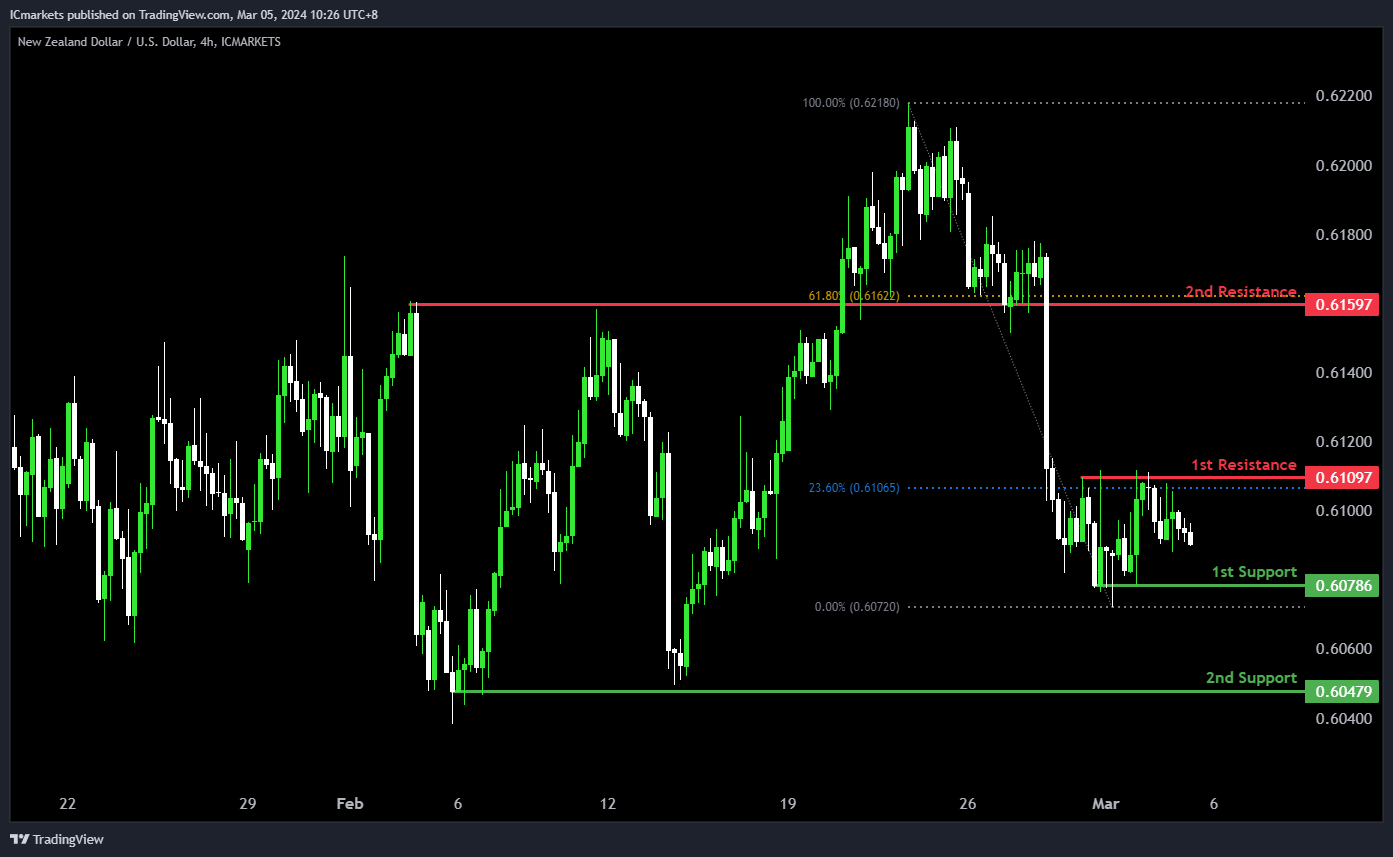
The NZD/USD chart currently exhibits a neutral bias. In this context, there is a potential scenario for price to fluctuate between the 1st support and the 1st resistance.
The 1st support level at 0.6078 is identified as a pullback support. Further below, the 2nd support level at 0.6047 is also marked as a pullback support, further emphasizing its importance as a potential support zone.
To the upside, the 1st resistance level at 0.6109 is identified as a pullback resistance that aligns close to the 23.60% Fibonacci Retracement level. Higher up, the 2nd resistance level at 0.6159 is noted as an overlap resistance that aligns close to the 61.80% Fibonacci Retracement level, further highlighting its importance as a potential resistance zone.
DJ30:
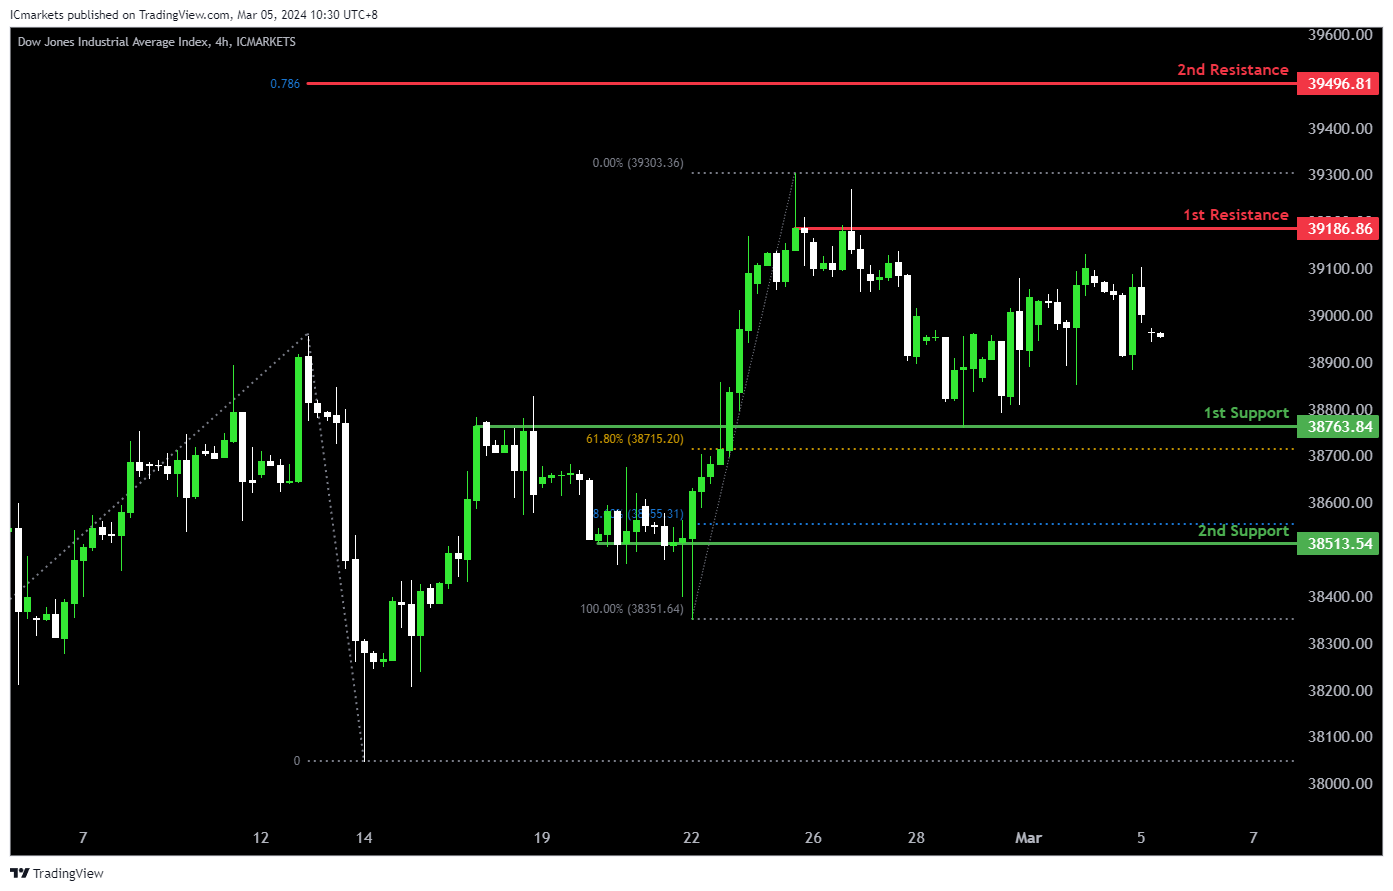
The DJ30 chart currently reflects bullish momentum, suggesting a potential bounce off the 1st support level towards the 1st resistance.
The 1st support at 38763.84 is a significant level identified as both a pullback support and coinciding with the 61.80% Fibonacci Retracement, indicating a strong area where buying pressure may emerge. Additionally, the 2nd support at 38513.54 aligns with a swing low support and the 78.60% Fibonacci Retracement, further reinforcing its importance as a potential area of support.
On the resistance side, the 1st resistance level at 39186.86 corresponds to a swing high resistance, suggesting a historical barrier to upward movement. Moreover, the 2nd resistance level at 39496.81 aligns with the 78.60% Fibonacci Projection, adding to its significance as a potential barrier to further bullish movement.
GER40:
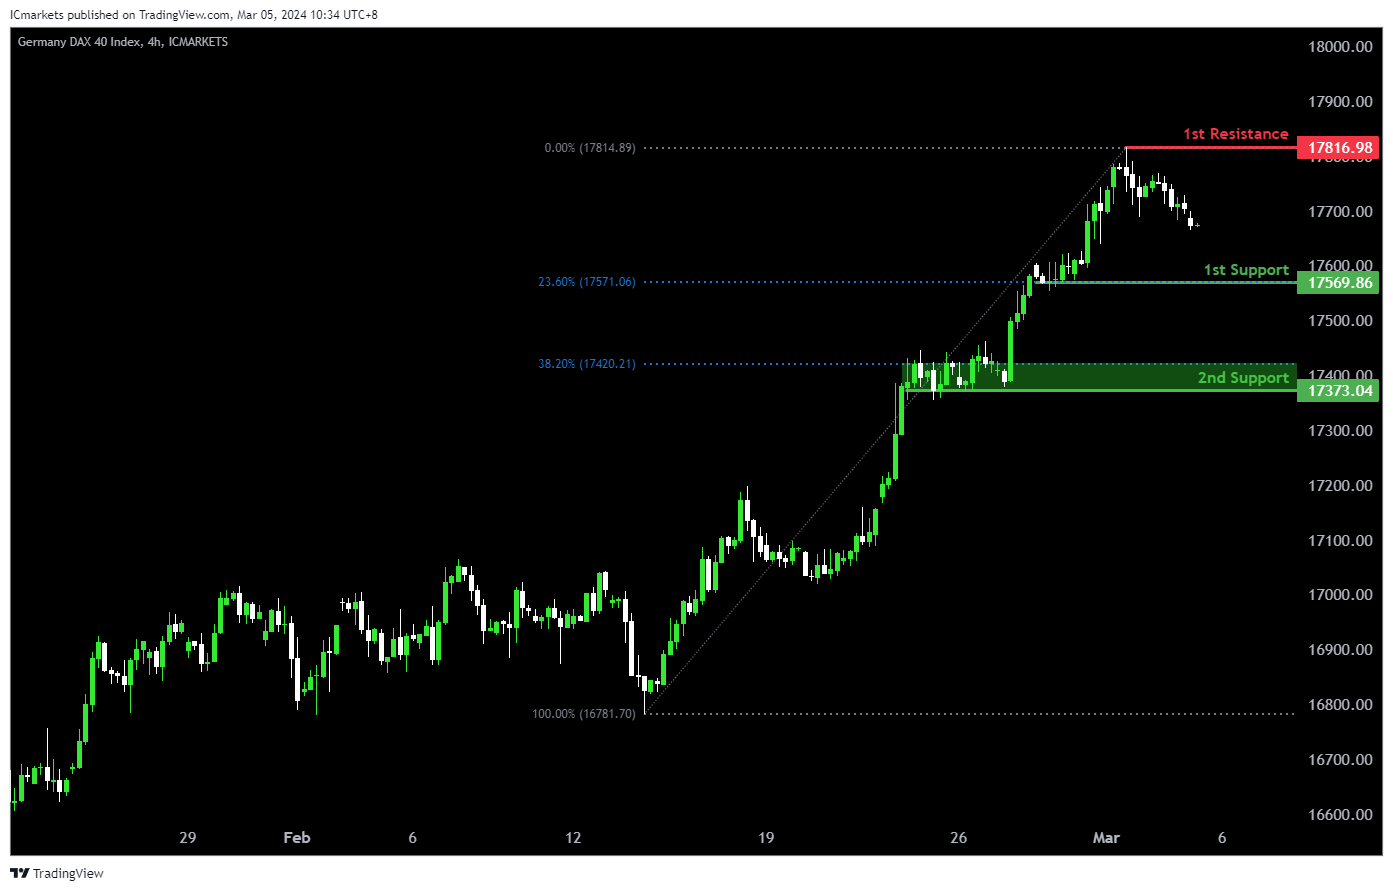
The GER40 chart currently shows bullish momentum, indicating a potential drop to the 1st support level in the short term before bouncing back towards the 1st resistance.
The 1st support level at 17569.86 is significant as it aligns with both a pullback support and the 23.60% Fibonacci Retracement, suggesting a strong historical level where buying interest could emerge. Additionally, the 2nd support at 17373.04 corresponds to a pullback support and the 38.20% Fibonacci Retracement, further reinforcing its importance as a potential area of support.
On the resistance side, the 1st resistance level at 17816.98 is identified as a swing high resistance, indicating a historical barrier to upward movement.
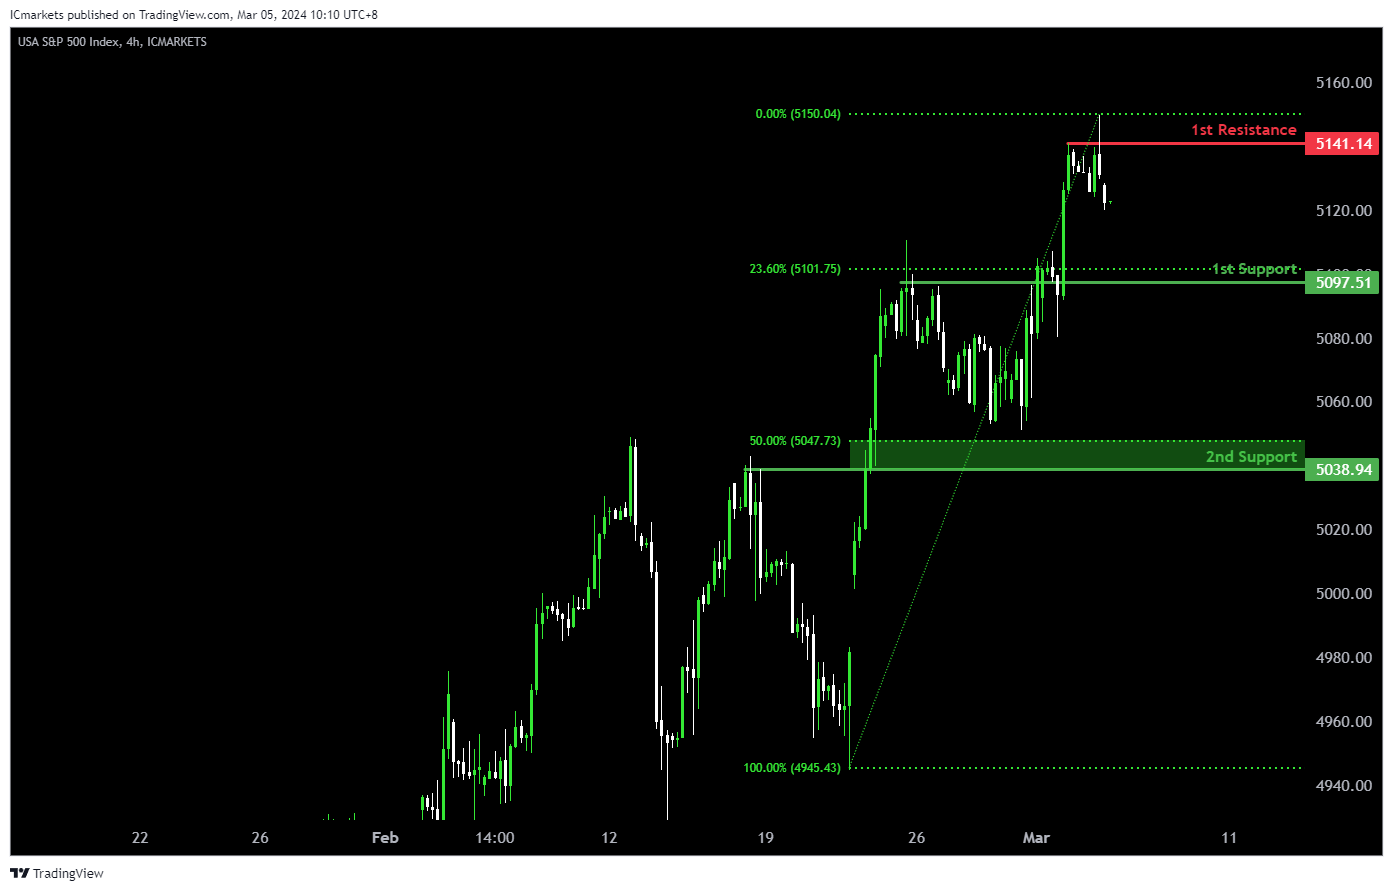
US500:
The US500 chart currently maintains a bullish momentum, suggesting a potential short-term drop to the 1st support level before rebounding towards the 1st resistance.
The 1st support at 5097.51 aligns with a pullback support and the 23.60% Fibonacci Retracement, indicating a historically significant level where buying interest may emerge. Additionally, the 2nd support at 5038.94 corresponds to another pullback support and the 50% Fibonacci Retracement, further reinforcing its potential as a support area.
On the resistance side, the 1st resistance level at 5141.14 is identified as a swing high resistance, signifying a historical barrier to upward movement.
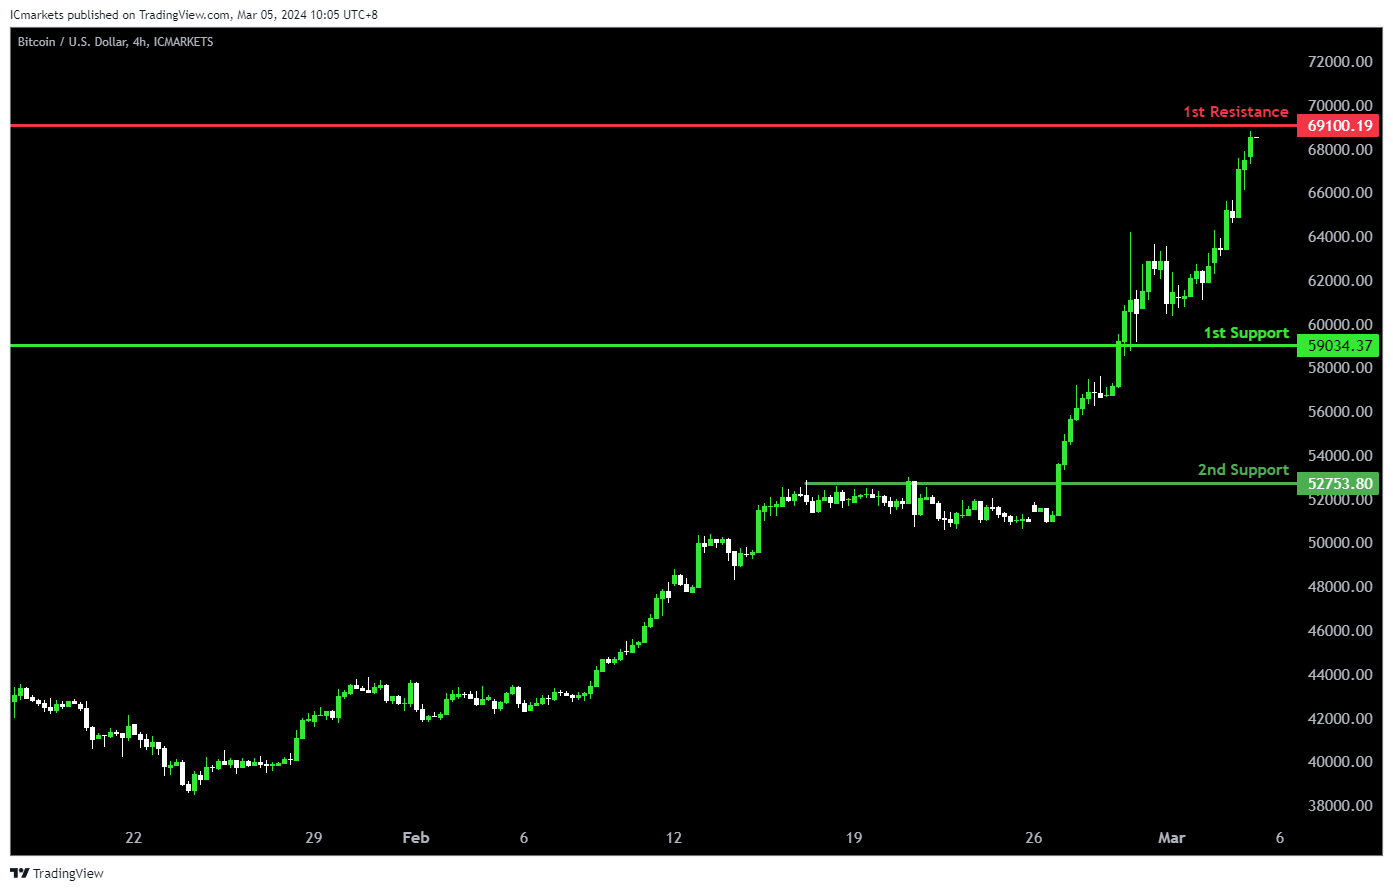
BTC/USD:
The BTC/USD chart is currently showing bullish momentum, suggesting a potential breakout above the 1st resistance level with a subsequent rise towards the 2nd resistance.
The 1st support at 59034.37 aligns with an overlap support, indicating a significant historical level where buying interest has previously emerged. Furthermore, the 2nd support at 52753.80 corresponds to a pullback support, adding further strength to this level as a potential area of support.
On the resistance side, the 1st resistance level at 69100.19 is identified as a swing high resistance, suggesting a historical barrier to upward movement.
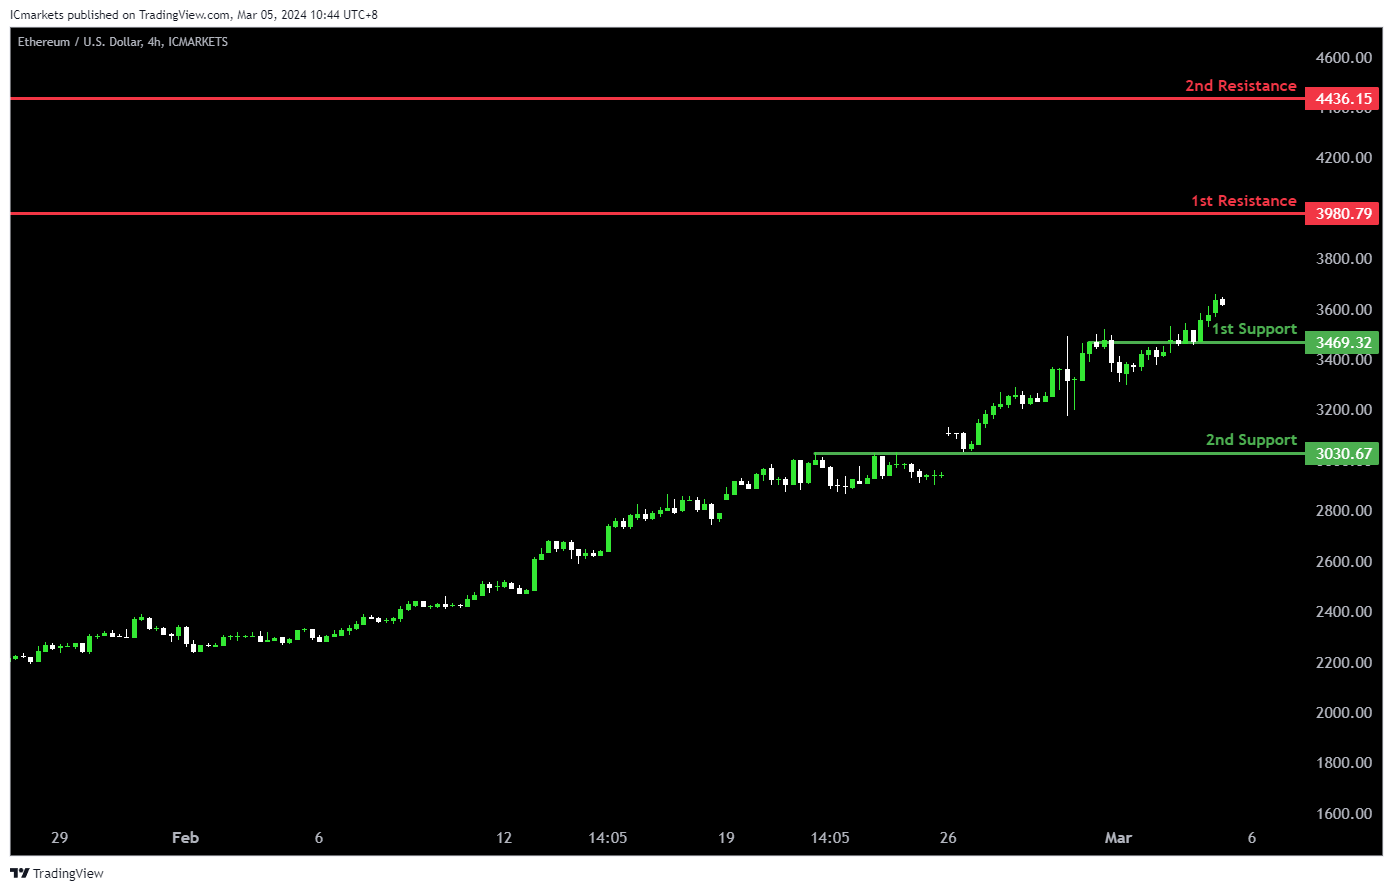
ETH/USD:
The ETH/USD chart demonstrates bullish momentum, supported by several factors contributing to its upward movement.
The 1st support level at 3469.32 indicates a significant area of pullback support, suggesting historical buying interest around this level. Additionally, the 2nd support at 3030.67 aligns with an overlap support, further reinforcing its significance as a potential area of support.
On the resistance side, the 1st resistance level at 3980.79 corresponds to an overlap resistance, indicating a historical barrier to upward movement. Moreover, the 2nd resistance at 4436.15 also aligns with an overlap resistance, adding to its significance as a potential barrier to further bullish movement.
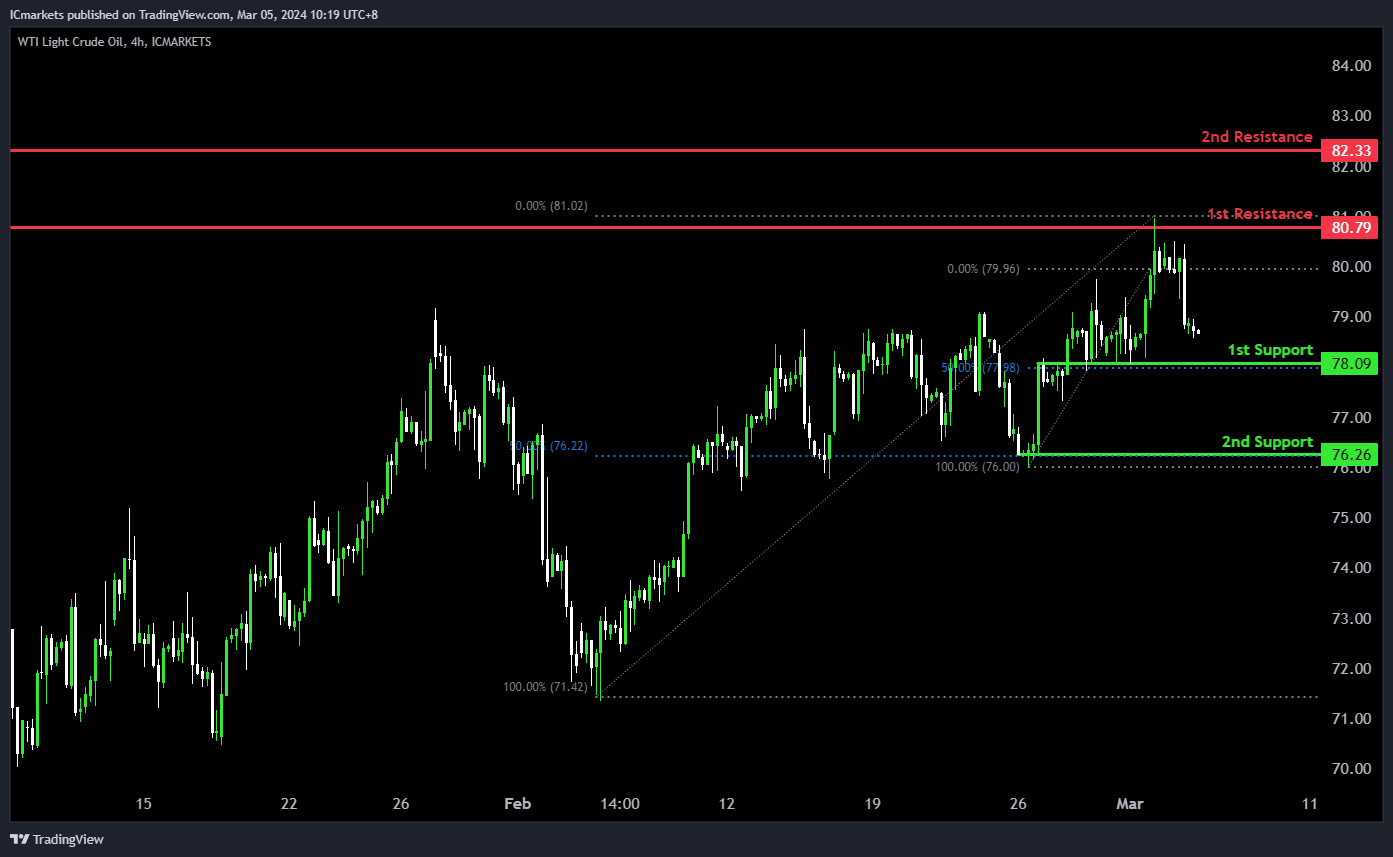
WTI/USD:
The WTI (West Texas Intermediate) chart currently exhibits an overall bullish momentum. However, there is a potential scenario for price to fall towards the 1st support before making a bullish bounce off this level.
The 1st support level at 78.09 is identified as an overlap support that aligns with the 50.00% Fibonacci Retracement level. Further below, the 2nd support level at 76.26 is marked as a pullback support that aligns with the 50.00% Fibonacci Retracement level, reinforcing its significance as a key support level.
To the upside, the 1st resistance level at 80.79 is identified as an overlap resistance. Higher up, the 2nd resistance level at 82.33 is marked as a pullback resistance, further highlighting its importance as a potential resistance zone.
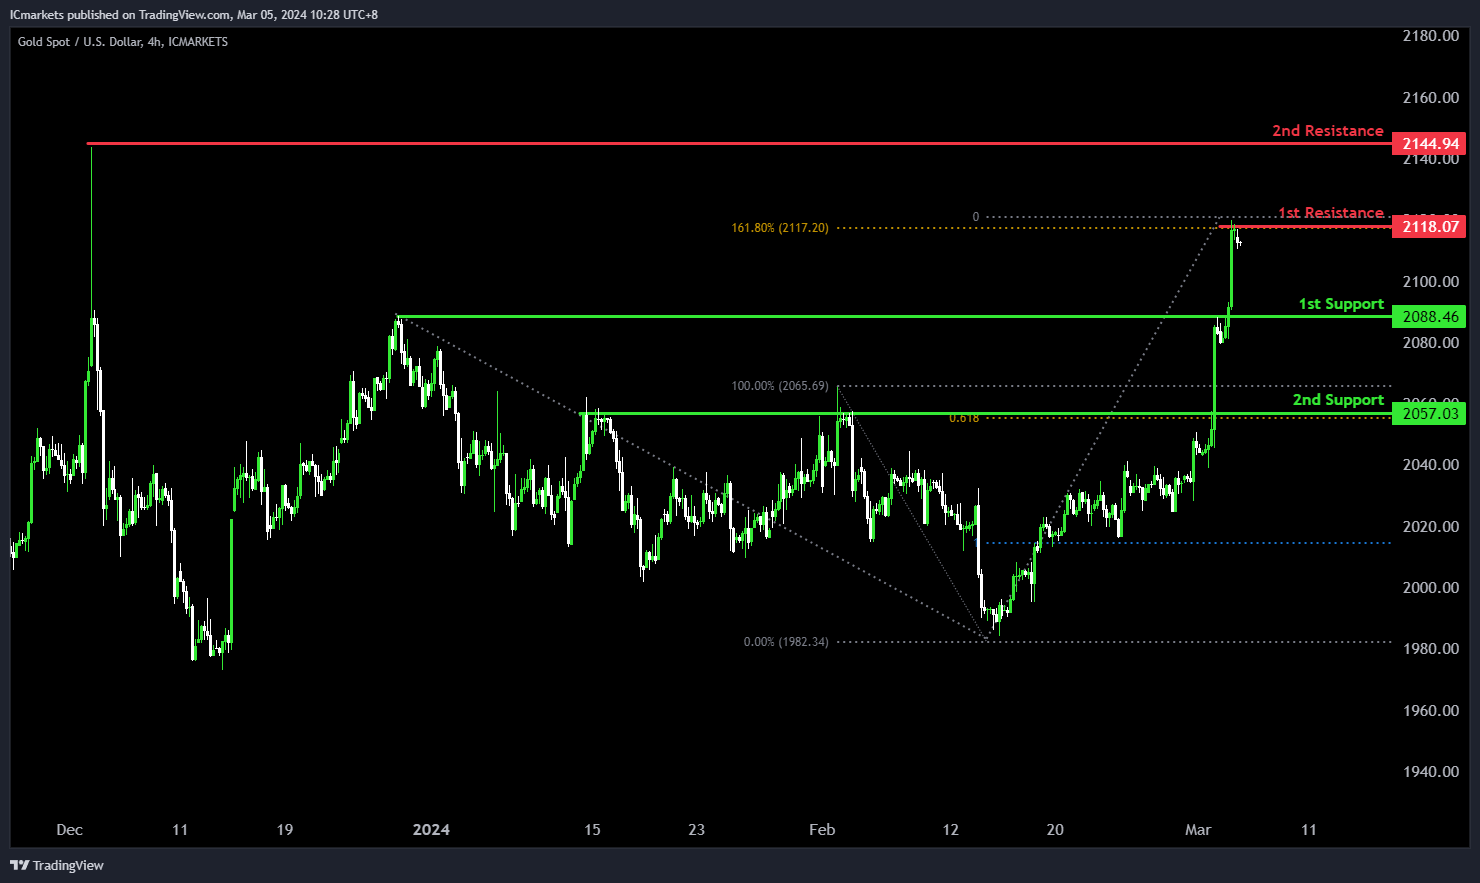
XAU/USD (GOLD):
The XAUUSD chart currently shows a bearish momentum, indicating a potential continuation towards the 1st support level.
The 1st support at 2088.46 is considered a pullback support, suggesting its significance as a level where buyers could potentially step in to halt the downward movement.
Additionally, the 2nd support at 2057.03 reinforces the support zone, being aligned with the 61.80% Fibonacci Projection. This level further underscores its potential as a strong area of support.
On the resistance side, the 1st resistance level at 2118.07 is identified as a swing high resistance. This level could act as a barrier where selling pressure may increase, potentially limiting the upward movement in the short term.
Moreover, the 2nd resistance at 2144.94 also serves as a swing high resistance, indicating its significance as a level where selling interest may intensify.
The accuracy, completeness and timeliness of the information contained on this site cannot be guaranteed. IC Markets does not warranty, guarantee or make any representations, or assume any liability regarding financial results based on the use of the information in the site.
News, views, opinions, recommendations and other information obtained from sources outside of www.icmarkets.com.au, used in this site are believed to be reliable, but we cannot guarantee their accuracy or completeness. All such information is subject to change at any time without notice. IC Markets assumes no responsibility for the content of any linked site.
The fact that such links may exist does not indicate approval or endorsement of any material contained on any linked site. IC Markets is not liable for any harm caused by the transmission, through accessing the services or information on this site, of a computer virus, or other computer code or programming device that might be used to access, delete, damage, disable, disrupt or otherwise impede in any manner, the operation of the site or of any user’s software, hardware, data or property.


