
A note on lower timeframe confirming price action…
Waiting for lower timeframe confirmation is our main tool to confirm strength within higher timeframe zones, and has really been the key to our trading success. It takes a little time to understand the subtle nuances, however, as each trade is never the same, but once you master the rhythm so to speak, you will be saved from countless unnecessary losing trades. The following is a list of what we look for:
- A break/retest of supply or demand dependent on which way you’re trading.
- A trendline break/retest.
- Buying/selling tails – essentially we look for a cluster of very obvious spikes off of lower timeframe support and resistance levels within the higher timeframe zone.
- Candlestick patterns. We tend to only stick with pin bars and engulfing bars as these have proven to be the most effective.
For us, lower timeframe confirmation starts on the M15 and finishes up on the H1, since most of our higher timeframe areas begin with the H4.
EUR/USD:
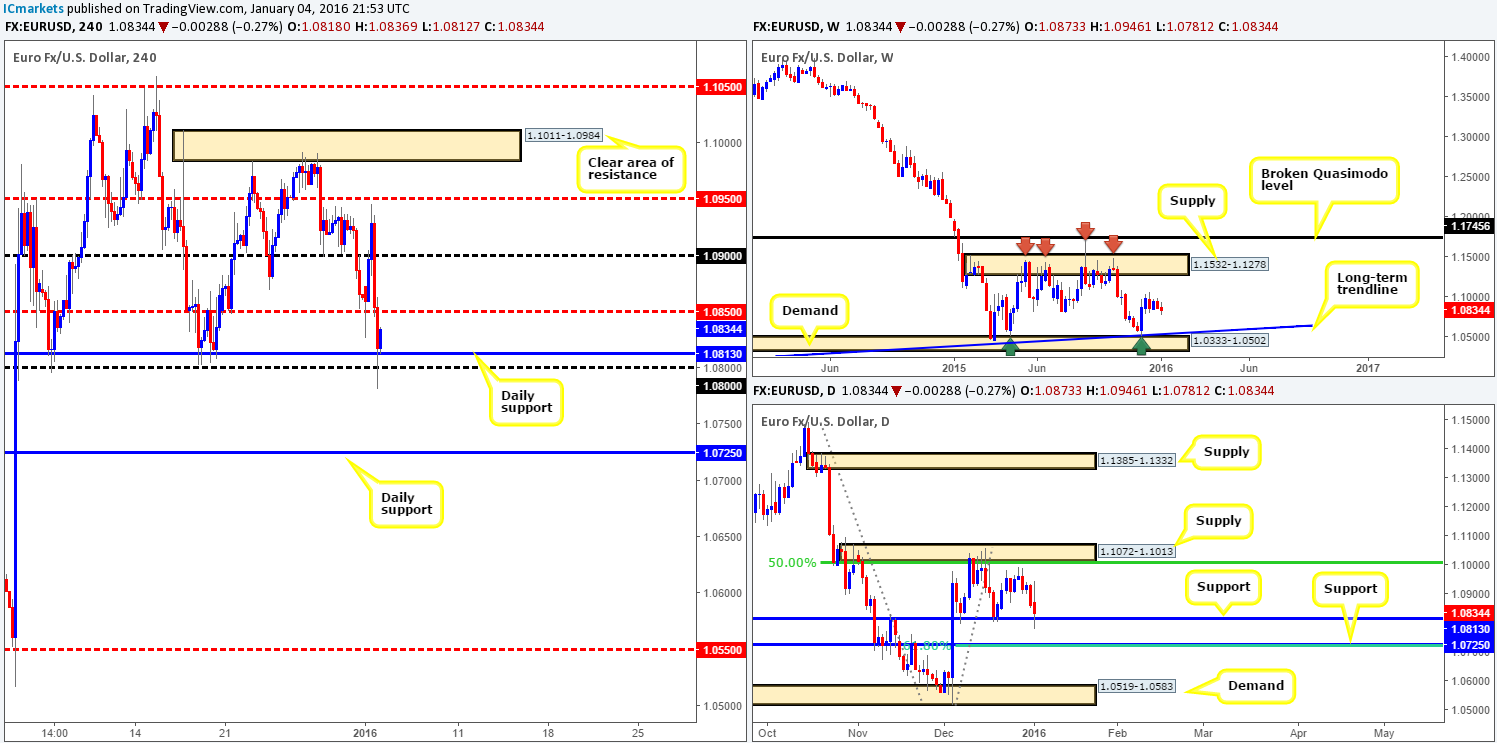
As can be seen from the H4 chart, despite negative U.S manufacturing and construction data, the single currency sold off from just below mid-level resistance (1.0946) 1.0950 going into American trade yesterday. This 160-pip or so drop took out a couple of technical supports before ending the day whipsawing through both daily support at 1.0813 and psychological support 1.0800.
Seeing as how this pair is crossing swords with daily support (see above), and weekly action shows price loitering mid-range between supply at 1.1532-1.1278 and demand drawn from 1.0333-1.0502, our attention will mostly be driven toward longs today. However, for a trade to take place from current prices, near-term offers at 1.0850 will need to be taken out first – ideally a spike above the level and retrace back to 1.0813 would be nice for an entry long.
Should the current daily support give way, nevertheless, we’ll then be eyeing shorts down to the next daily support fixed at 1.0725. A retest of this level along with lower timeframe confirmation would need to be seen before committing capital to this idea.
Levels to watch/live orders:
- Buys: Watch for offers to be taken out around 1.0850 before looking to long from the 1.0813 region (lower timeframe confirmation required).
- Sells: Watch for bids to be consumed around 1.0813/1.0800 and then look to trade any retest of this area thereafter (lower timeframe confirmation preferred).
GBP/USD:
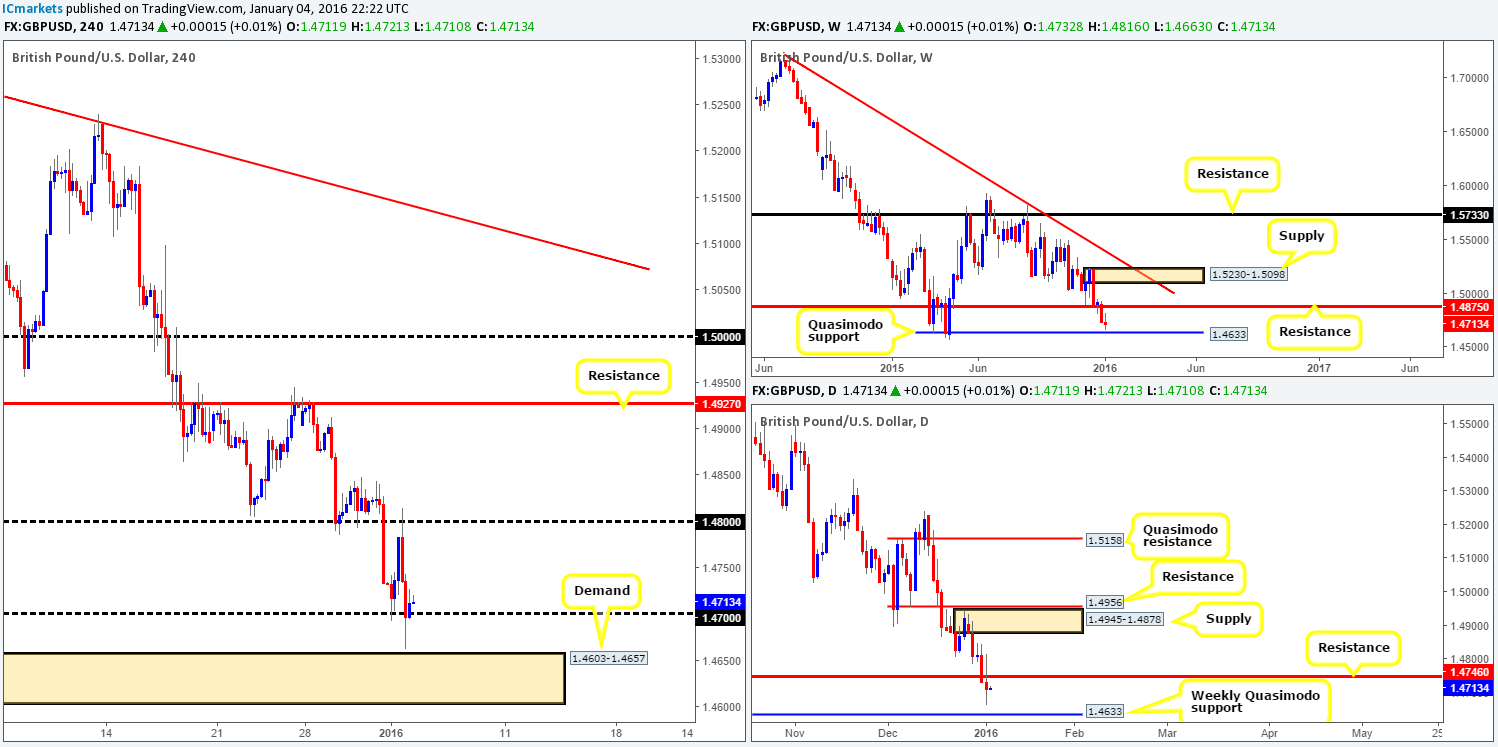
Similar to the EUR/USD, mid-way through the London session Cable also sold off from psychological resistance 1.4800. This, as you can see, forced price to snap through bids at psychological support 1.4700, just missing H4 demand at 1.4603-1.4657 before turning higher into the close 1.4711.
Although this market is currently respecting 1.4700 as support, entering long from here might not be the best path to take. Our reasoning lies within the higher timeframe structure. Take note that price is hovering just above a weekly Quasimodo support at 1.4633, which, in our opinion, is crying out to be tested. Furthermore, notice that yesterday’s daily action painted an indecision candle at the underside of resistance coming in at 1.4746, which could just be enough to edge prices lower into the weekly level today.
For reasons given above, we have placed a pending buy order just above the aforementioned H4 demand at 1.4658 with a stop set at 1.4597. Should the order be filled, we’ll quickly liquidate some of the position at 1.4700, and look to trail the rest hiding behind supports as/if and when they form.
Levels to watch/live orders:
- Buys: 1.4658 [Pending order] (Stop loss: 1.4597).
- Sells: Flat (Stop loss: N/A).
AUD/USD:
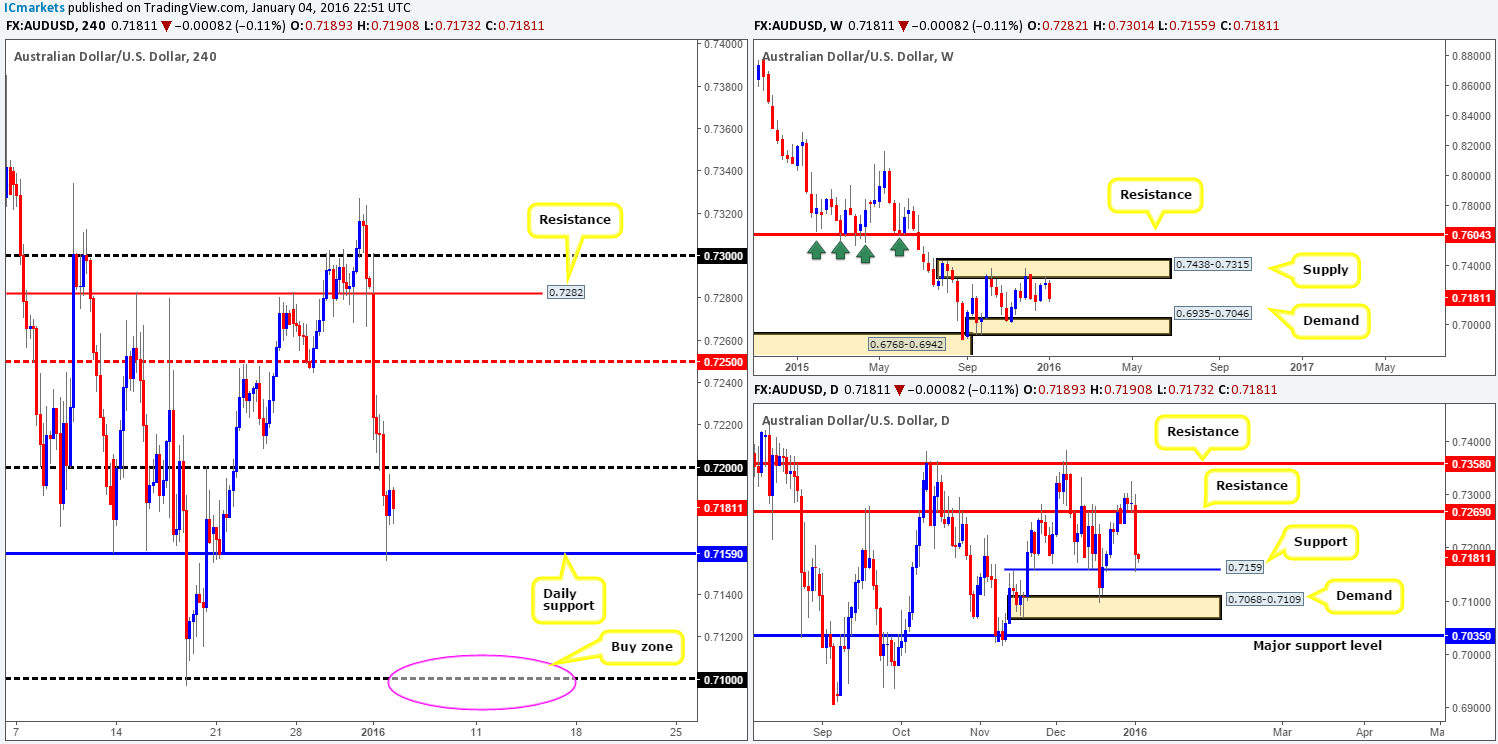
Yesterday’s trade clearly started with a bang! The Aussie dropped close to 100 pips throughout the day, weighed on by weak Chinese manufacturing data. Several technical supports were taken out during the onslaught, and it was only once price reached daily support at 0.7159 did the tracks begin to change. Technically, the sell-off came from the underside of weekly supply sitting at 0.7438-0.7315, and if the above said daily support gives way, we could see this selling continue down to at least daily demand drawn from 0.7068-0.7109.
On account of the above, this is what our team has logged so far:
- No buy opportunities seen at current price. A close above and retest of 0.7200 would need to take place before we’d consider a long up to mid-level resistance 0.7250.
- Due to weekly sellers likely coming into the market, daily support at 0.7159 could be consumed, and, as a result, open the gates to further downside towards daily demand mentioned above at 0.7068-0.7109. To trade this move, a retest of 0.7159 as resistance would need to be seen alongside lower timeframe confirming price action.
- Should point two come to fruition, we’ll then be looking to liquidate shorts around the 0.7100 region and begin hunting for confirmed longs into this market. Not only is 0.7100 a support in itself, it’s also bolstered by the above said daily demand. Therefore, stops should be placed below this daily barrier to be on the safe side! The reason for still needing confirmation is simply because price could ignore the daily demand altogether and head for weekly demand just below it at 0.6935-0.7046.
Levels to watch/live orders:
- Buys: Watch for offers to be taken out around 0.7200 and then look to trade any retest seen thereafter (lower timeframe confirmation required). 0.7100 region [Tentative – confirmation required] (Stop loss: best to be placed below daily demand around the 0.7065 area).
- Sells: Watch for bids to be taken out around 0.7159 and then look to trade any retest seen thereafter (lower timeframe confirmation required).
USD/JPY:
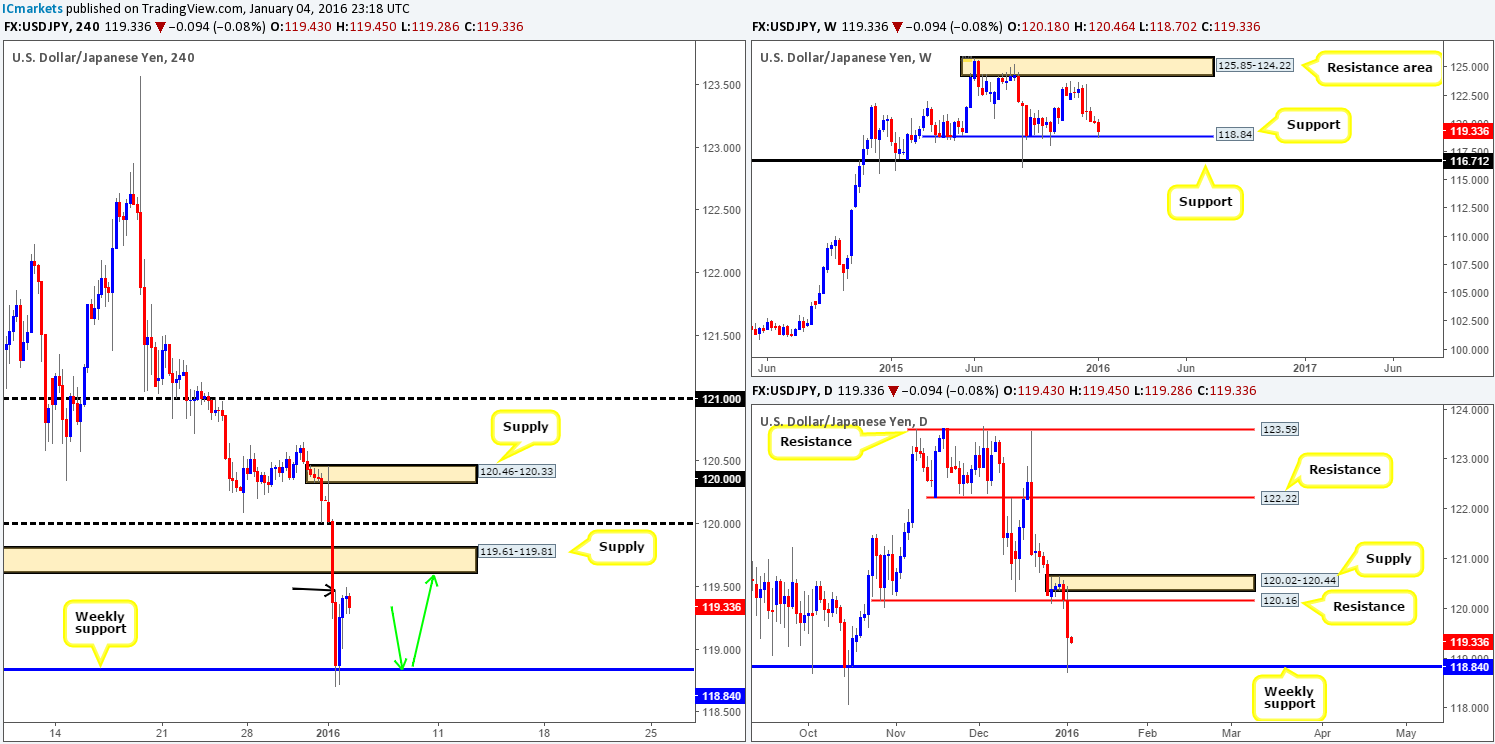
The New Year began with a flurry of Yen buying yesterday – investors are clearly heading to where they feel safest! This swarm of selling took out bids from psychological support 120.00 and also H4 demand (now supply) at 119.61-119.81, before aggressively bouncing from weekly support at 118.40.
For anyone like us who missed this bounce, all may not be lost here traders! This advance has, as far as we can see, consumed offers around an almost invisible high marked with a black arrow at 119.47, consequently clearing the path up to at least H4 supply at 119.61-119.81. Buying now, in our opinion, would be pointless though since risk/reward would be terribly skewed! If, on the other hand, price retraces back to the weekly support WITHOUT connecting with the above H4 supply (the target), our team will be looking to buy as per the green arrows (with lower timeframe confirmation). With this, we’d not only have H4 direction, but also be trading alongside weekly flow.
Levels to watch/live orders:
- Buys: 118.84 region [Tentative – confirmation required] (Stop loss: dependent on where one confirms this level).
- Sells: Flat (Stop loss: N/A).
USD/CAD:
As can be seen from the H4 chart, the USD/CAD opened the New Year indecisively. It was only once the U.S. traders began placing orders did this market see a more decisive move. A heavy round of bids forced the pair above the extremes of a H4 consolidation (1.3813-1.3927), which, as you can see, is currently being retested as support.
Now, given that the trend on this pair is extremely strong, and there’s a potential support on the H4 to buy from, do we go ahead and pull the trigger? Not necessarily. Reason being is that even though price is trending north, both weekly and daily action is currently residing within supply (1.4190-1.3794/ 1.4001-1.3904).
Therefore, in light of the above, we are going to take no action for the time being. Ultimately, for us to join in on this trend, psychological resistance 1.4000 would need to be taken out. That way, daily supply (see above) is no longer a threat and price is (technically) free up to daily resistance at 1.4103. This – alongside the strong bullish trend would be enough for us to consider longs into this market even though price would still be effectively trading within weekly supply.

Levels to watch/live orders:
- Buys: Flat (Stop loss: N/A).
- Sells: Flat (Stop loss: N/A).
USD/CHF:
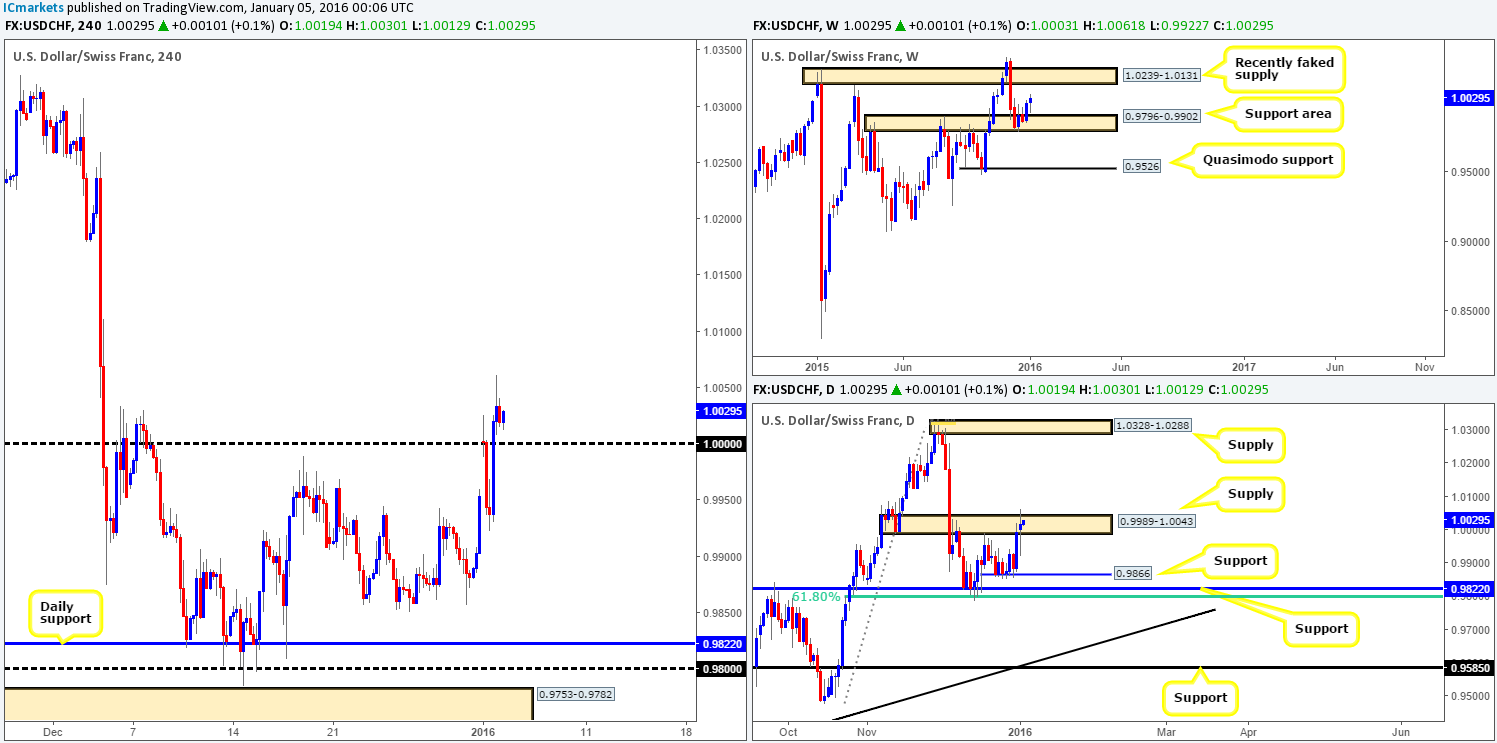
Following a rather large gap north yesterday, initial action saw the USD/CHF rebound from parity reaching lows of 0.9922. Once London opened for business, however, a strong wave of bids flooded the market, pushing price above parity to highs of 1.0061 despite weak U.S. data.
In view of price loitering above parity, how do things stand on the higher timeframes? Well, up on the weekly chart, we can see that there’s room for this market to continue north from the support area at 0.9796-0.9902 up to a recently faked supply coming in at 1.0239-1.0131. Meanwhile, down on the daily chart, buy stops have likely been triggered above supply drawn from 0.9989-1.0043, which could set the stage for a continuation move up to supply at 1.0328-1.0288.
To that end, higher timeframe direction, at least from a technical standpoint is pointing north. As such, today’s spotlight will firmly be focused on parity. Should price retest this barrier as support today and hold firm, we’d begin looking for confirmed longs into this market. With regards to targets, we intend on letting this one flow. What we mean by this is due to the higher timeframes showing room for this market to rally a considerable amount; we’re going to simply trail our stop behind logical support as/if and when it forms, rather than pre-selecting targets off the bat.
Levels to watch/live orders:
- Buys: 1.1000 [Tentative – confirmation required] (Stop loss: dependent on where one confirms this level).
- Sells: Flat (Stop loss: N/A).
DOW 30:
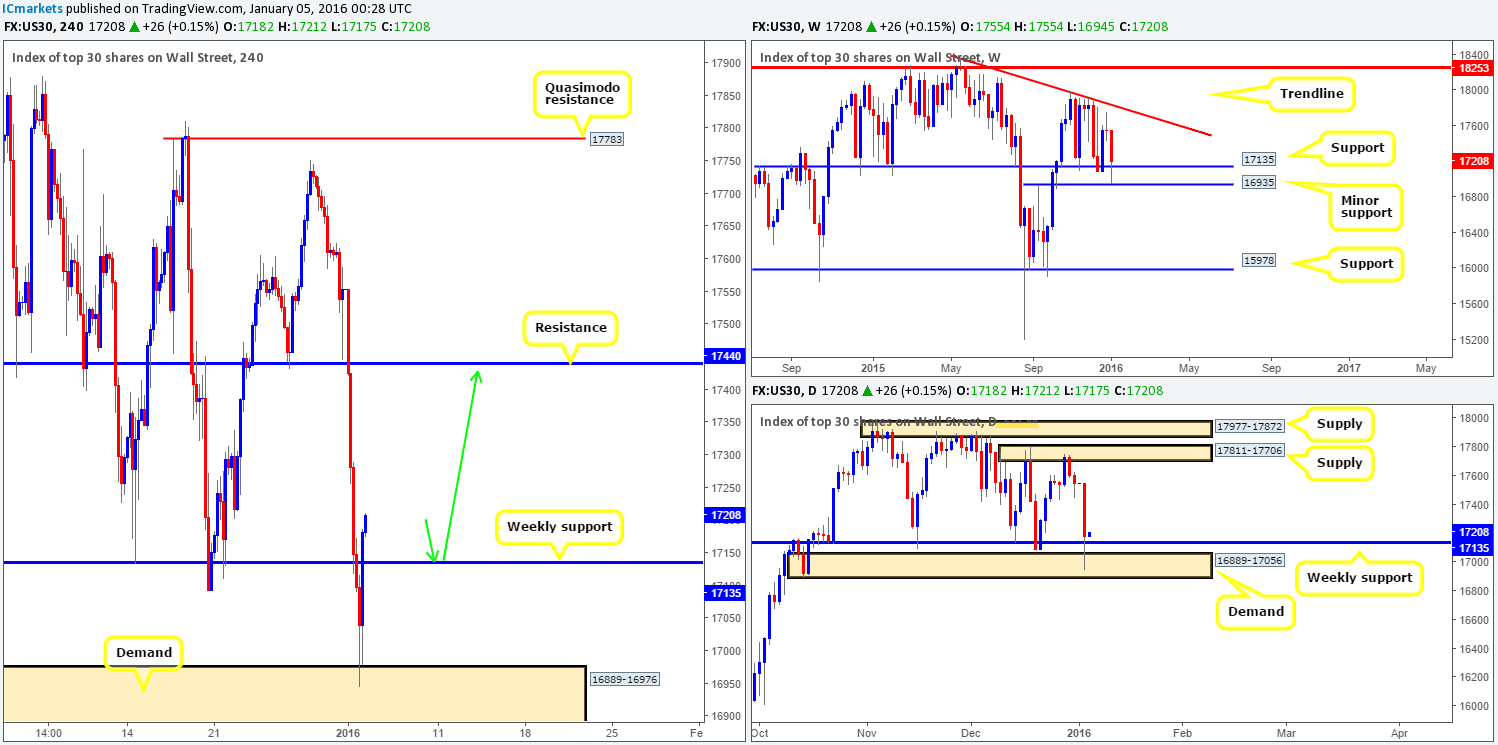
Upon opening the H4 chart of the DOW this morning, we were greeted with a sea of red candles! From open to close, the index lost a total of 372 points! Not exactly a positive start to the New Year! Nevertheless, going into the final few hours of yesterday’s trade, price staged a recovery from H4 demand at 16889-16976 and closed back above weekly support at 17135.
Since we can see weekly support at 17135, and daily demand at 16889-17056 (encapsulates the above said H4 demand) presently bolstering this market, our prime focus today will be looking for price to retest the weekly support barrier at 17135 (as per the green arrows). In the event that we manage to enter long (with lower timeframe confirmation) from here, the H4 resistance coming in at 17440 will be our first take-profit level. However, seeing as how this hurdle is quite a way off, it may be prudent to trail the stop to this target, as there’s nothing worse than letting a winning trade turn into a loser!
Levels to watch/live orders:
- Buys: 17135 [Tentative – confirmation required] (Stop loss: dependent on where one confirms this level).
- Sells: Flat (Stop loss: N/A).
XAU/USD: (Gold)
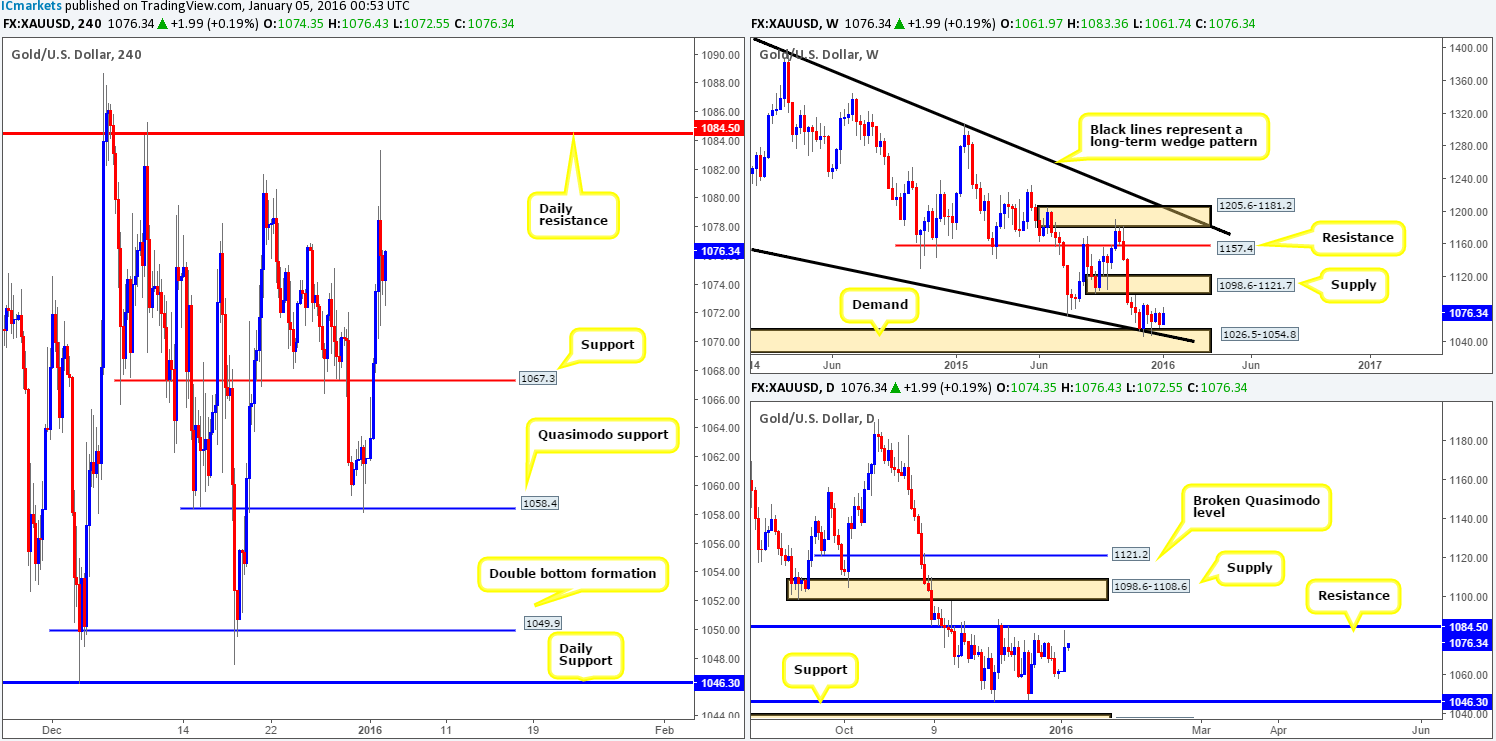
The year-end rebound from the H4 Quasimodo support level at 1058.4 clearly helped kick-off the New Year positively, breaking through H4 resistance (now support) at 1067.3 and just missing daily resistance at 1084.5 by a few pips before reversing into the close 1074.3.
Intel from the H4 chart is not really providing much other than price is now loitering between the above said H4 support and daily resistance (see above). As we move into the bigger picture, weekly action shows that price remains hovering around the top-side of demand at 1026.5-1054.8 (converges beautifully with the lower limits of the current wedge pattern [1180.1]). And, as we already have pointed out, daily movement is now lurking just below resistance.
All in all, with the difference of opinion being seen between our two higher timeframe charts, and H4 price not trading at anything significant right now, we’ll remain on the sidelines and wait for further developments.
Levels to watch/live orders:
- Buys: Flat (Stop loss: N/A).
- Sells: Flat (Stop loss: N/A).


