
Key risk events today:
Australia Cash Rate and Rate Statement; UK Construction PMI.
EUR/USD:
The broad dollar index (DXY) observed strong bidding Monday, largely on sterling’s demise, in which the index settled just south of 98.00. Also bolstering the USD was an overall solid ISM Manufacturing PMI reading.
The Institute for Supply Management noted: the January PMI registered 50.9 percent, an increase of 3.1 percentage points from the seasonally adjusted December reading of 47.8 percent. The New Orders Index registered 52 percent, an increase of 4.4 percentage points from the seasonally adjusted December reading of 47.6 percent. The Production Index registered 54.3 percent, up 9.5 percentage points compared to the seasonally adjusted December reading of 44.8 percent.
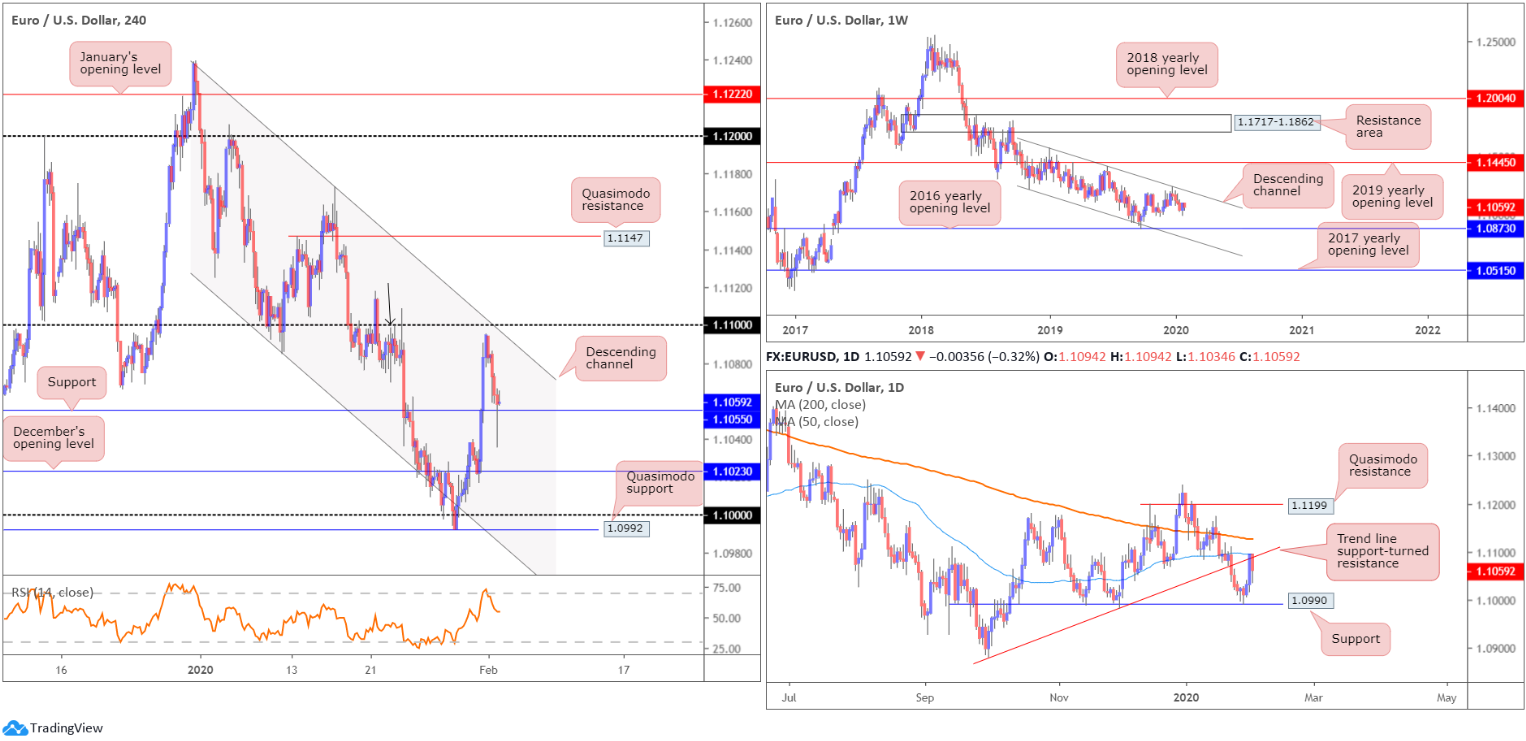
From the weekly timeframe on EUR/USD, the pair remains languishing beneath long-standing channel resistance, drawn from the high 1.1569. Downside targets rest at the 2016 yearly opening level from 1.0873 followed by channel support, taken from the low 1.1109. Further supporting sellers is the primary trend, down since topping in early 2018, at 1.2555.
Daily trend line support-turned resistance, taken from the low 1.0879, and the 50-day SMA (blue – 1.1094) held price action lower Monday. This followed a two-day advance north of support coming in at 1.0990. Beyond current resistance, traders’ crosshairs are perhaps fixed on the 200-day SMA (orange – 1.1126) and Quasimodo resistance at 1.1199.
Across the page on the H4 timeframe, the candles missed 1.11/channel resistance (1.1239) by a whisker, before turning sharply lower and testing support at 1.1055. Note also the 1.1100 region represented a Quasimodo resistance level (black arrow) and was a noted reversal zone to watch in Monday’s technical briefing (italics):
The 1.11 handle, the H4 channel resistance and the Quasimodo resistance level at 1.1100 represents an appealing location for sellers today/this week. Couple this with the current daily trend line resistance and 50-day SMA, and we have ourselves a robust reversal zone.
Well done to any readers who managed to short the daily/H4 combination.
Areas of consideration:
Daily selling from the trend line resistance/50-day SMA combination is likely to weigh on this pair further today, perhaps overthrowing the current H4 support at 1.1055. A H4 close south of 1.1055 will unlock bearish themes to December’s opening level at 1.1023, the key figure 1.10 and Quasimodo support at 1.0992. Aggressive sells may be viewed on the breakout candle’s close, with stop-loss orders positioned accordingly. Conservative traders, on the other hand, may opt to wait and see if a retest at 1.1055 forms before pulling the trigger (entry/risk can be determined according to the rejection candle’s structure).
GBP/USD:
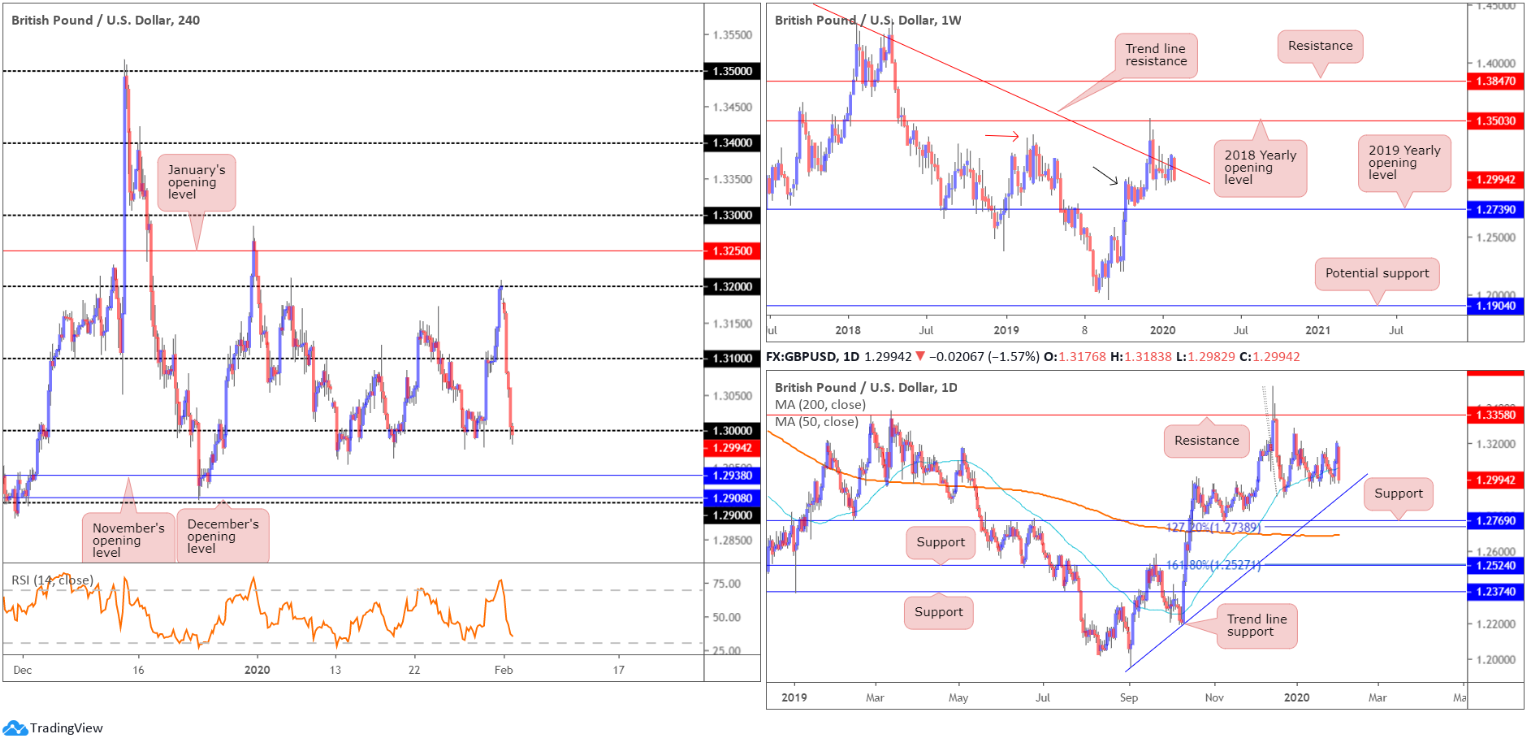
The British pound, a clear laggard in the G10 space, fell more than 200 points Monday. Opening downside was influenced on the back of weekend reports that UK Prime Minister Boris Johnson is planning to take a hard stance regarding post-Brexit negotiation. This – coupled with sell-stop liquidity and an upbeat US ISM Manufacturing PMI print – recently saw the H4 candles flirting the key figure 1.30. Beyond this psychological threshold, November’s opening level at 1.2938 is in sight, as is December’s opening level at 1.2908 and 1.29.
Further afield, weekly movement trades back beneath long-standing trend line resistance, pencilled in from the high 1.5930. Though before sellers can gain additional traction, demand is in view around the 1.2939 region (black arrow), likely seduced by the break of the notable high at 1.3380 (red arrow).
A closer reading of price action on the daily timeframe, traders can see the unit overthrew its 50-day SMA (blue – 1.3061) to the downside, potentially exposing nearby trend line support, extended from the low 1.1958. Beneath the said trend line, support is found at 1.2769, along with the 127.2% Fibonacci extension 1.2738 and the 200-day SMA (orange – 1.2691).
Areas of consideration:
Continued selling south of 1.30 is a possible scenario this week, targeting November’s opening level at 1.2938 as the initial port of call. This is not simply a case of a round number being broken and trading the breakout. We also have higher-timeframe (directional) convergence: weekly timeframe trading beneath trend line resistance and exhibiting scope to the downside, and daily price eyeing trend line support around November’s opening level on the H4.
Selling on any H4 close beneath 1.30 is an option, though waiting and seeing if a retest at 1.30 forms may prove the more conservative approach, helping to avoid any whipsaws that commonly occur around psychological numbers.
AUD/USD:
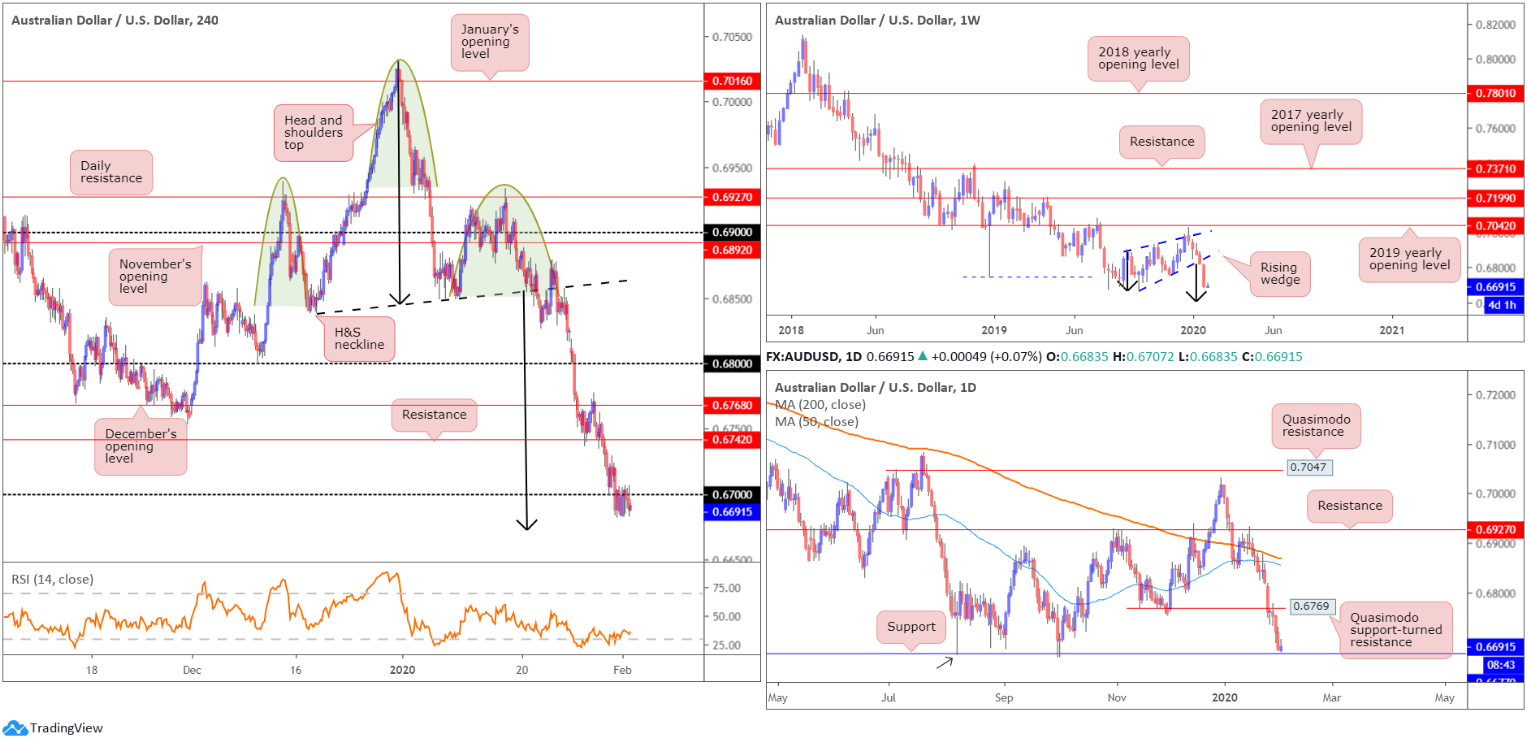
It was a relatively tame session for AUD/USD Monday, concluding unmoved. The pair relinquished more than 130 points the week before, weighed on by concerns surrounding the coronavirus and its impact on the global economy.
The weekly timeframe had the following to report in Monday’s technical briefing:
Since registering a bottom in late September at 0.6670 (2019), price carved out a rising wedge formation, typically considered a continuation pattern within a trending environment.
The past five weeks witnessed price decline back into the rising wedge and, thanks to recent selling, break and extend beyond the lower edge. With the primary downtrend having been in full force since topping at 0.8135, in early 2018, moves lower should have always been a possibility.
Assuming a break of the 0.6670 September 30th low, the rising wedge take-profit (black arrows – calculated by taking the height of the base and adding it the breakout point) is seen at 0.6614, followed by support at 0.6359 (not visible on the screen).
And on the daily timeframe, also a repeat from Monday’s report:
Price action settled a few points north of support from 0.6677, after respecting Quasimodo support-turned resistance at 0.6769 last Wednesday. Note also that the current support level denotes a Quasimodo support base (black arrow).
The next support target beyond 0.6677 falls in around 0.6508 (not visible on the screen).
As evident from the H4 timeframe, the candles continue to draw resistance from the underside of 0.67, forming a narrow range between 0.6707/0.6683.
Traders who remain short the H&S pattern from around 0.6850ish have the take-profit target lurking just south of current price at around 0.6671ish (calculation from the head to neckline added to the breakout point – black arrows).
Areas of consideration:
With 0.67 cleared, price is within touching distance of 0.6671, the H&S take-profit zone. This is likely close enough for most traders to consider covering short positions.
Chart studies, however, suggest leaving a portion of the position running, as weekly price proposes we may dethrone the current daily support around 0.6677 and head for the weekly timeframe’s rising wedge take-profit level at 0.6614. Therefore, shorting the retest at 0.67 is certainly a scenario worthy of consideration today.
USD/JPY:
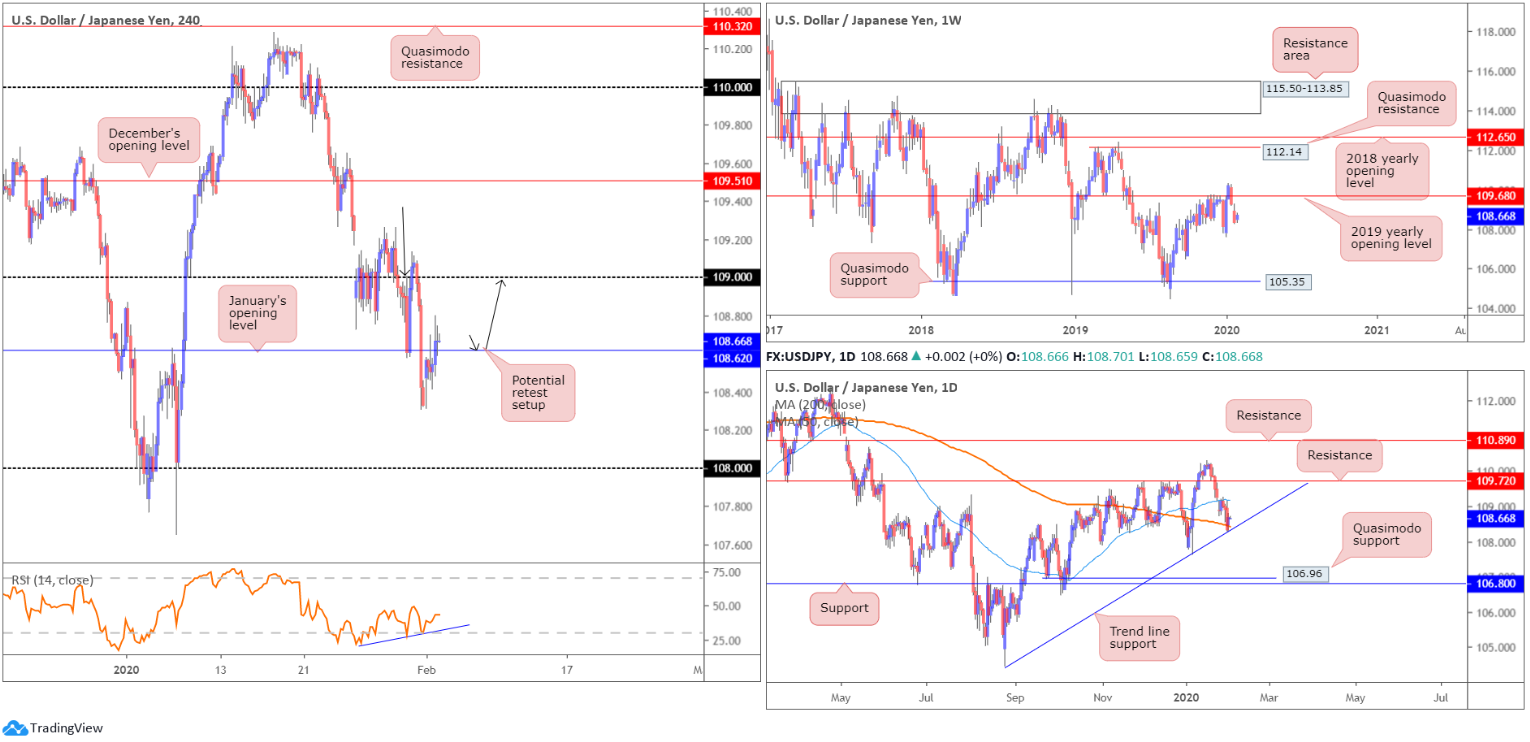
Snapping a three-week losing streak, USD/JPY shuffled higher Monday, lifted on the back of broad-based USD bidding, an overall solid US ISM Manufacturing PMI reading and recovering risk sentiment.
H4 price overwhelmed January’s opening level at 108.62 to the upside, touching highs of 108.79. This perhaps unlocks the door for an approach to 109 today, also representing a Quasimodo resistance, denoted by a black arrow. Retaking 108.62, on the other hand, exposes Friday’s low at 108.31, closely shadowed by the 108 handle. Interestingly, the relative strength index (RSI) is producing bullish divergence (blue line).
Meanwhile, movement on the daily timeframe trades off the 200-day SMA (orange – 108.42), supported by a familiar nearby trend line formation, extended from the low 105.59. Aside from the 107.65 January 8th low, support beneath the current trend line can be seen around a Quasimodo formation at 106.96, closely followed by another layer of support at 106.80. To the upside the 50-day SMA (blue – 109.18) resides close by, accompanied by resistance plotted nearby at 109.72.
Further out, price action on the weekly timeframe recently eclipsed the 2019 yearly opening level at 109.68, testing highs at 110.29, before pulling lower. As of current price, longer-term flow appears set to tackle the 107.65 January 6th low this week. Beneath the aforementioned low, limited support is evident until reaching the Quasimodo formation coming in at 105.35.
Areas of consideration:
Intraday, a retest at 108.62 may be in the offing today, with a target objective plotted at 109 and the 50-day SMA trailing just north at 109.18. A move higher is further supported by daily structure: the 200-day SMA and neighbouring trend line support.
In order to ensure reasonable risk/reward and potentially a better entry, traders are urged to consider drilling down to the lower timeframes and searching for a setup off local structure. This could be a simple M30 hammer candlestick pattern, or a more complex M5 AB=CD bullish configuration. It’s trader dependent.
The accuracy, completeness and timeliness of the information contained on this site cannot be guaranteed. IC Markets does not warranty, guarantee or make any representations, or assume any liability regarding financial results based on the use of the information in the site.
News, views, opinions, recommendations and other information obtained from sources outside of www.icmarkets.com.au, used in this site are believed to be reliable, but we cannot guarantee their accuracy or completeness. All such information is subject to change at any time without notice. IC Markets assumes no responsibility for the content of any linked site.
The fact that such links may exist does not indicate approval or endorsement of any material contained on any linked site. IC Markets is not liable for any harm caused by the transmission, through accessing the services or information on this site, of a computer virus, or other computer code or programming device that might be used to access, delete, damage, disable, disrupt or otherwise impede in any manner, the operation of the site or of any user’s software, hardware, data or property.


