
Key risk events today:
Australia Trade Balance; RBA Cash Rate and Rate Statement; New Zealand Employment Change q/q and Unemployment Rate.
(Previous analysis as well as outside sources – italics).
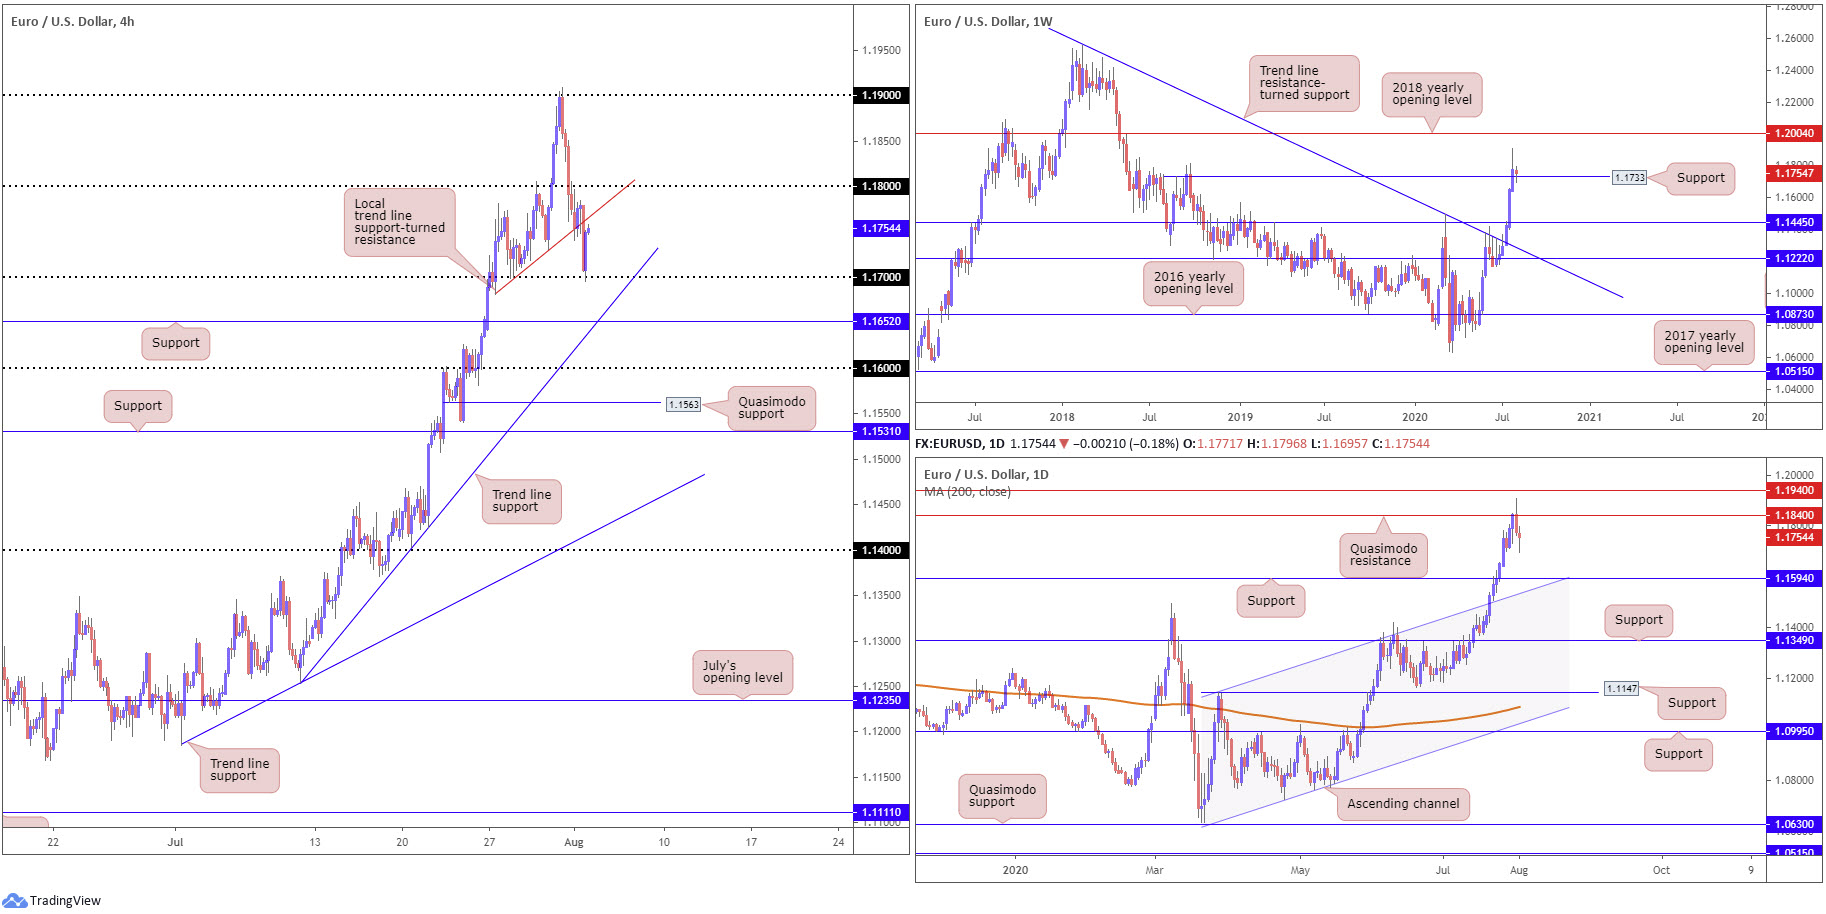
EUR/USD:
The US dollar index kicked off the week on strong footing, eclipsing last Wednesday’s high at 93.80. Price, however, came within striking distance of the 94.00 handle and Tuesday’s high at 94.01, before rotating to 93.60ish levels into US hours.
EUR/USD, based on the H4 timeframe, removed trend line support, taken from the low 1.1681 and witnessed price action come head to head with the 1.17 handle which, as you can see, held enough fuel to lift the currency pair higher into the European close. The recently engulfed trend line could serve as temporary resistance going forward, yet 1.18 is also a viable resistance. South of 1.17, traders likely eye support at 1.1652 and trend line support, taken from the low 1.1254.
Further out, weekly flow is readjusting following a sixth consecutive weekly gain, and recently retesting 1.1733 as support (prior Quasimodo resistance). This could perhaps fuel interest towards the 2018 yearly opening level at 1.2004.
Quasimodo resistance at 1.1840 on the daily timeframe remains in view. Moves lower has support as far south as 1.1594 in sight, stationed nearby channel resistance-turned support, extended from the high 1.1147. Renewed interest to the upside, nonetheless, could eventually bring light to resistance priced in at 1.1940.
Areas of consideration:
The break of weekly trend line resistance (July 13), taken from the high 1.2555, and violation of the 1.1495 March 9 high, reflects a long-term (potential) technical trend change.
Weekly trend structure points to additional bullish sentiment and is currently retesting 1.1733 support, potentially providing fresh impetus to buyers off 1.17 (H4). Taking out H4 trend line resistance and cutting through 1.18 swings daily resistance at 1.1840 back into the frame, leaving intraday buyers scope to manoeuvre north of 1.18.
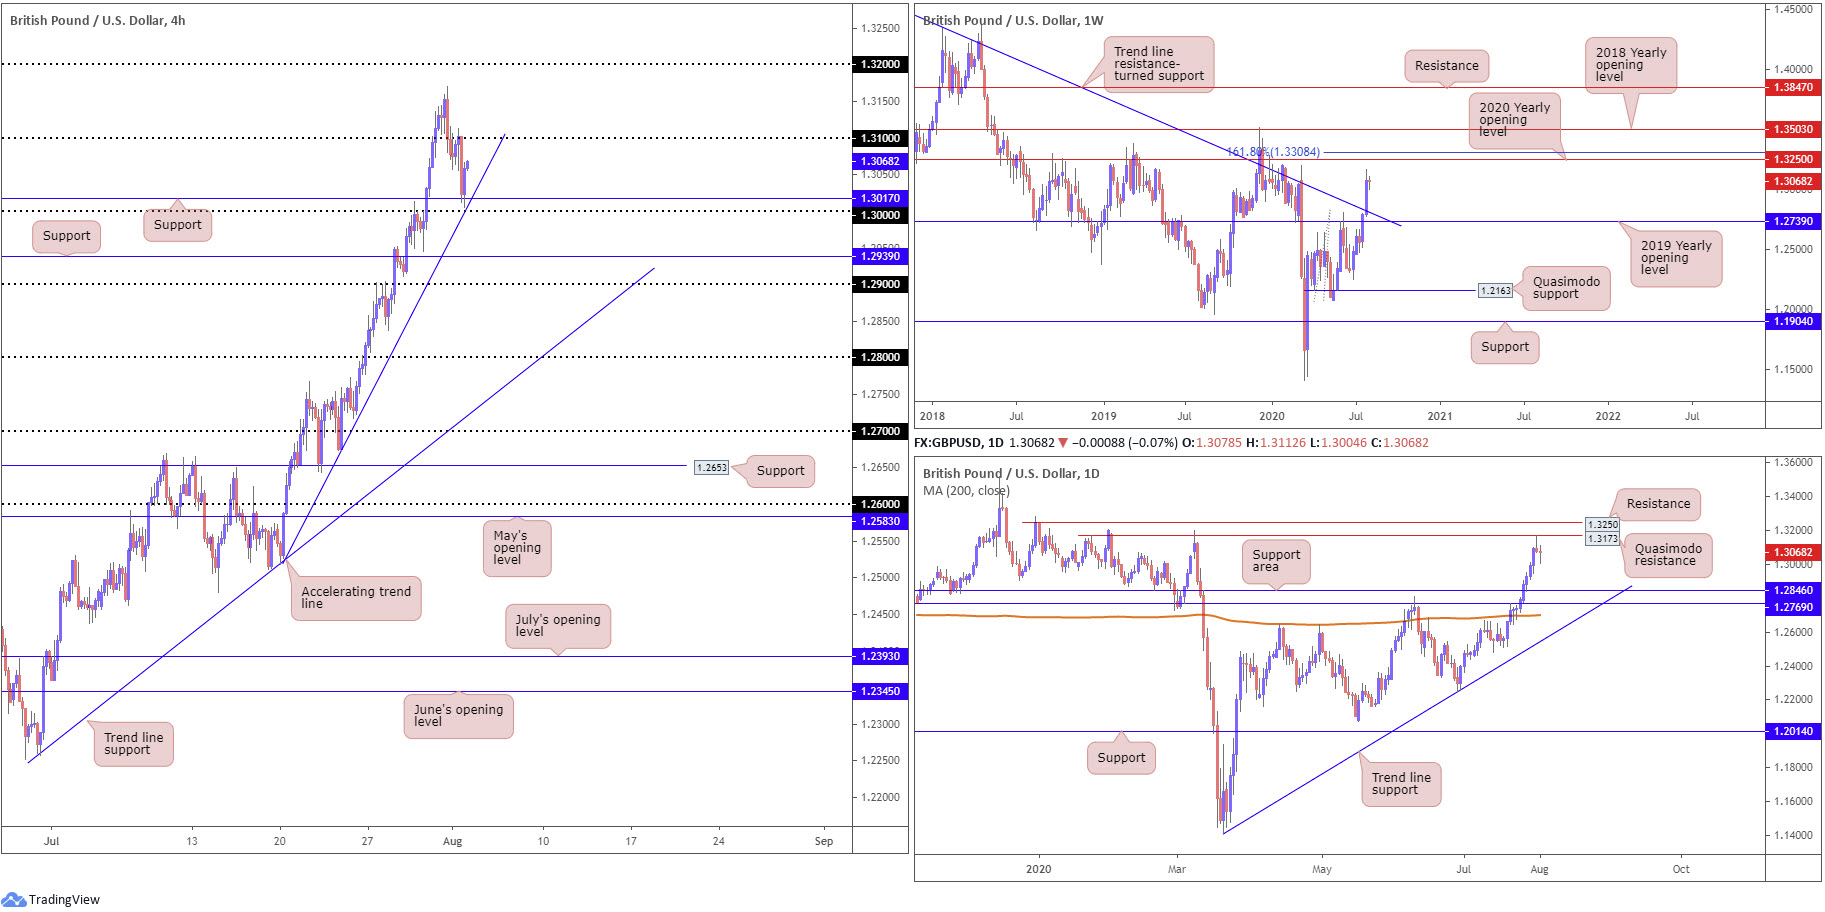
GBP/USD:
For technicians who read Monday’s weekly briefing you may recall the following piece (italics):
Removing 1.31 into the (weekly) close puts forth intraday bearish scenarios back to the 1.30ish base early week, in line with the daily shooting star candlestick pattern.
In traditional technical fashion, H4 retested the underside of 1.31 Monday, formed a half-hearted hanging man candlestick pattern, and dipped southbound to support coming in at 1.3017, a level positioned nearby a steep trend line support, extended from the low 1.2518 and the key figure 1.30. The aforementioned technical combination has so far withstood selling pressure and lifted price modestly higher and recouped most of the earlier losses.
Weekly flow, after engulfing long-term trend line resistance, extended from the high 1.5930, and adding more than 280 pips last week, could invite the 2020 yearly opening level at 1.3250 into the frame. Technical readers will also acknowledge additional resistance by way of a 161.8% Fibonacci extension point at 1.3308.
Quasimodo resistance at 1.3173 remains in play on the daily timeframe, with a break here exposing resistance parked at 1.3250. Support, on the other hand, can be found between 1.2846 and 1.2769, followed by the 200-day SMA (orange – 1.2700).
Areas of consideration:
The recent trend line resistance break on the weekly timeframe, despite the 1.3514 December 9 high (2019) still intact (a break of here also signals trend change to the upside), may have long-term traders consider bullish positions.
The reaction from H4 support at 1.3017 (and nearby 1.30 base/trend line support) may eventually draw price action to 1.31, in light of weekly price showing room to the 2020 yearly opening level at 1.3250. However, before reaching this far north, buyers must not only contend with 1.31, but also daily Quasimodo resistance at 1.3173.
On account of the above, current buyers may seek additional long positions above 1.31 (and at the same time entice fresh buying).
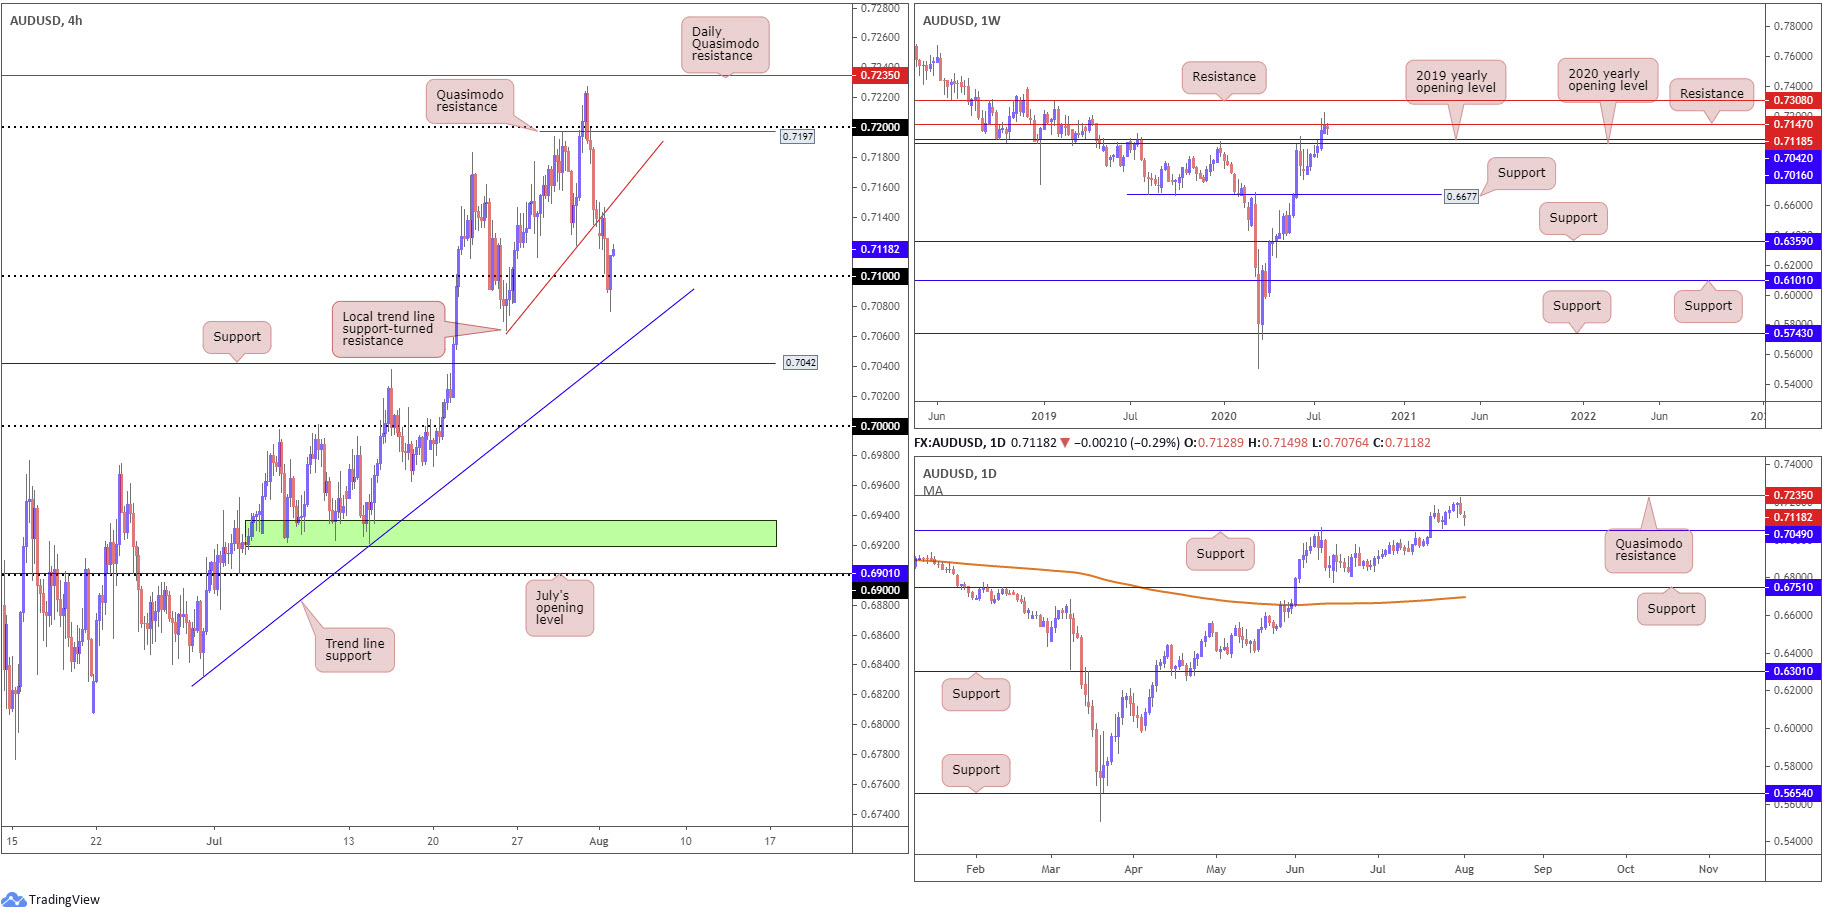
AUD/USD:
Kicking under local H4 trend line support, drawn from the low 0.7063, in early hours Monday led to a swift retest of the latter as resistance, followed by the resumption of selling to the 0.71 neighbourhood. Despite the immediate trend facing northbound, the break of the aforementioned trend line was likely fuelled (technically) on the back of buyers and sellers battling for position from resistance on the weekly timeframe at 0.7147, as well as daily price showing room to push towards support at 0.7049 following Friday’s near-test of Quasimodo resistance at 0.7235.
Although a modest wave of buying is currently in motion off 0.71, H4 traders are urged to pencil in the possibility of a break lower to draw in trend line support, etched from the low 0.6832, followed by support at 0.7042 (prior Quasimodo resistance).
Areas of consideration:
Sinking through 0.71 is a possible scenario today, targeting H4 trend line support (0.6832), followed by daily support at 0.7049 and H4 support at 0.7042. Note the latter actually lines up with the 2019 yearly opening level, based on the weekly timeframe, therefore not only is 0.7042 a logical take-profit target, it is also a considerable support to keep eyeballs on.
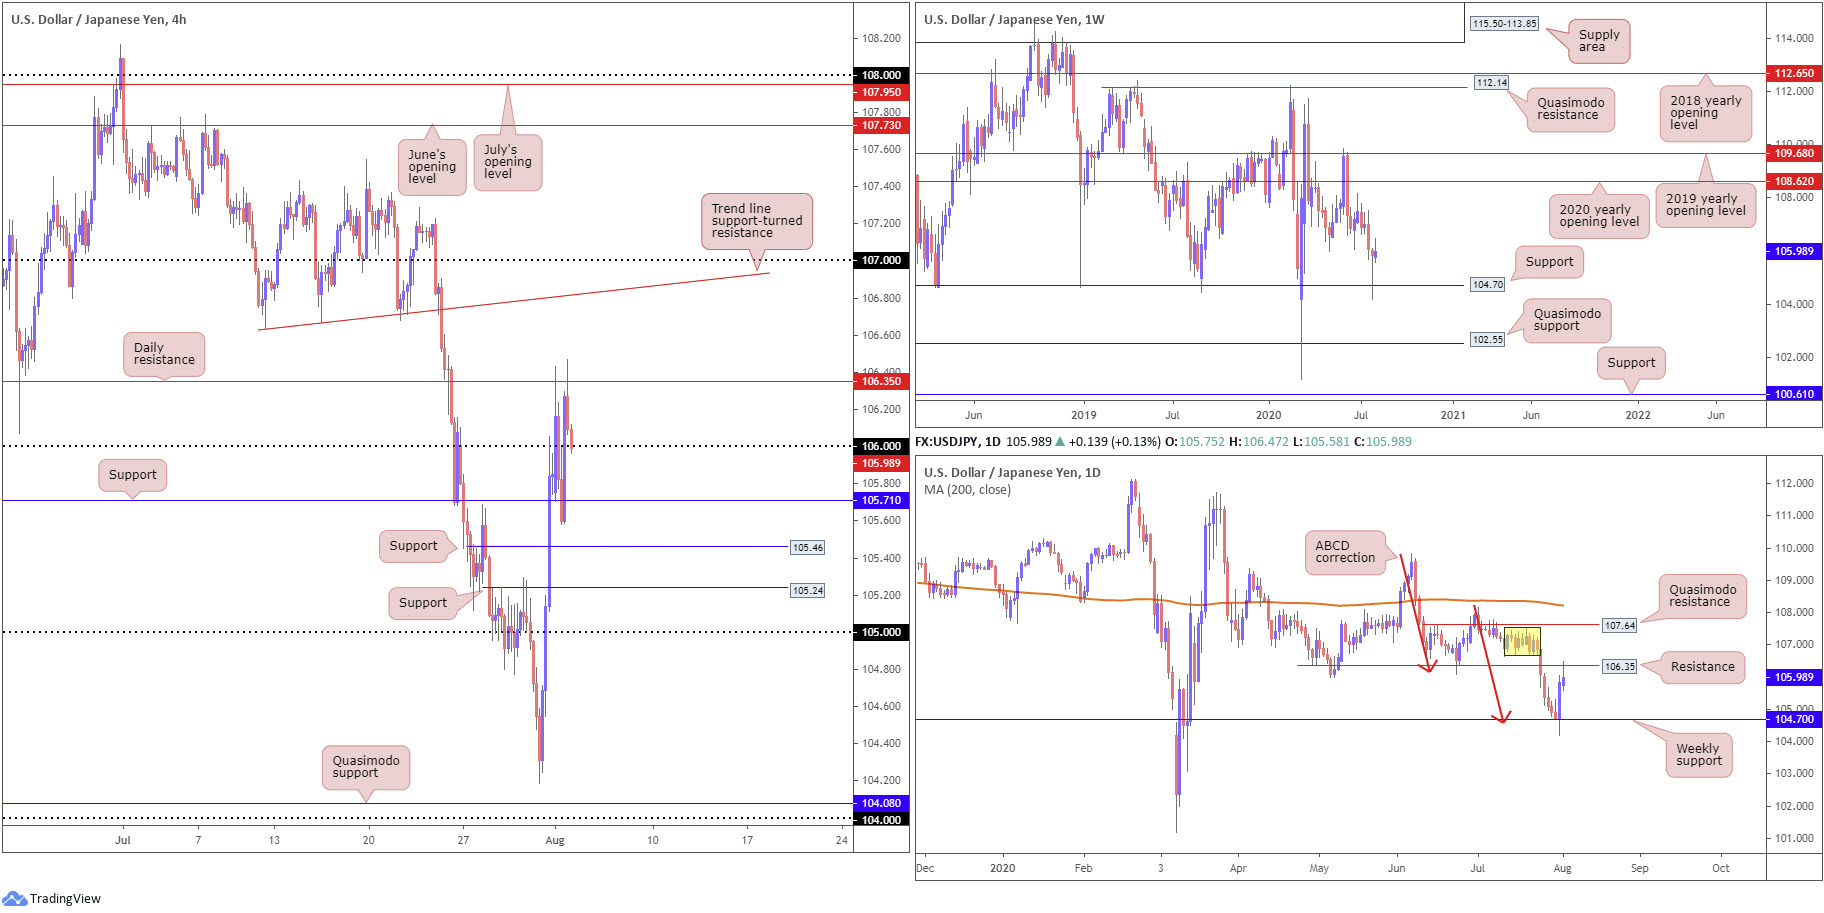
USD/JPY:
The US dollar finished off best levels against the Japanese yen Monday, fading daily resistance at 106.35.
From the weekly timeframe, the technical picture pencilled in a striking hammer pattern last week, which is generally considered a bullish signal at troughs, off support at 104.70. Noticeable upside targets on this timeframe rest at the 2020 yearly opening level from 108.62, with a break unmasking the 2019 yearly opening level at 109.68.
While weekly traders, particularly candlestick enthusiasts, may cheer the possibility of further upside, daily technical action (after rebounding from weekly support accompanied by a daily ABCD correction [red arrows]) is, as briefly touched on above, shaking hands with resistance at 106.35. North of 106.35, supply rests at 107.54/106.67 (yellow), followed by daily Quasimodo resistance at 107.64 and then the 200-day SMA (orange – 108.22).
Across the page on the H4 timeframe, the 106 handle was mostly overlooked in recent trading, despite Friday’s modest rejection. Closing back under 106 off 106.35 (daily resistance) may prompt intraday bearish scenarios to support at 105.71. Trend line support-turned resistance, taken from the low 106.36, nevertheless, stands as the next available resistance target north of 106.35 on the H4 timeframe, followed by 107.
Areas of consideration:
Governed by the weekly timeframe rebounding from support at 104.70 and forming a bullish candlestick signal, longer-term analysis suggests the possibility of fracturing lower timeframe resistances.
106.35 on the daily timeframe, however, is proving tenacious structure and could, despite higher timeframes often taking precedence over the lower timeframes, deter buying until the aforementioned level is cleared. Those with confidence in the weekly timeframe’s position, nonetheless, may attempt to establish bullish strategies off 106 in early trading today, in hope of a 106.35 breach.
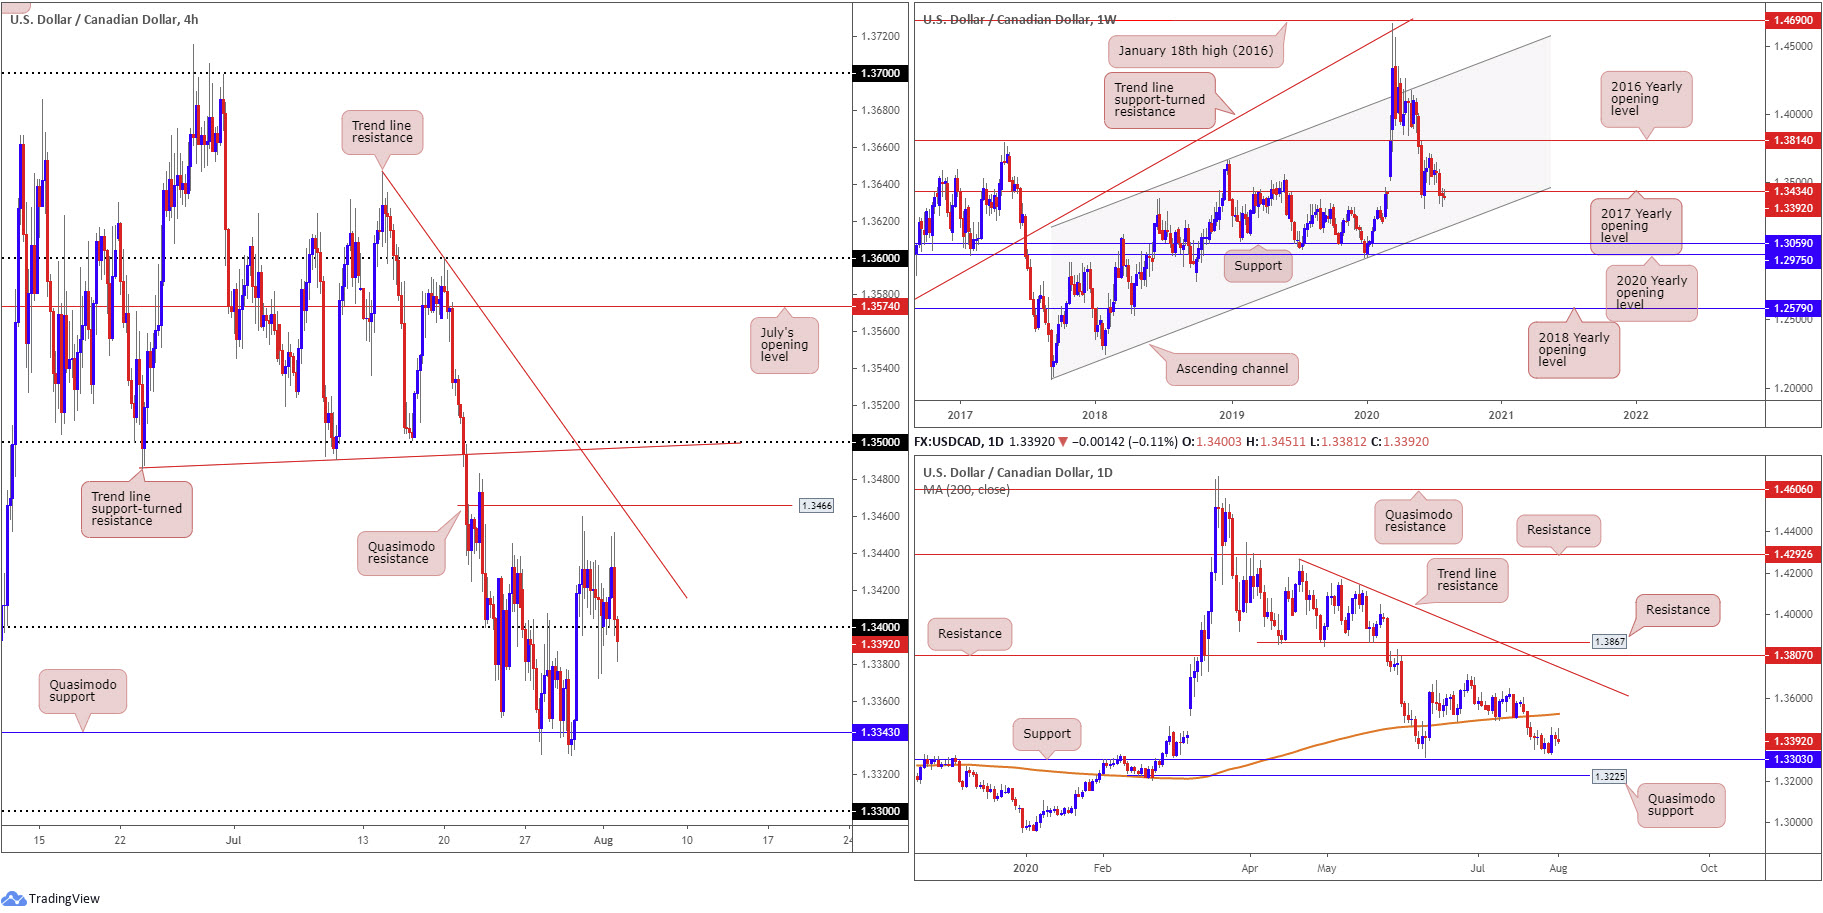
USD/CAD:
Despite an earnest attempt to hold north of the 1.34 handle Monday, buyers were unable to muster enough strength to overthrow weekly resistance, shaped in the form of the 2017 yearly opening level at 1.3434. Technicians will also acknowledge the weekly level is located just south of a H4 trend line resistance, taken from the high 1.3646, and Quasimodo resistance coming in at 1.3466. The session, as you can see, concluded sub 1.34, reigniting the prospect of a 1.3343 test (Quasimodo support) today.
From the weekly timeframe, the 2017 yearly opening level at 1.3434 represents resistance. Below 1.3434, channel support, taken from the low 1.2061, can be viewed as the next potential floor, indicating bearish themes could be on the cards. A break to the upside, on the other hand, could eventually throw the 2016 yearly opening level at 1.3814 back into the pot.
In terms of where we’re positioned on the daily timeframe, support can be found at 1.3303 and resistance in the shape of the 200-day SMA (orange – 1.3523). Should we follow sentiment on the weekly timeframe and navigate deeper waters, a break of 1.3303 could be seen, eyeing Quasimodo support at 1.3225 as the next possible base.
Areas of consideration:
The longer-term technical position shows sellers slowly growing in confidence, with daily price likely to take aim at support drawn from 1.3303. A decisive H4 close sub 1.34 would help confirm this and perhaps pull in fresh sellers, targeting H4 Quasimodo support at 1.3343, followed by the 1.33 handle, which conveniently aligns with daily support plotted at 1.3303. Therefore, not only is 1.33 a logical downside target for sellers to work with this week, the level could also form a platform for buyers to make an entrance from. However, do be aware a dip through the 1.33 region could emerge having noted weekly price perhaps wanting to grip channel support (currently circles the 1.32ish neighbourhood).
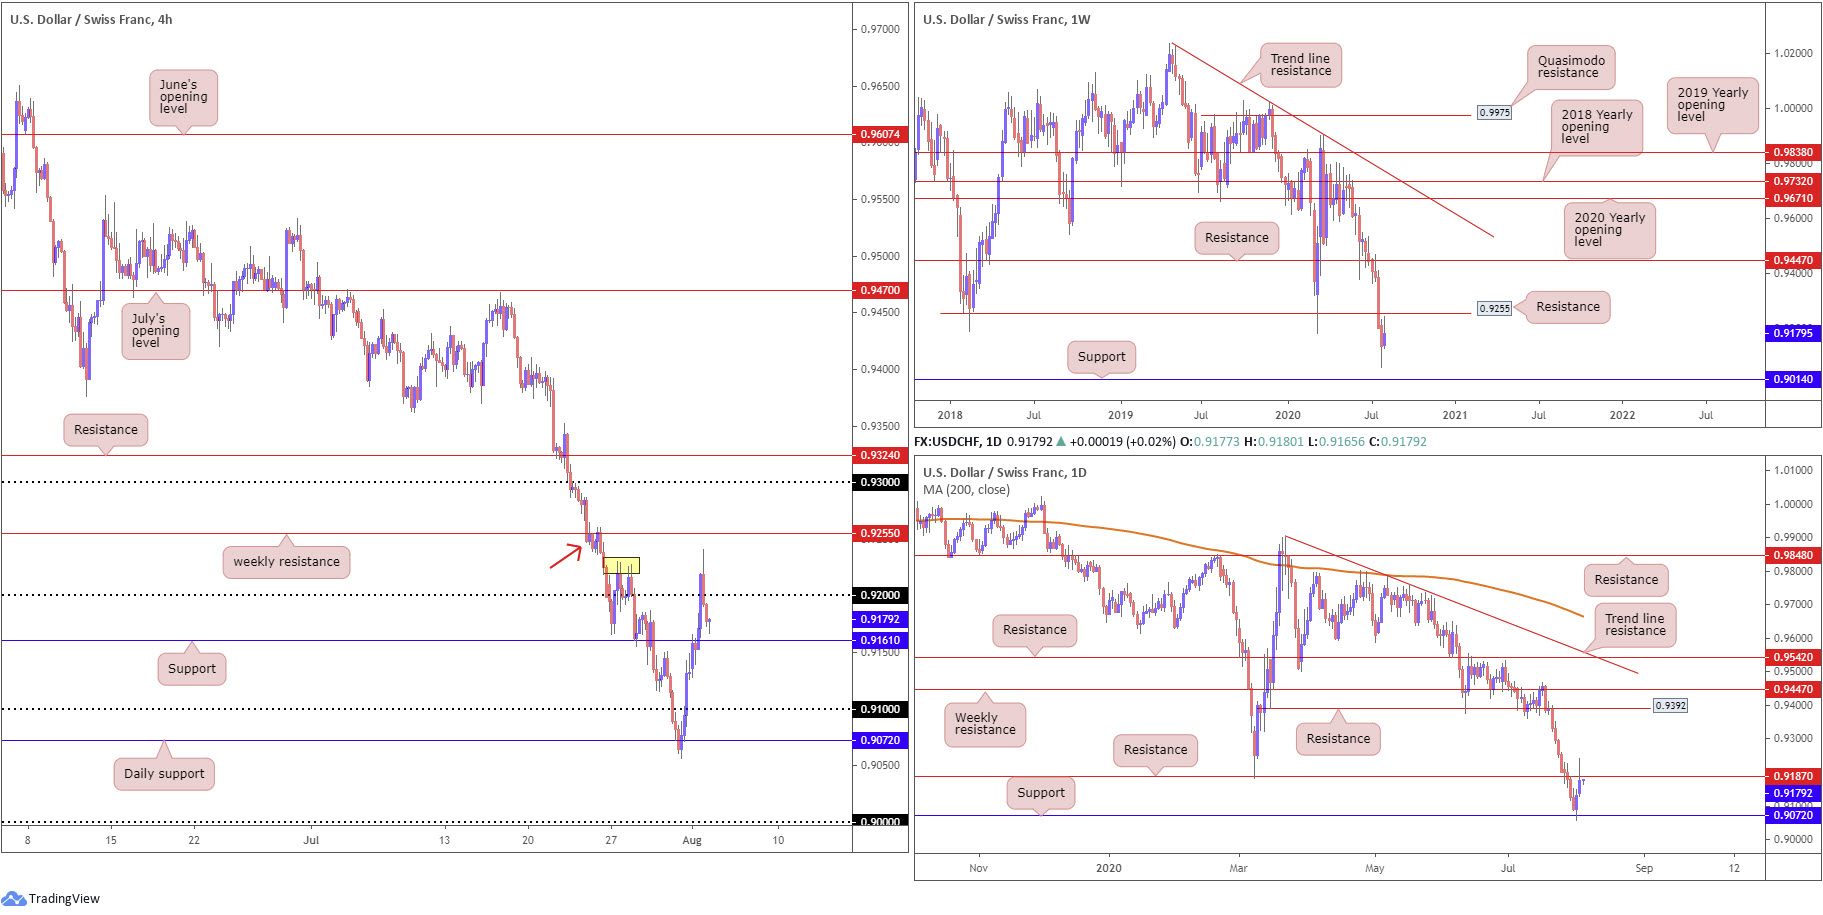
USD/CHF:
Although finishing off best levels, the US dollar modestly gained for a second consecutive session against the Swiss franc Monday, consequently extending recovery gains from multi-year lows.
Reinforced by the DXY attempting to regain 94.00 as well as rising US Treasury yields, weekly price came within striking distance of resistance at 0.9255, a previous Quasimodo support level. Traders on the weekly timeframe will also acknowledge support coming in from 0.9014.
The story on the daily timeframe reveals support at 0.9072 greeted price action Friday, with Monday chalking up follow-through buying to resistance at 0.9187. Brushing aside the latter could stimulate an approach to resistance drawn from 0.9392.
A closer reading of price action on the H4 timeframe reveals the candles whipsawed through 0.92 and also local tops around 0.9227 (yellow), testing a supply that formed (around 0.9260/0.9237) on the break of weekly support at 0.9255. Support at 0.9161 rests close by at 0.9161; a break lower could refocus the spotlight on the 0.91 handle, closely followed by daily support at 0.9072.
Areas of consideration:
Daily resistance holding at 0.9187, coupled with the current downtrend and near-test of weekly resistance at 0.9255, could direct USD/CHF to lower terrain today, taking out H4 support at 0.9161 and setting the stage for intraday bearish themes to at least 0.91.
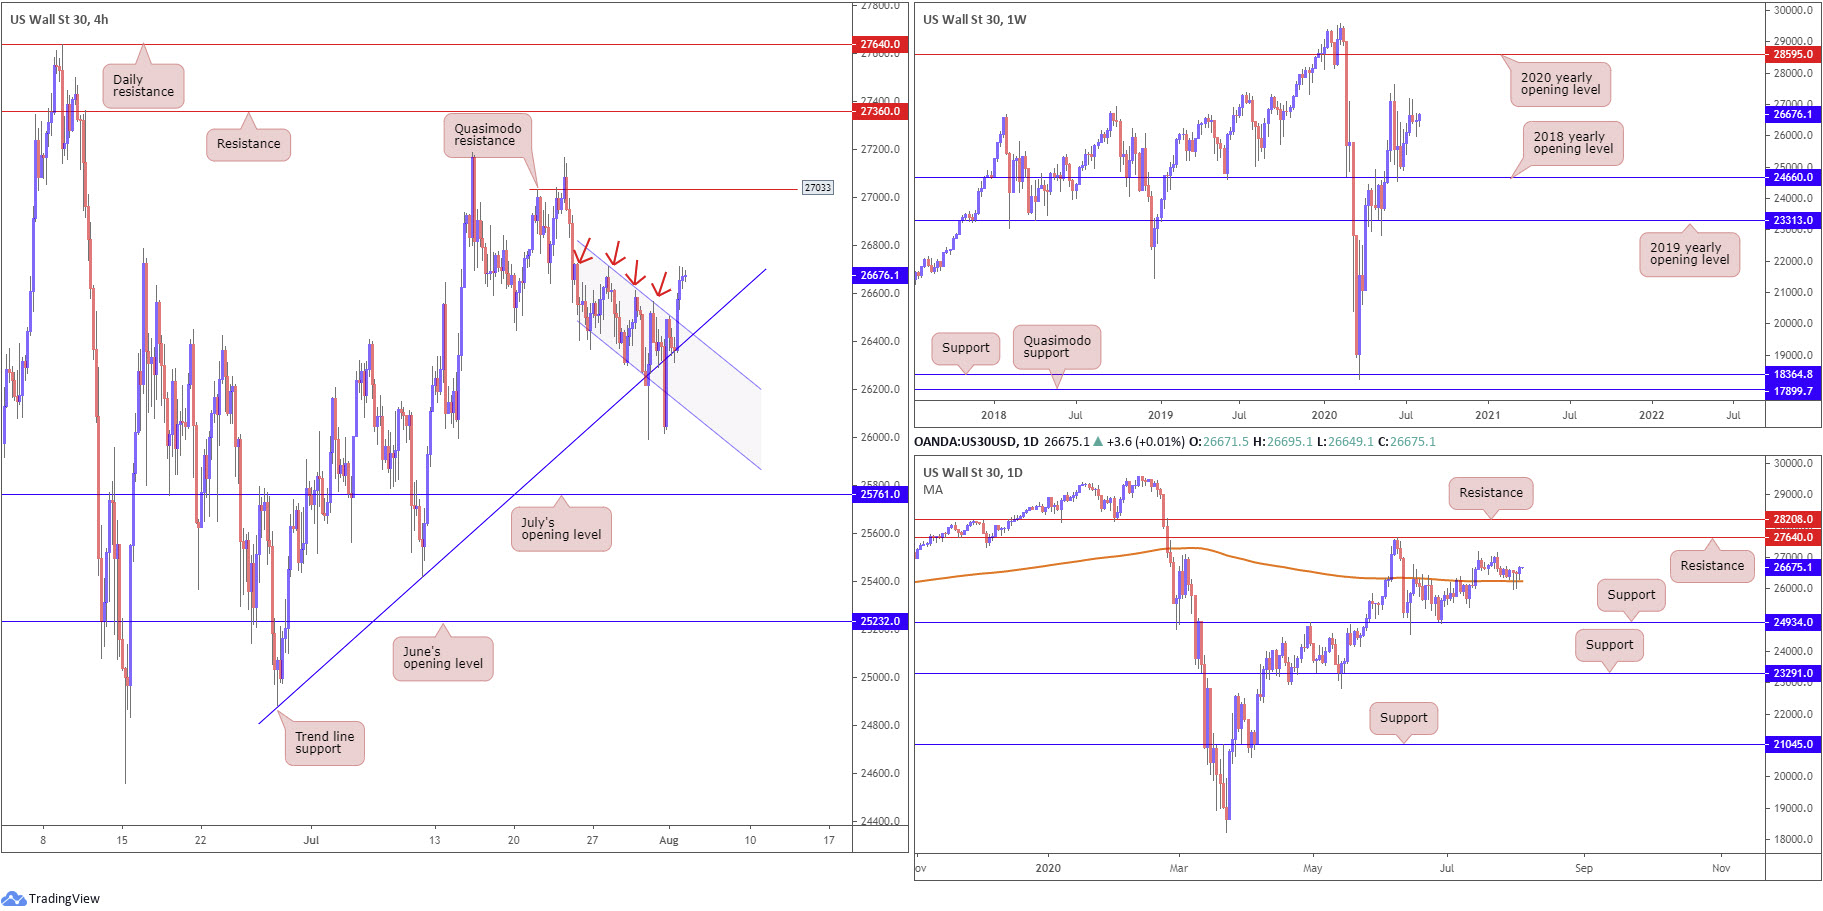
Dow Jones Industrial Average:
The first day of August witnessed US equities advance, led by a rally in tech stocks. The Dow Jones Industrial Average climbed 236.08 points, or 0.89%; the S&P 500 rallied 23.49 points, or 0.72%, and the tech-heavy Nasdaq 100 concluded higher by 149.19 points, or 1.37%.
From the weekly timeframe, after rebounding from the 2018 yearly opening level at 24660 mid-June, the technical landscape is likely to eventually pull in the 27638 high, followed by a plausible run to the 2020 yearly opening level at 28595.
In the form of two back-to-back hammer candlestick patterns, both of which retested the 200-day SMA (orange – 26243), along with Monday’s follow-through upside, price is seen making headway north of the said SMA. Technicians will also acknowledge 27640 denotes the next obvious upside target, stationed just under another slice of resistance parked at 28208.
H4 action ended Monday settling strongly above channel resistance, extended from the high 26712. Trend line support, extended from the low 24881, also remained in the frame despite sizeable intraday spike to lows nearby 26000. Eclipsing the upper limit of the aforementioned channel resistance signals a bullish market, at least until crossing swords with H4 Quasimodo resistance at 27033.
Areas of consideration:
All three timeframes point to the possibility of price swerving to the upside, particularly after taking on H4 channel resistance (26712). Above here, breakout buyers will likely eye H4 Quasimodo resistance fixed from 27033 as an initial upside target, given nearby technical H4 supply appears consumed (red arrows).
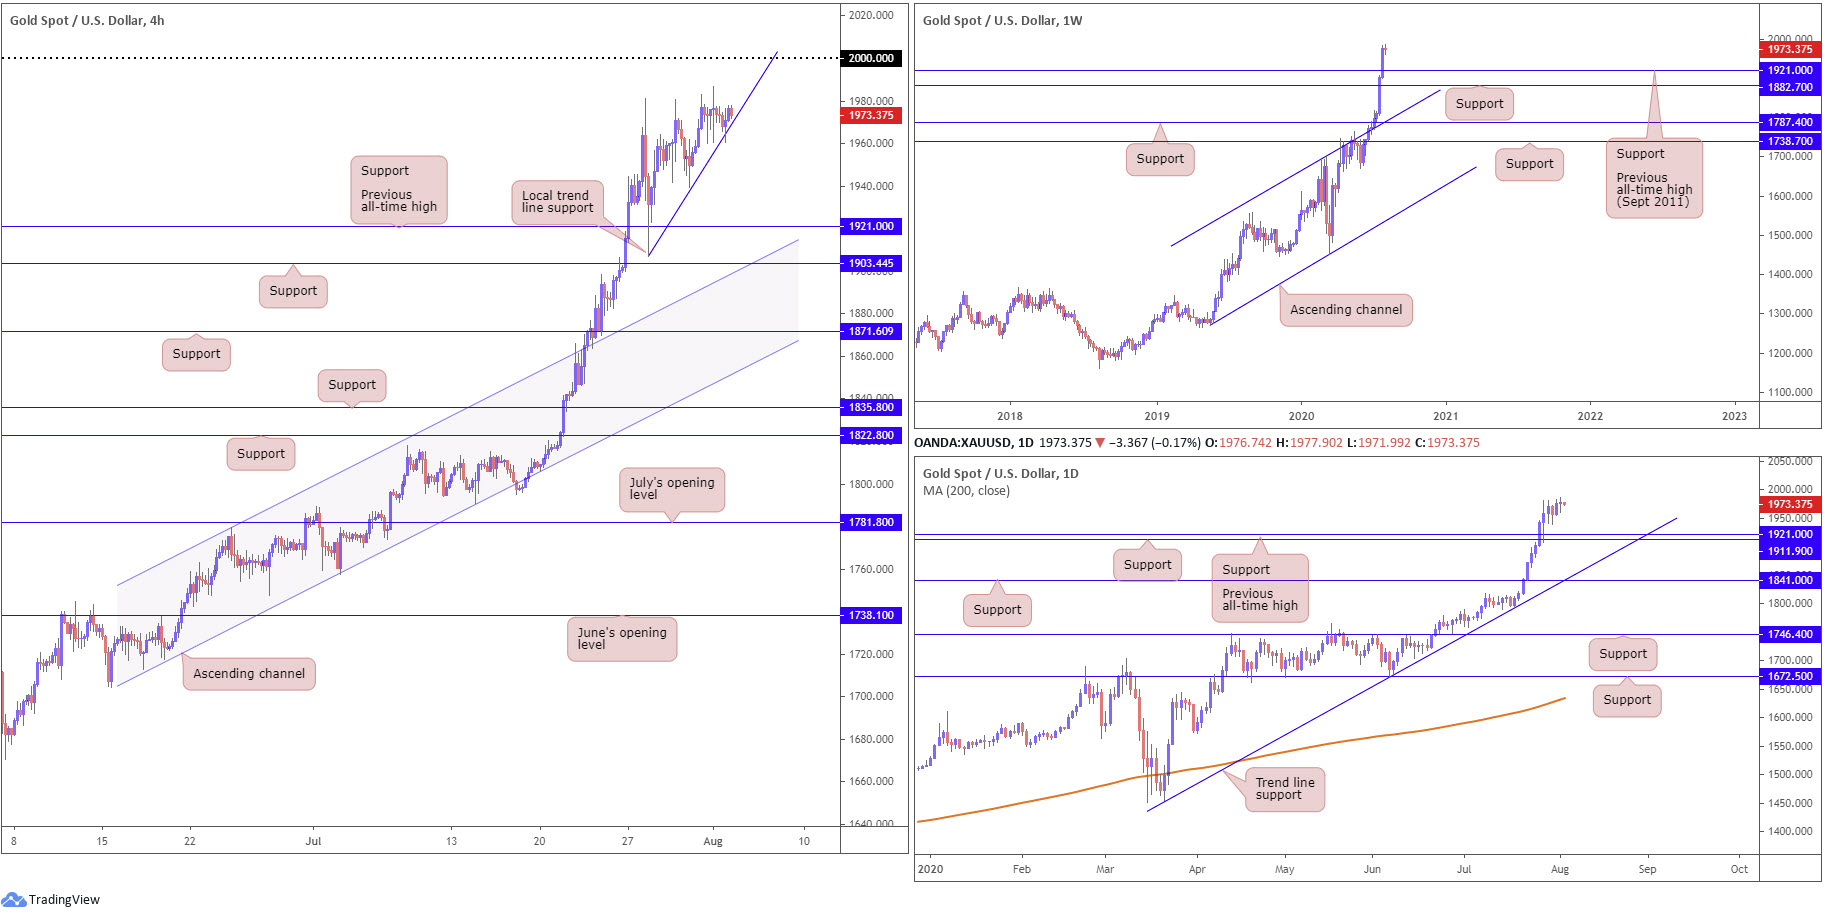
XAU/USD (GOLD):
It was a quiet start to the week for the yellow metal, concluding unchanged and forming a daily (fairly neutral) indecision candle. In light of Monday’s lacklustre performance, much of the following piece will echo thoughts put forward in the weekly technical briefing.
From the weekly timeframe:
XAU/USD bulls continue to reign supreme last week, adding more than $74 and stamping out fresh all-time peaks at 1983.1. With price navigating unchartered territory at the moment, this remains a buyers’ market. In the event a pullback occurs, traders will likely be watching 1921.0, the all-time peak formed in September 2011, as possible support.
Daily timeframe:
In similar fashion to the weekly timeframe, dips this week are likely to be welcomed at 1921.0, followed closely by support coming in at 1911.9.
H4 timeframe:
Recent action (after forming a fresh all-time peak at 1986.7) pulled in local trend line support, taken from the low 1907.0, and perhaps provided a base for traders to consider bullish strategies from. A break of the said trend line, however, pushes forward the possibility of a dip back to 1921.0.
The main upside target beyond the latter remains fixed at the widely watched 2000.0 base.
Areas of consideration:
Further buying remains likely in this market.
Responding from local H4 trend line support, in the shape of a notable H4 bullish candlestick signal, is likely sufficient to ignite bullish strategies, targeting 2000.0, while moves back to 1921.0 will likely also encourage dip-buying.
The accuracy, completeness and timeliness of the information contained on this site cannot be guaranteed. IC Markets does not warranty, guarantee or make any representations, or assume any liability regarding financial results based on the use of the information in the site.
News, views, opinions, recommendations and other information obtained from sources outside of www.icmarkets.com.au, used in this site are believed to be reliable, but we cannot guarantee their accuracy or completeness. All such information is subject to change at any time without notice. IC Markets assumes no responsibility for the content of any linked site.
The fact that such links may exist does not indicate approval or endorsement of any material contained on any linked site. IC Markets is not liable for any harm caused by the transmission, through accessing the services or information on this site, of a computer virus, or other computer code or programming device that might be used to access, delete, damage, disable, disrupt or otherwise impede in any manner, the operation of the site or of any user’s software, hardware, data or property.


