
Key risk events today:
Australia Retail Sales m/m and Current Account; Reserve Bank of Australia Cash Rate and Rate Statement; US ISM Manufacturing PMI; FOMC Member Rosengren Speaks.
EUR/USD:
The US dollar index, calculated by factoring in the exchange rates of six major world currencies, continued to realise higher ground Monday. Despite US banks closing in observance of Labour Day, the index clocked fresh YTD highs beyond the 99.00 handle.
EUR/USD movement left the key figure 1.10 unchallenged and charged lower amid European hours, extending Friday’s losses. After PMI data failed to provide much in the way of hope that Eurozone manufacturing might be about to rebound, seemingly upping the pressure on the ECB to act next week, the pair struck fresh 2-year lows at 1.0957.
The technical picture on the higher timeframes remains unchanged:
(Monday’s weekly report).
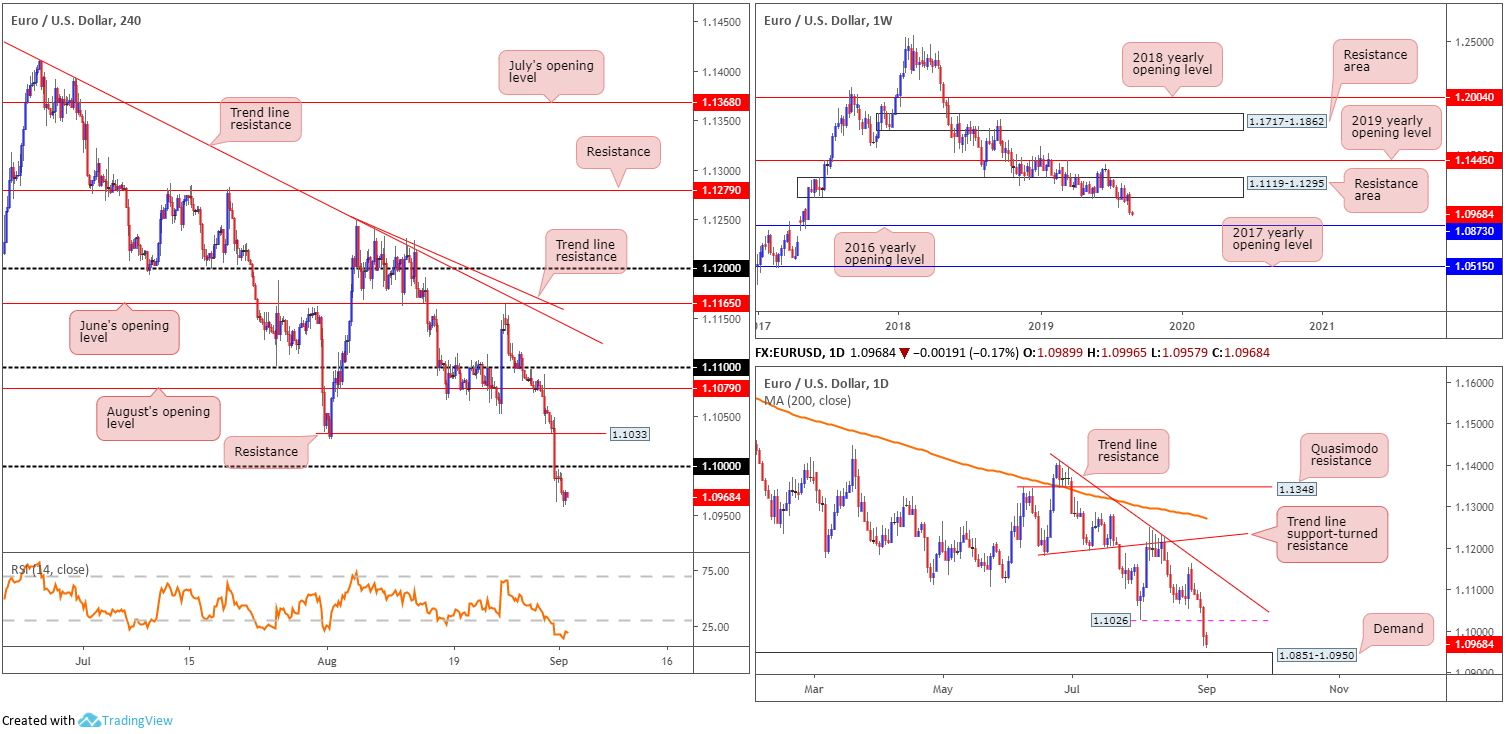
Long-standing demand at 1.1119-1.1295 finally gave way last week, hanging by a thread since the end of July. Continued selling could witness the unit knock on the 2016 yearly opening level’s door at 1.0873, which houses strong historical significance. Adding to the bearish vibe, since topping in early 2018, the long-term trend remains pointing in a southerly bearing.
Daily viewpoint:
Leaving the trend line resistance (extended from the high 1.1412) unopposed, the pair rotated south by way of five back-to-back bearish candles in recent trade, ending August on a dismal note.
Friday’s session overdelivered, drawing price action through YTD lows at 1.1026 to within striking distance of a demand zone coming in at 1.0851-1.0950 (taken from April 25, 2017). Note the said demand base also encompasses the 2016 yearly opening level mentioned above on the weekly timeframe at 1.0873.
The key observation on the H4 timeframe remains centred on price running orders at 1.10, likely triggering additional short positions. As highlighted in Monday’s briefing, with 1.10 now likely to serve as resistance going forward, further downside may be on the cards this week, targeting the top edge of daily demand at 1.0950, followed by the 2016 yearly opening level at 1.0873 on the weekly timeframe.
Areas of consideration:
Although the H4 candles have created some space beneath 1.10, a retest of this figure likely remains a key interest for sellers going forward. As such, the outlook modelled in Monday’s briefing still offers an effective approach:
A retest of this level (1.10) coupled with a H4 bearish candlestick formation would, given the current standing on both weekly and daily timeframes, likely be enough to draw in additional downside sentiment. The reason behind requiring candlestick confirmation simply comes down to round numbers, particularly key figures, being prone to whipsaws (stop runs). In addition to this, a bearish candlestick pattern forming at 1.10 provides strict entry and risk levels to work with.
GBP/USD:
The British pound fell sharply vs. the US dollar Monday as newswires cited Brexit concerns, alongside weaker-than-expected UK Manufacturing PMI data, which highlighted the impact Brexit is having on the economy.
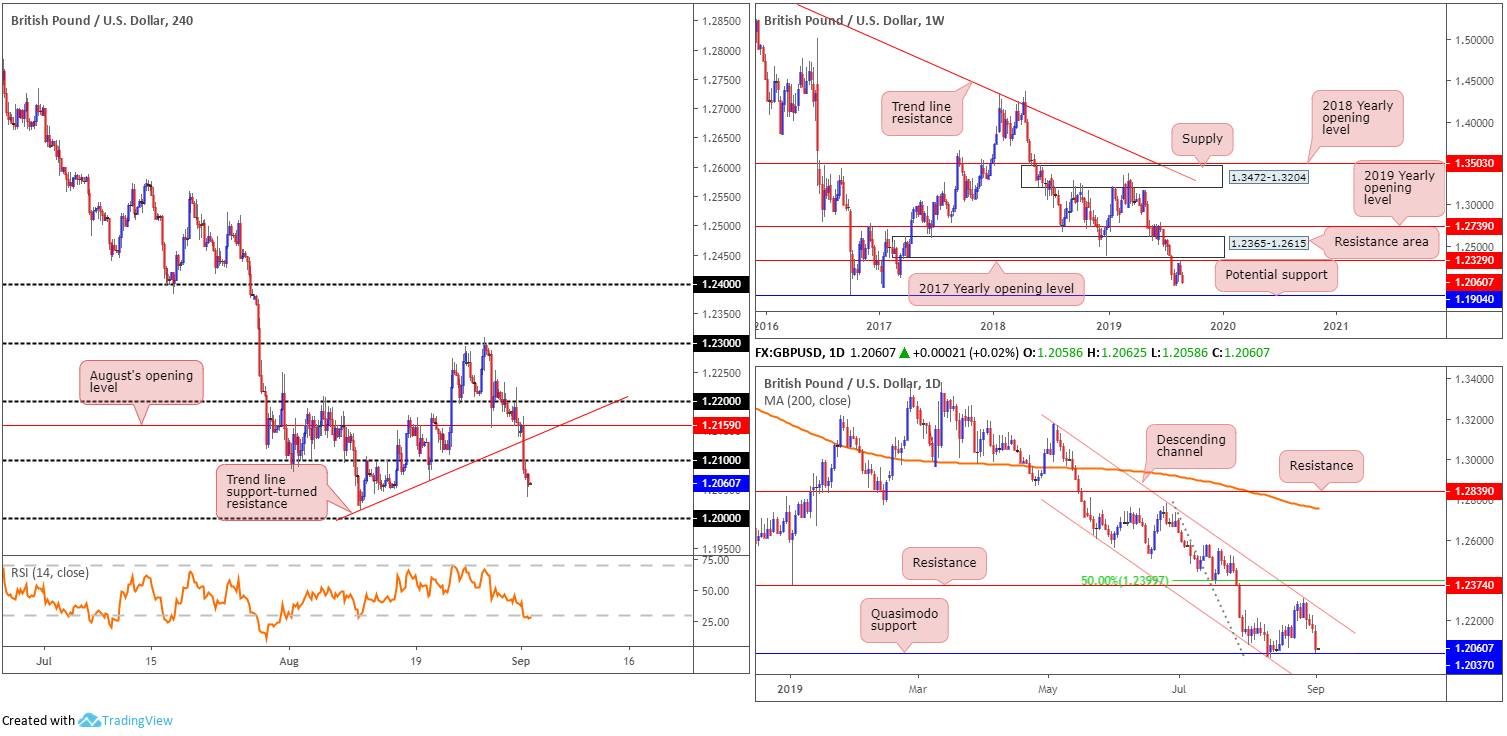
Down more than 0.70% on the day, H4 price overthrew trend line support and the 1.21 handle, with both now likely to offer resistance in the event of a market pullback. The next support target can be found at the key figure 1.20. Indicator-based traders may also wish to note the RSI indicator is entering oversold territory.
Following the pair’s close shave with the 2017 yearly opening level at 1.2329 (resistance) on the weekly timeframe last week, set a couple of points beneath a major resistance area at 1.2365-1.2615, price is seen extending losses. This seats the August 12 low at 1.2014 back in sight, closely shadowed by a potential support level coming in at 1.1904 – held price action strongly higher back in October 2016.
Contrary to weekly flow, however, daily action touched gloves with familiar support at 1.2037 yesterday, a Quasimodo formation. This may enthuse a bullish comeback that reconnects with channel resistance extended from the high 1.3176.
Areas of consideration:
Traders eyeing a retest at 1.21 today, despite having room to press lower on the weekly timeframe till 1.2014 (see above), may want to tread with caution. Daily players engaging with the Quasimodo formation at 1.2037 could yank prices above 1.21. A method to help overcome this for those interested in 1.21 as a selling point is wait for additional H4 candlestick confirmation, such as a shooting star pattern or a bearish outside day. That way, not only have you identified seller intent, you also have entry and risk levels to work with based on the candlestick structure.
AUD/USD:
Despite upbeat data out of China and the US dollar index clocking YTD highs above 99.00, the commodity-linked currency kicked off the week in pretty much the same manner it closed: subdued.
Monday’s report expressed the following in regards to the weekly timeframe:
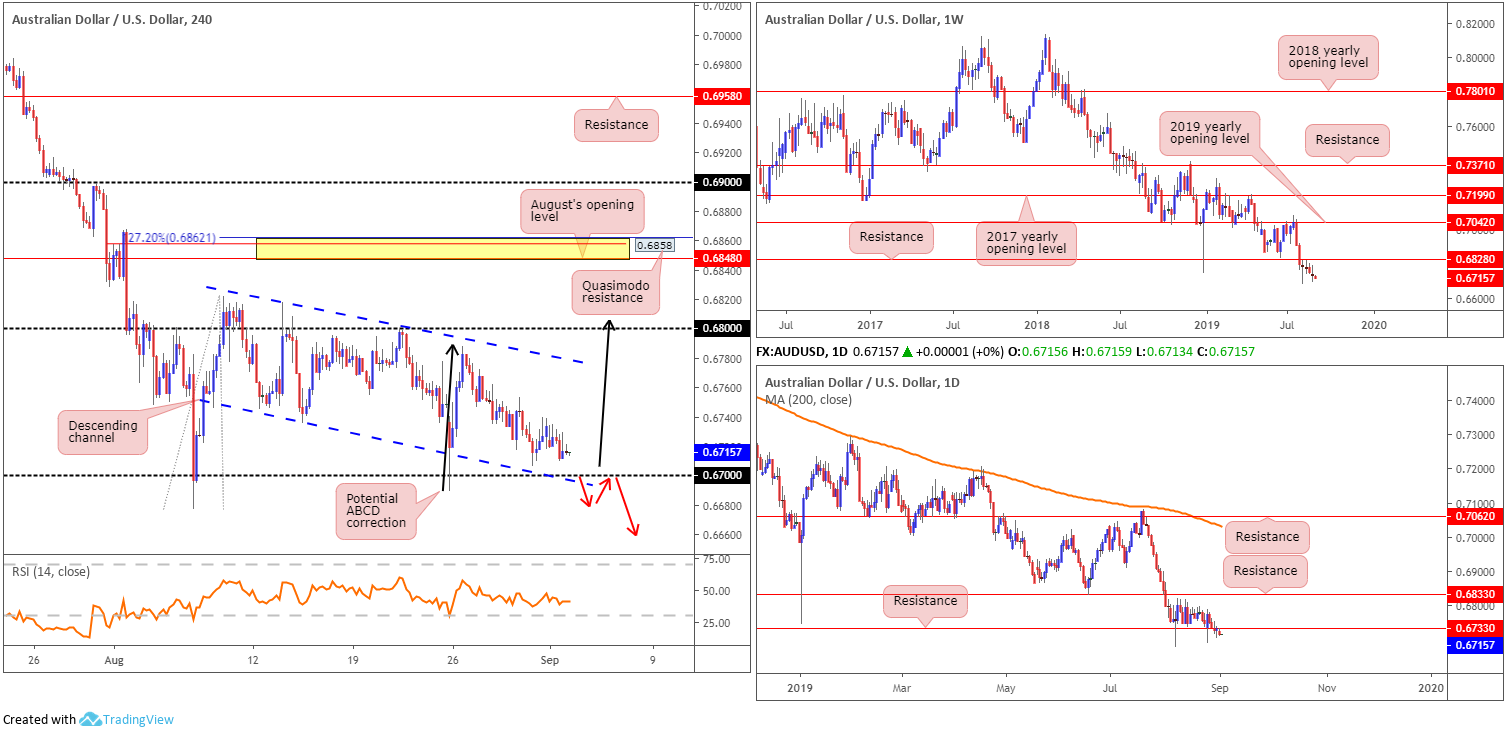
The end of July witnessed the unit slip beneath notable support at 0.6828, now a serving resistance. The following weeks have been somewhat colourless, though, largely organised as indecision candles. The long-term downtrend, intact since the beginning of 2018, remains unbroken, with further selling likely on the cards as the next support is not visible until 0.6395 on this timeframe (not seen on the screen).
Since elbowing beneath weekly support mentioned above at 0.6828, support at 0.6733 on the daily timeframe entered the fray and held things higher. Yesterday, however, saw the level convert to potential resistance as the unit established sufficient ground lower down.
Across the page on the H4 timeframe, the candles remain hovering just north of the 0.67 branch. During the month of August, traders have witnessed price action compress within the limits of a descending channel formation (0.6817/0.6745). Note also we have the 0.68 handle in view as an upside target beyond the channel resistance, with a possible ABCD (black arrows) correction also in process, terminating a few points north of 0.68.
Beyond the 0.68 handle, a close-fitting area of resistance (yellow) also resides between a 127.2% Fibonacci ext. point at 0.6862, a Quasimodo resistance at 0.6858 and August’s opening level at 0.6848.
Areas of consideration:
Considering the increasingly strong bearish theme on the higher timeframes, selling is likely the favoured approach this week. In the event the research team’s higher-timeframe studies are accurate, it is likely we’re heading sub 0.67 today/this week. A H4 close beneath 0.67 on a H4 closing basis will likely open bearish scenarios towards at least 0.66ish. One such scenario, likely of interest to conservative traders, is a break/retest formation (red arrows). Entering on the back of a H4 rejection candle, with a protective stop-loss order plotted above the candlestick’s high, is likely enough to prompt selling towards 0.66.
USD/JPY:
USD/JPY prices traded mostly unchanged Monday, though did manage to pencil in a retest at 106 at the open on the H4 scale. With that being the case, the following piece will echo some thoughts put forward in Monday’s report.
From the weekly timeframe:
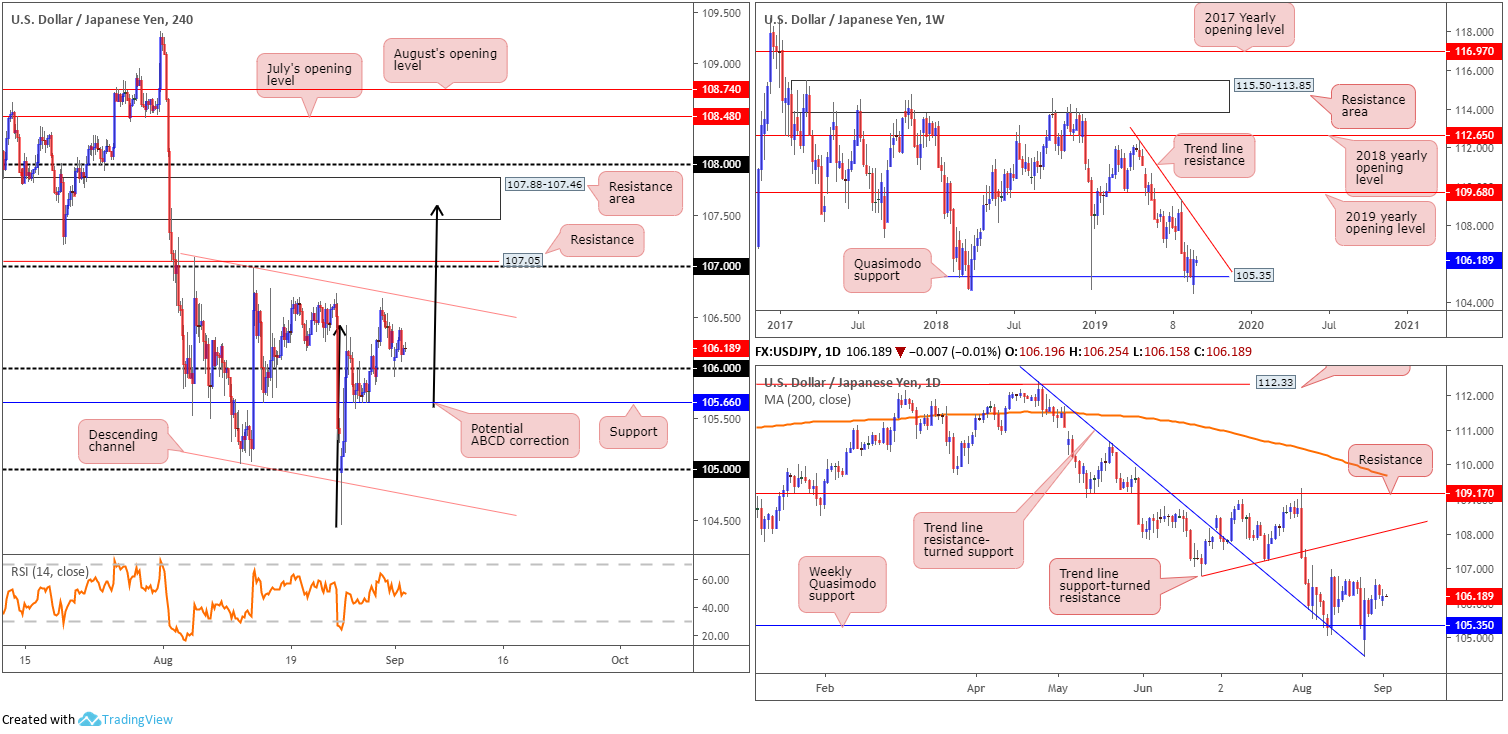
Quasimodo support at 105.35 – a level that proved its worth by holding the unit higher at the beginning of the year – held form last week, despite clocking fresh YTD lows at 104.44. Outside of this base, limited support is evident until 100.61 (not visible on the screen), whereas a push north has trend line resistance (extended from the high 112.40) to target.
The daily timeframe:
Recent action witnessed trend line resistance-turned support (pencilled in from the high 112.40) enter the fold (sited just south of the weekly Quasimodo support), lifting the unit strongly higher. Tops set at 106.77 remain the next upside objective on this scale, followed by trend line support-turned resistance (taken from the low 106.78).
The H4 timeframe:
Traders long from 106 have channel resistance extended from the high 107.09 to target, followed by the 107 handle, a resistance level at 107.05 and a resistance area coming in at 107.88-107.46, with the possibility of an ABCD completion (black arrows) within.
Beneath 106, support falls in close by at 105.66, followed by the 105 handle.
Areas of consideration:
Although we have weekly price indicating the possibility of further buying from its Quasimodo support at 105.35, tops on the daily scale around 106.77, along with H4 resistances highlighted above, are likely to hamper upside. Traders already long are urged to take note of the above said resistances, using them as a means of trade management should we reach this far north.
In the event we do push for higher ground and shake hands with the H4 resistance area at 107.88-107.46, a selloff from here could also be in store. Not only does this area meet closely with trend line resistance highlighted above on the weekly timeframe, it also boasts a connection with the noted daily trend line support-turned resistance.
USD/CAD:
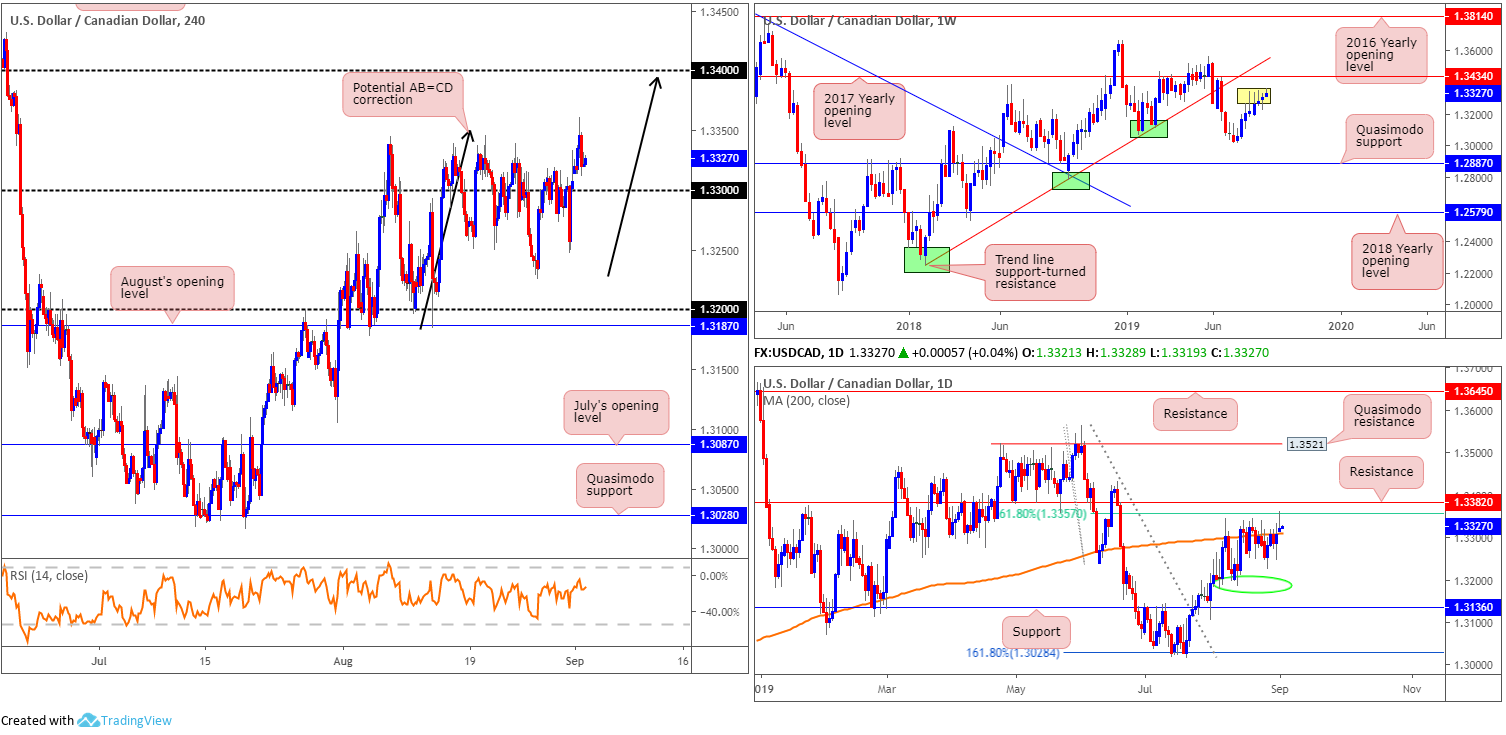
Trading volume thinned Monday as US and Canadian banks closed in observance of Labour Day. H4 price action, however, managed to establish firm support above the 1.33 handle, reaching highs set at 1.3360. The research team notes limited resistance until crossing swords with 1.34, which, if we turn this far north, may complete by way of an AB=CD approach (black arrows) at 1.3393.
The story on the weekly timeframe (extracted from Monday’s report) shows that since the beginning of the month, longer-term movement has been lethargic, shaped in the form of back-to-back selling wicks and a half-hearted buying tail last week (yellow). Price action exhibits scope to approach the 2017 yearly opening level at 1.3434, closely shaded by trend line support-turned resistance pencilled in from the low 1.2247. Should we turn lower and leave the said resistances unchallenged, however, traders’ focus will likely be on the 1.3016 July 15 low, followed by Quasimodo support at 1.2887.
In terms of where the research team stands on the daily timeframe, the unit surpassed the 200-day SMA (currently circulating around 1.3309) and shook hands with a 61.8% Fibonacci ratio drawn from 1.3357, closely shadowed by resistance coming in at 1.3382. Note this movement developed a shooting star formation (considered a bearish signal). Rotating lower from current price has 1.3190 (green circle) as the next base of support, followed by a well-placed support at 1.3136.
Areas of consideration:
In essence, the market has weekly price portending a move higher, at least until reaching 1.3434. Contrary to this, daily flow is capped at the underside of 1.3357. This places a question mark on longs. However, should the unit retest 1.33 by way of a H4 bullish candlestick pattern, this could, given we have room to press higher on the weekly scale, certainly be of interest to some traders (entry and risk can be determined according to the candlestick structure).
Shorts from the 1.34 handle are also possibly of interest for some traders. Not only does it come with a H4 AB=CD approach, nearby resistance on the daily timeframe falls in at 1.3382. Despite this confluence, nonetheless, traders are also urged to wait for additional H4 candlestick confirmation before executing a trade, as a fakeout through 1.34 to weekly resistance at 1.3434 may be on the cards.
USD/CHF:
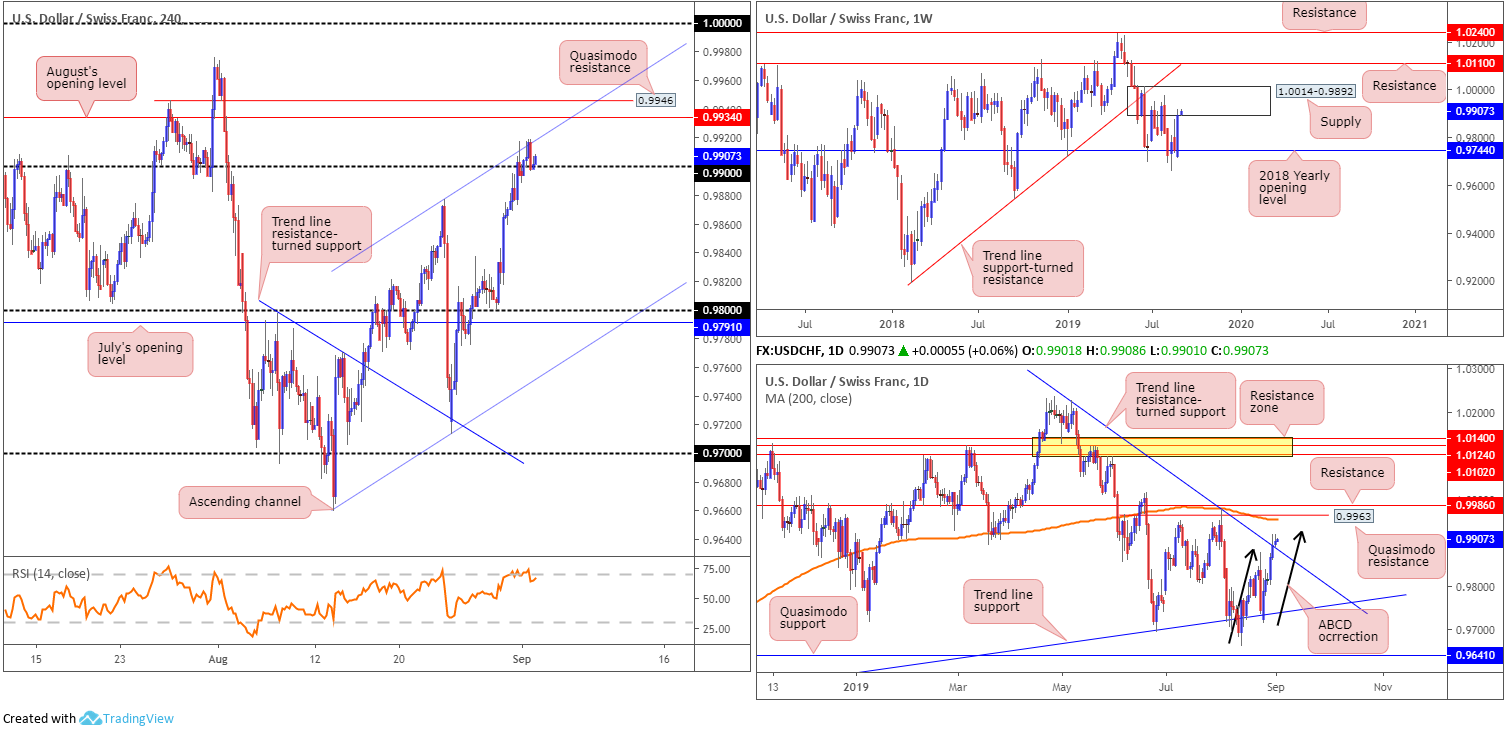
The US dollar was a shade firmer on the Swiss franc Monday, up 0.08%. Although lacking volatility, yesterday’s movement accomplished a couple of notable feats. On the H4 scale, the unit climbed above 0.99 which, although currently capped by nearby channel resistance (extended from the high 0.9877), is being retested as support in early trade this morning. Further buying from this point may lead an approach towards August’s opening level at 0.9934, closely fixed by Quasimodo resistance at 0.9946.
Higher-timeframe analysis has the weekly candles driving higher into the walls of a supply zone coming in at 1.0014-0.9892 after forming an outside day formation last week. In the event buyers brush aside the said supply this week (unlikely a straightforward feat), resistance at 1.0110 is in view, as is a long-term trend line support-turned resistance taken from the low 0.9187.
A closer interpretation of price action on the daily timeframe shows an impressive recovery off trend line support (etched from the low 0.9542), which eventually dethroned a trend line resistance extended from the high 1.0226. What’s also notable from a technical standpoint is the ABCD correction (black arrows) at 0.9923ish (a potential bearish cue). Areas of interest beyond the said resistances fall on Quasimodo resistance at 0.9963, a 200-day SMA (orange – 0.9955) and resistance coming in from 0.9986.
Areas of consideration:
With a trend line break to the upside visible on the daily timeframe, the immediate trend pointing in a northerly direction and H4 action retesting 0.99, buying opportunities are likely being considered. Whether buyers have sufficient oomph to reach August’s opening level at 0.9934/Quasimodo resistance at 0.9946, though, is difficult to judge. Not only must buyers contend with H4 channel resistance, there’s also the daily ABCD correction completing around 0.9923 and, of course, weekly supply at 1.0014-0.9892.
Strong cases for both sides of the market exist this morning.
Dow Jones Industrial Average:
With US and Canadian players away for Labour Day, a mild risk-off tone engulfed markets as Chinese and American officials struggled to schedule a planned meeting this month to continue trade talks.
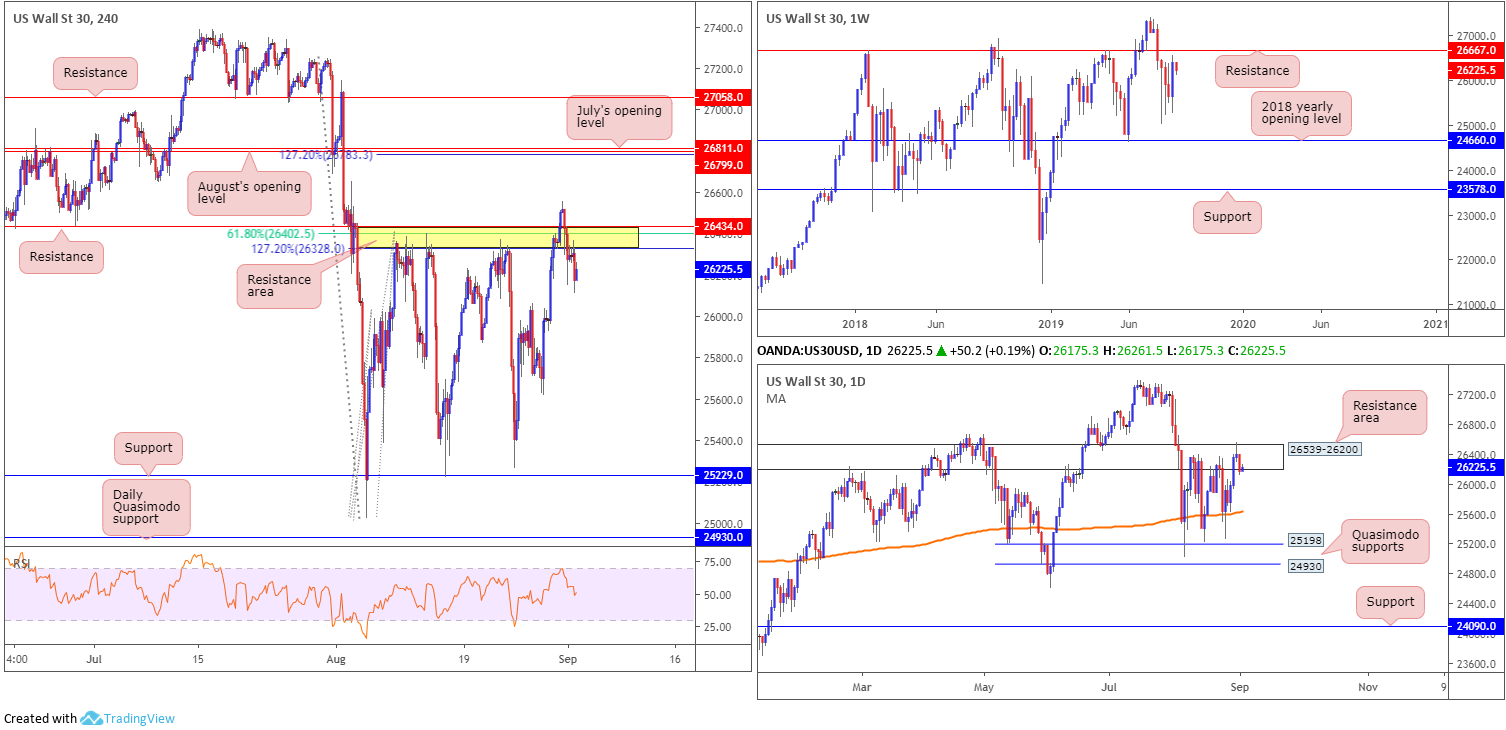
Weekly flow continues to kick its heels a few points south of resistance at 26667, following last week’s impressive outside day candlestick formation. A violation of this level places the all-time high 27388 in sight.
Since early August, the daily candles have been bounded by Quasimodo support coming in at 25198 and a resistance area forged at 26539-26200. What’s notable is the said resistance zone is sited just south of weekly resistance at 26667, and daily price produced a mediocre shooting star pattern within the bounds of the said resistance area Friday, generating follow-through selling Monday.
Recent selling drew the H4 candles back beneath familiar resistance at 26434/26328 (comprised of resistance at 26434, a 127.2% Fibonacci ext. point at 26328 and a 61.8% Fibonacci retracement value at 26402). Note as we drew below the zone it was retested and held good form. This could force lower prices today/this week to at least the 200-day SMA sited on the daily timeframe at 25649.
Areas of consideration:
Shorts at current price are an option. Having limited support visible on both weekly and daily timeframes along with the fakeout above the H4 resistance zone at 26434/26328 (with buy stops tripped to sell into), a sell with a protective stop-loss order above Friday’s high at 26555 is an idea, targeting the 200-day SMA at 25649, followed by daily Quasimodo support at 25198.
XAU/USD (GOLD):
Gold prices, in $ terms, is mostly unchanged this morning, ranging no more than $15 Monday. As a result of yesterday’s lacklustre performance, much of the following analysis will echo thoughts aired in Monday’s briefing.
Monday’s weekly report expressed the following in regards to the weekly timeframe:
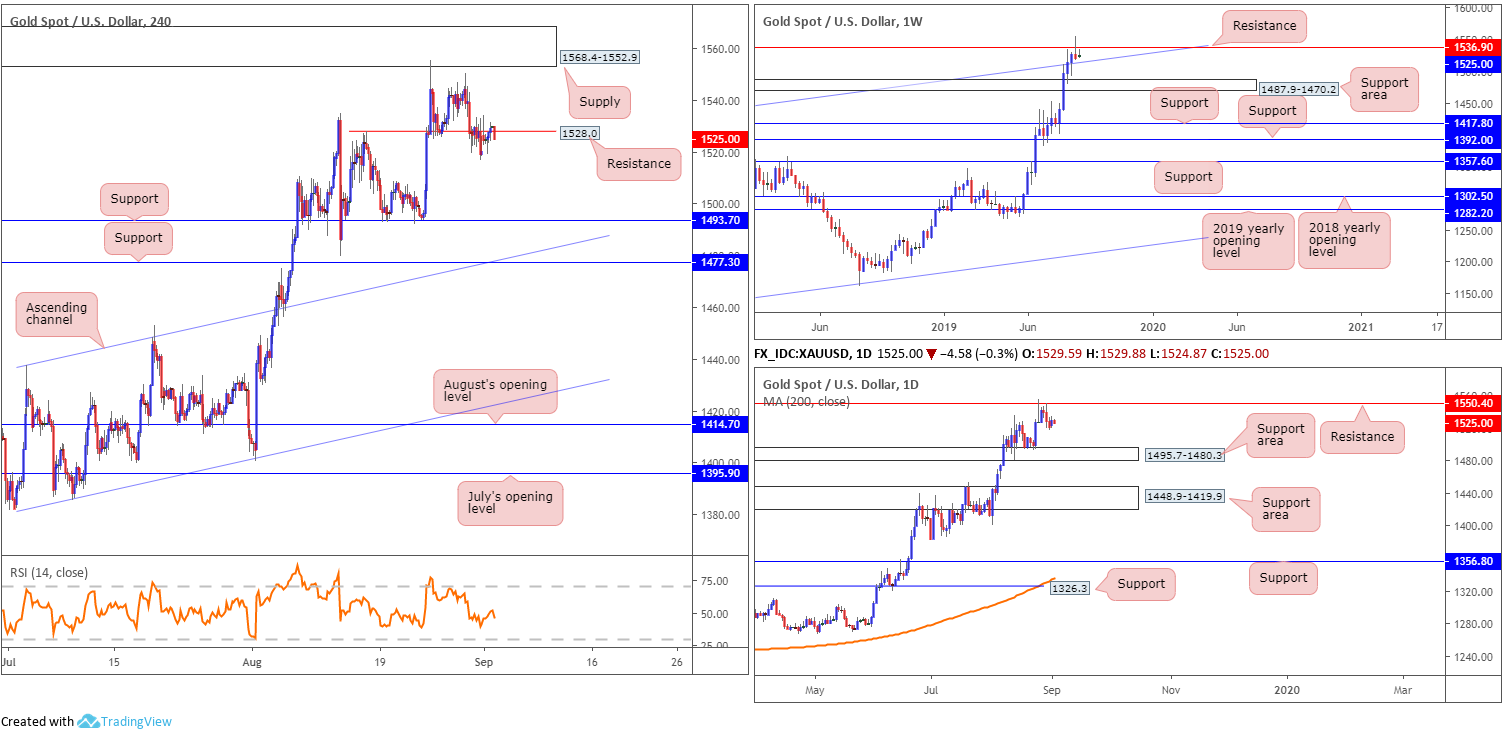
Breaking a strong four-week bullish phase, bullion rotated lower from notable resistance priced in at 1536.9 (boasts strong historical significance – check late 2011 and early 2012) last week by way of a near-perfect shooting star formation (considered a bearish signal).
As we registered highs not seen since April 2013, last week’s pullback may only be a minor blip and find nearby channel resistance-turned support (taken from the high 1375.1) offers a floor this week.
Daily perspective:
In tandem with weekly flow, daily movement noted a bearish engulfing formation off resistance at 1550.4 Thursday, and generated additional downside Friday. The next downside hurdle on this scale, nonetheless, comes in at a support area from 1495.7-1480.3, sited just south of the weekly channel support. Note Monday’s action reclaimed Friday’s losses.
H4 perspective:
As you can see from this timeframe, 1528.0 is holding as resistance, which was a noted zone to consider selling last week, with downside opened to support coming in at 1493.7.
Areas of consideration:
Outlook unchanged.
Well done to any of our readers who managed to jump aboard the retest at 1528.0 Friday, which offered a H4 bearish outside day as confirmation. Holding out for H4 support at 1493.7 and reducing risk to breakeven once/if the position rolls over at least a 1R risk/reward is still likely the best way forward.
The accuracy, completeness and timeliness of the information contained on this site cannot be guaranteed. IC Markets does not warranty, guarantee or make any representations, or assume any liability regarding financial results based on the use of the information in the site.
News, views, opinions, recommendations and other information obtained from sources outside of www.icmarkets.com.au, used in this site are believed to be reliable, but we cannot guarantee their accuracy or completeness. All such information is subject to change at any time without notice. IC Markets assumes no responsibility for the content of any linked site.
The fact that such links may exist does not indicate approval or endorsement of any material contained on any linked site. IC Markets is not liable for any harm caused by the transmission, through accessing the services or information on this site, of a computer virus, or other computer code or programming device that might be used to access, delete, damage, disable, disrupt or otherwise impede in any manner, the operation of the site or of any user’s software, hardware, data or property.


