
Key risk events today:
RBA Cash Rate Decision and Rate Statement; US Presidential Election; New Zealand Employment Change and Unemployment Rate.
(Previous analysis as well as outside sources – italics).
EUR/USD:
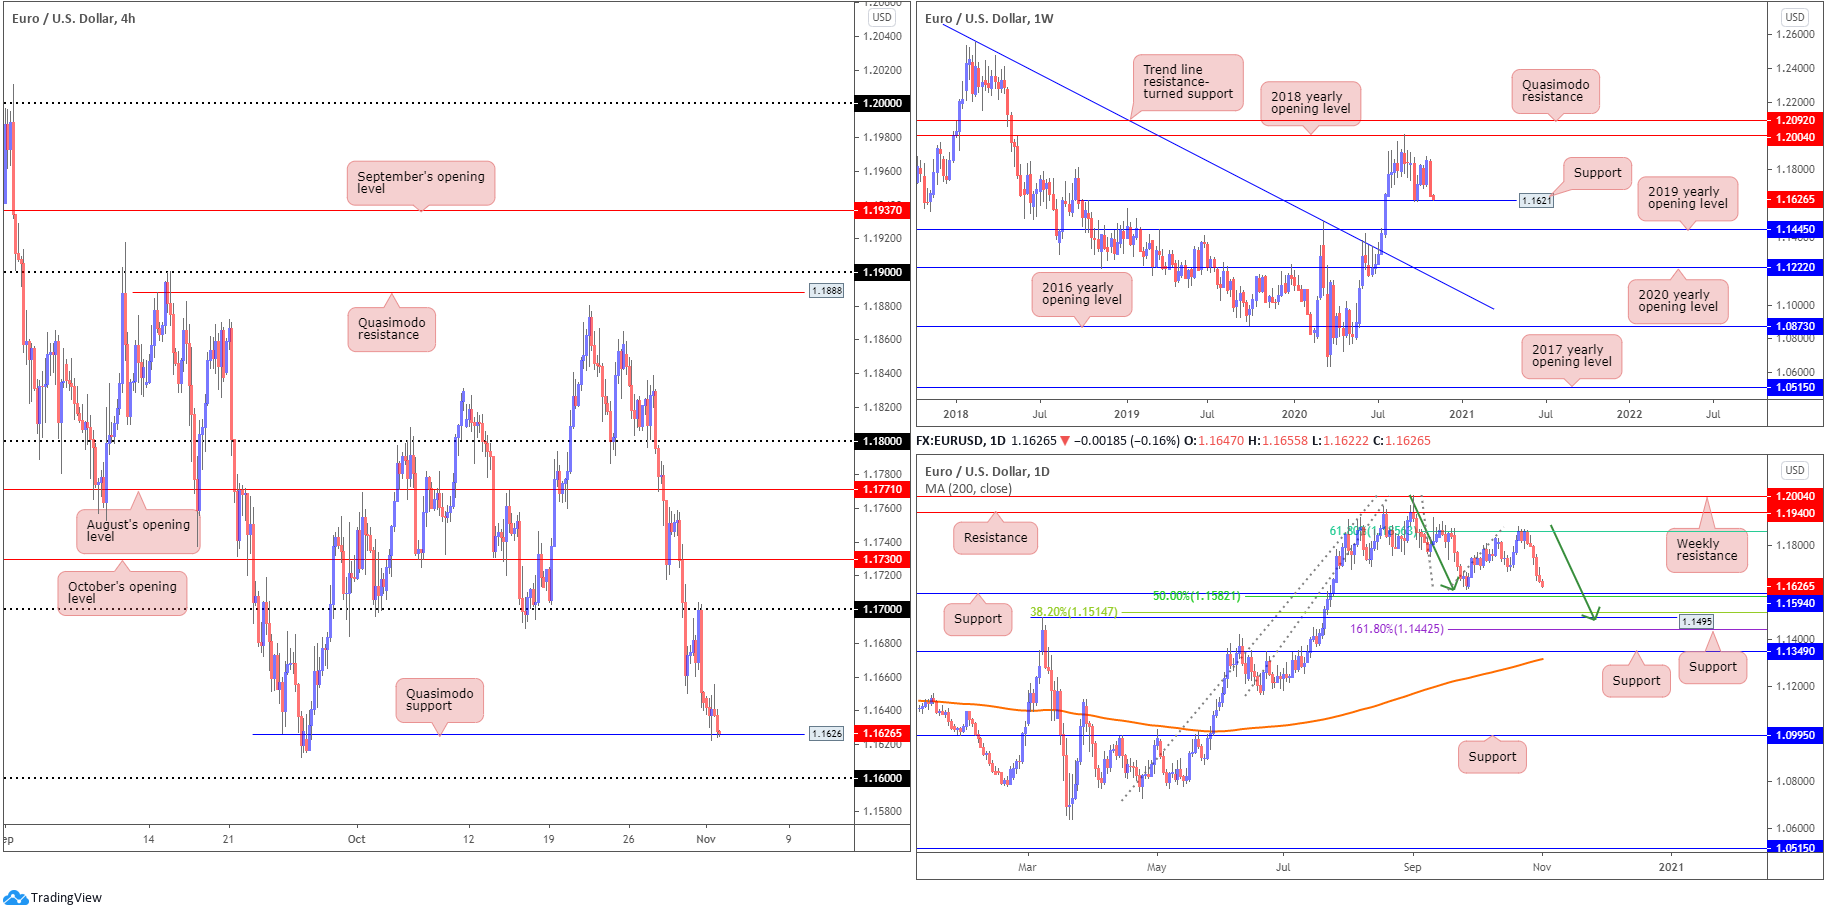
The euro fell for a sixth consecutive session against a stronger USD Monday, aided by an upbeat US Manufacturing PMI print.
The decline has manoeuvred H4 candles into a Quasimodo support level at 1.1626, which happens to converge with weekly support at 1.1621. Interestingly, an earlier test of the level failed to spark much bullish follow-through movement.
Should we fail to hold off 1.1626 today, which going by current price does not look like we’re going to, the 1.16 handle is next on tap in terms of support. Between the daily 50.0% retracement ratio at 1.1582 (and daily support at 1.1594) and 1.16 gifts traders a reasonably tight area of support to work with.
Areas of consideration:
- H4 Quasimodo support at 1.1626 and weekly support at 1.1621 is a support zone that should not be overlooked, despite downside risks clearly building.
- Between the daily 0% retracement ratio at 1.1582 (and daily support at 1.1594) and the 1.16 handle on the H4 is an area traders are likely to monitor in the event of 1.1626 breach today.
GBP/USD:
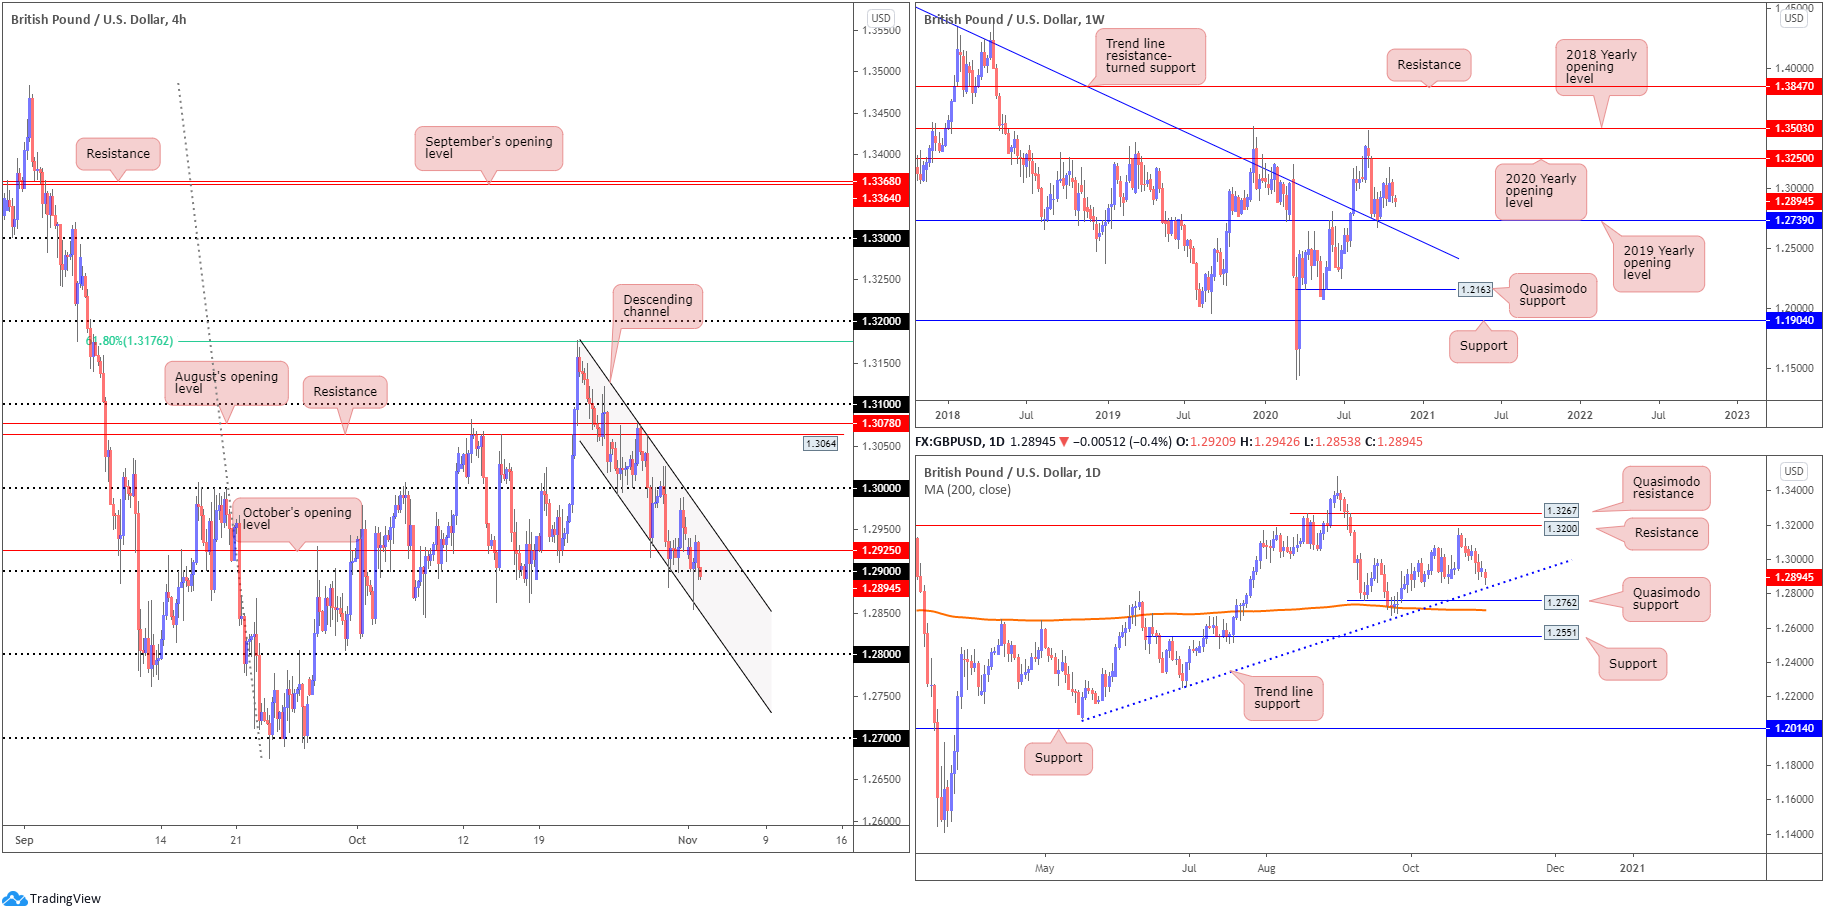
Cable opened on the backfoot Monday, pressured amidst a second lockdown across England. In addition to the US dollar index reclaiming territory above 94.00, GBP/USD ran stops beneath the 1.29 handle and appeared to gather additional bearish flow from October’s opening value on the H4 scale at 1.2925. Also worth mentioning is since the pair topped around 1.3176 in late(ish) October, price has been entrenched within a descending channel, taken from the high 1.3176 and low at 1.2992.
Further out on the higher timeframes, weekly price could pop either way with resistance seen at the 2020 yearly opening value from 1.3250, and support coming in from 1.2739, a 2019 yearly opening value that blends with trend line resistance-turned support, extended from the high 1.5930. It is also worth pointing out the aforementioned trend line was engulfed in July of this year, announcing an uptrend could be on the cards.
From the daily timeframe, after coming within touching distance of resistance at 1.3200, buyers clearly lost their flavour. This, as you can see, triggered modest selling and shined the spotlight on trend line support, extended from the low 1.2075, followed by Quasimodo support at 1.2762. Also close by is the 200-day SMA (orange – 1.2704).
Areas of consideration:
Outlook unchanged.
- The 1.29 handle continues to echo instability. A break under the aforementioned number potentially sets the stage for a bearish play to 1.28 (limited [active] demand seen to the left of price). Conservative sellers, nonetheless, may opt to wait and see if a 1.29 retest (as resistance) forms before committing.
AUD/USD:
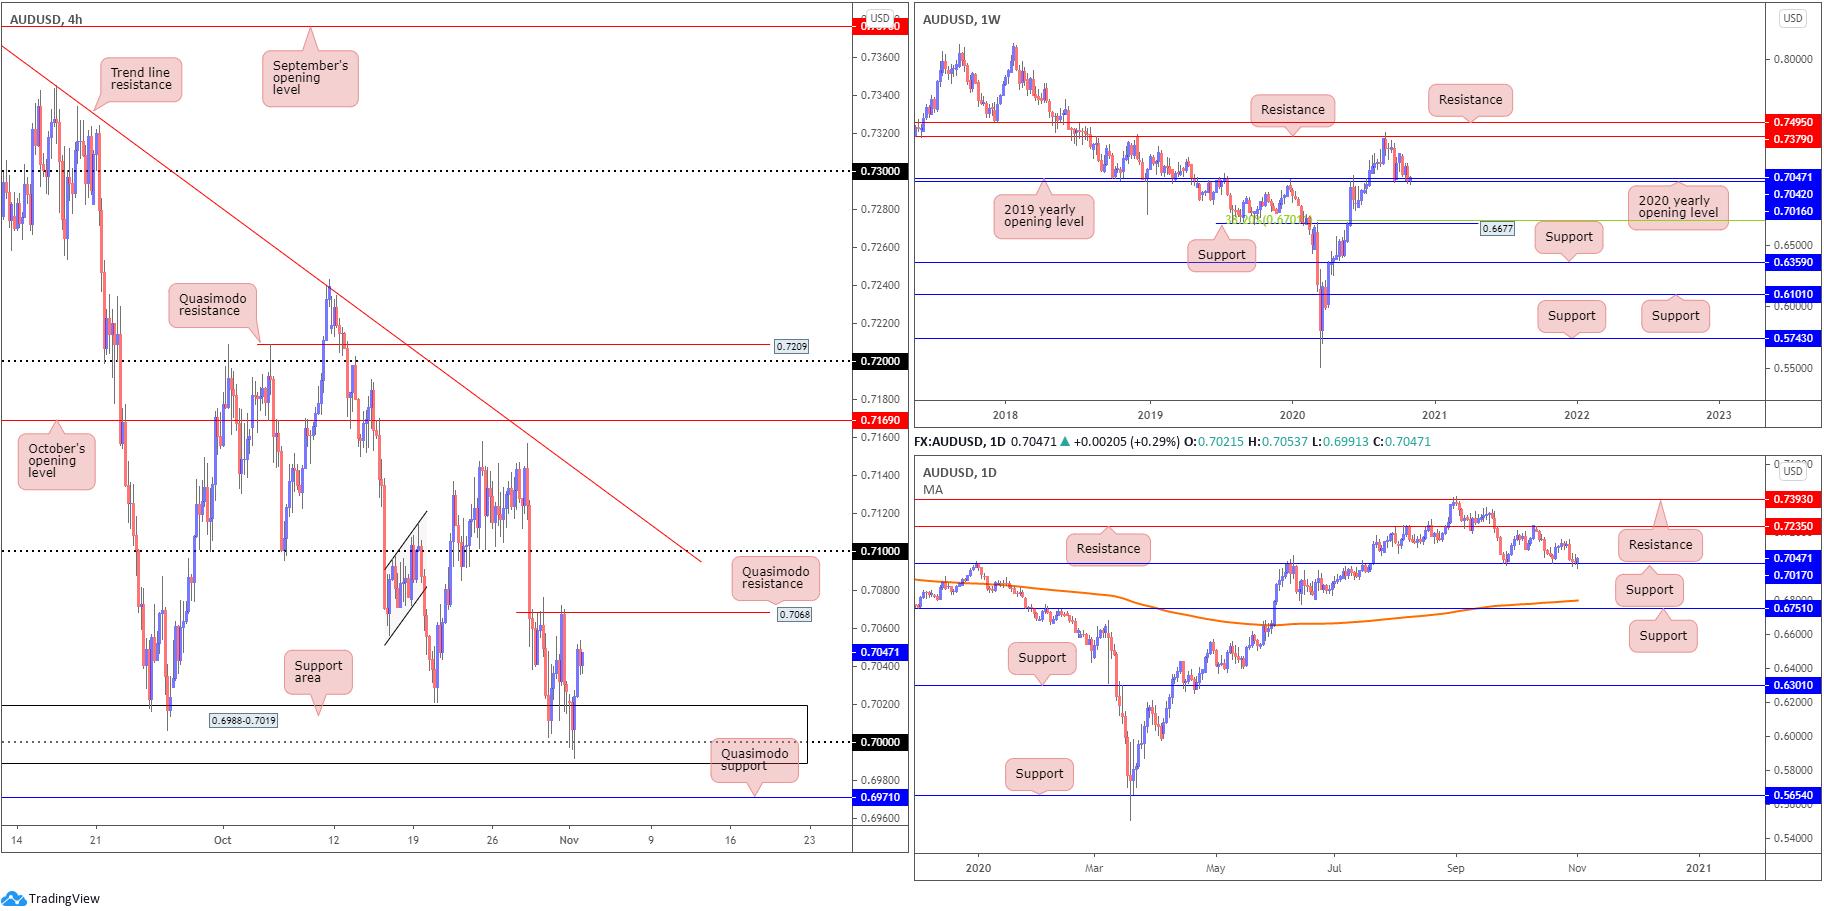
Snapping a three-day bearish phase, AUD/USD kicked off the week on positive footing, boosted amid risk-on flow.
For those who read Monday’s technical briefing you may recall the following (italics):
The H4 support area at 0.6988-0.7019 is likely to be on the watchlists of many traders this week, on account of where we trade on the bigger picture: weekly and daily supports. The 0.70 handle may also be of particular interest.
As evident from the H4 chart, price latched onto a strong bid off 0.70 Monday, placing H4 Quasimodo resistance at 0.7068 in the spotlight.
From the higher timeframes, we left Monday writing the following:
The 2020 (0.7016) and 2019 (0.7042) yearly opening values continue to be recognised as support on the weekly timeframe. Resistance at 0.7379 lines up as the next upside hurdle should an advance materialise this week. It should also be pointed out that the trend in this market remains to the upside. Failure to maintain position off 0.7016/0.7042 shifts motivation towards support plotted at 0.6677, and a corresponding 38.2% Fibonacci retracement ratio at 0.6701.
In partnership with weekly supports, support on the daily timeframe made an appearance at 0.7017 in the second half of last week. Monday’s reaction has potentially reignited interest at tops around 0.7157ish (and resistance at 0.7235). If a push through 0.7017 is seen this week, support appears to be somewhat light until the 200-day SMA (orange – 0.6800) and support at 0.6751.
Areas of consideration:
- Buyers out of the H4 support area at 0.6988-0.7019 have perhaps reduced risk to breakeven, with H4 Quasimodo resistance at 0.7068 in sight, followed by the 0.71 handle.
- Continued buying above 0.7068 could provide intraday buyers another opportunity to long AUD/USD, though be aware 0.71 and nearby H4 trend line resistance, extended from the high 0.7413, could prove problematic.
USD/JPY:
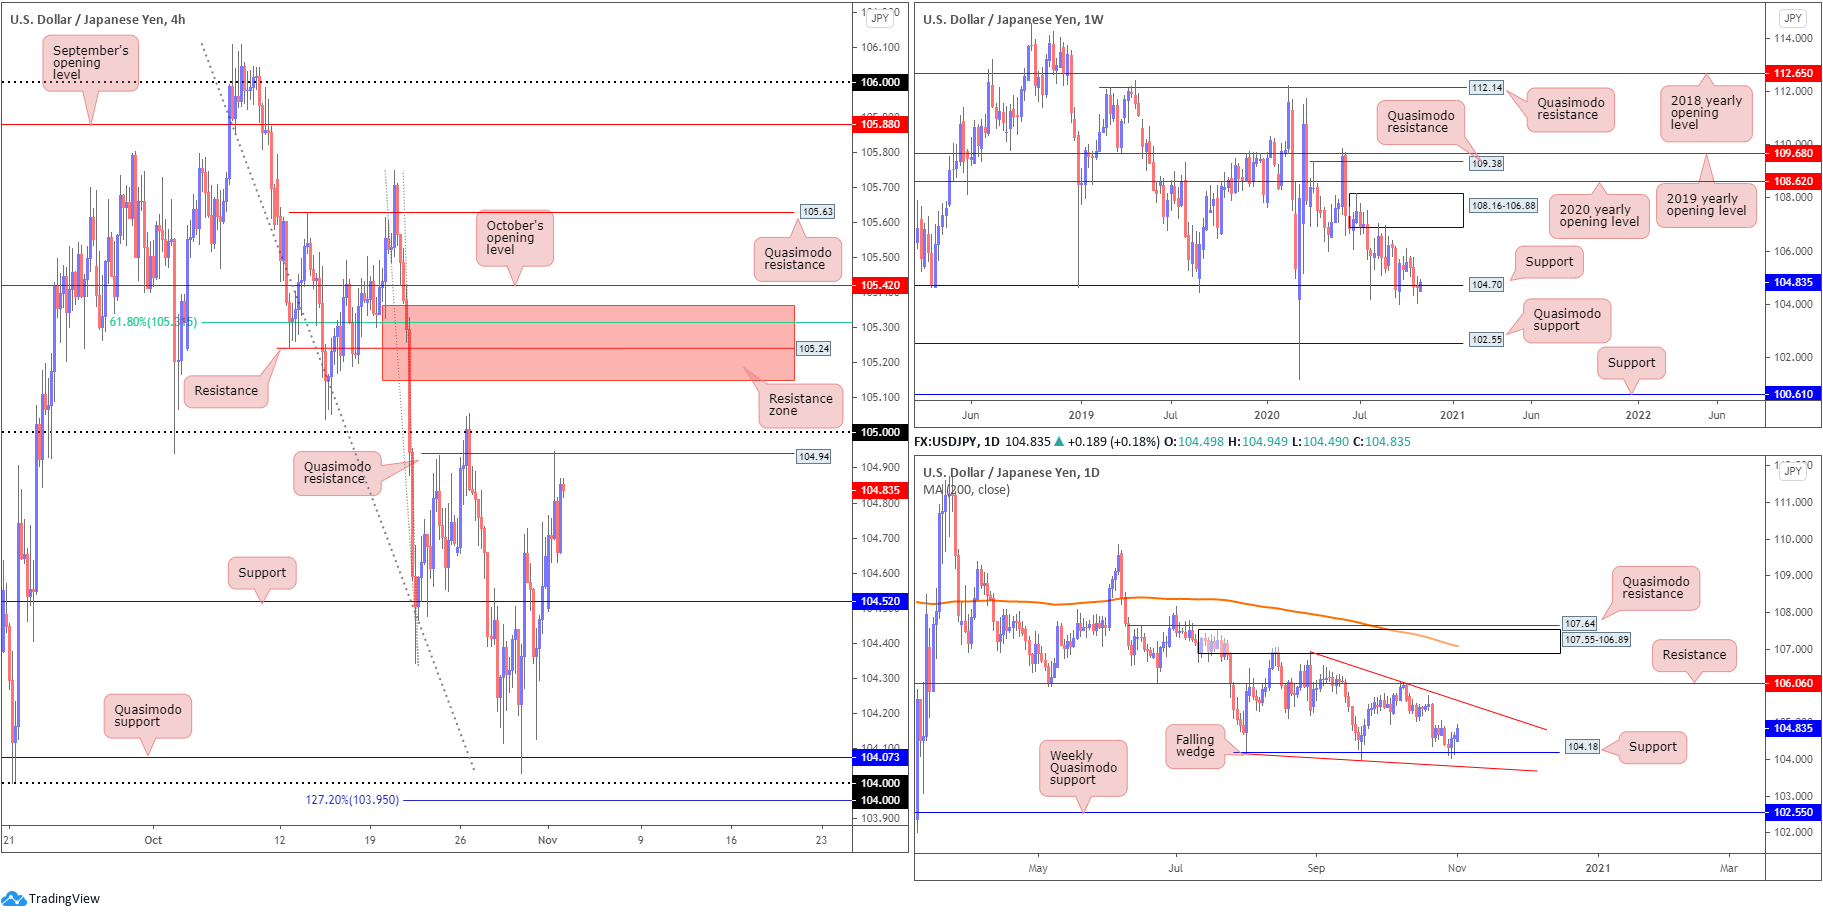
USD/JPY extended recovery gains Monday, as global equities ended the session mostly on a high note.
An opening retest at H4 support from 104.52 stoked interest to the upside in the early hours of trading, with enough of a spark to draw in Quasimodo resistance from 104.94 (sited just south of the 105 handle). Despite the mild bearish response from the aforementioned Quasimodo, the resistance area between 105.36-105.14 (red) represents an attractive base (technically speaking), holding a number of key levels within and benefiting from any buy-stop liquidity above the 105 handle.
Long-term support from 104.70 came under pressure on the weekly timeframe last week, yet, as you can see, price is attempting to keep hold of the level, similar to July and September’s movement. However, the lack of buying pressure seen September onwards has been less than impressive, suggesting the support is fragile as we head into election territory. Quasimodo support at 102.55 offers a feasible target beyond current support, while a 104.70 rejection places supply back in the mix at 108.16-106.88.
Movement on the daily timeframe is visibly compressing between two converging descending lines taken from 104.18/106.94, establishing a falling wedge pattern. Due to the series of lower lows and lower highs since March, the current falling wedge is likely to be interpreted as a reversal signal should a breakout higher take shape. What’s also interesting from a technical perspective is not only is weekly flow holding at support, the pair is rebounding from daily support coming in at 104.18.
Areas of consideration:
For those who read Monday’s technical briefing you may recall the following (italics):
A correction/retest at H4 support drawn from 104.52, given the charts recognise higher timeframe supports, could encourage a bullish scenario to target the 105 region this week.
Those who managed to snatch a long position off 104.52 have likely reduced risk to breakeven, eyeing 105 and possibly the H4 resistance zone between 105.36-105.14.
Bearish themes also remain a possibility from the aforementioned H4 resistance area.
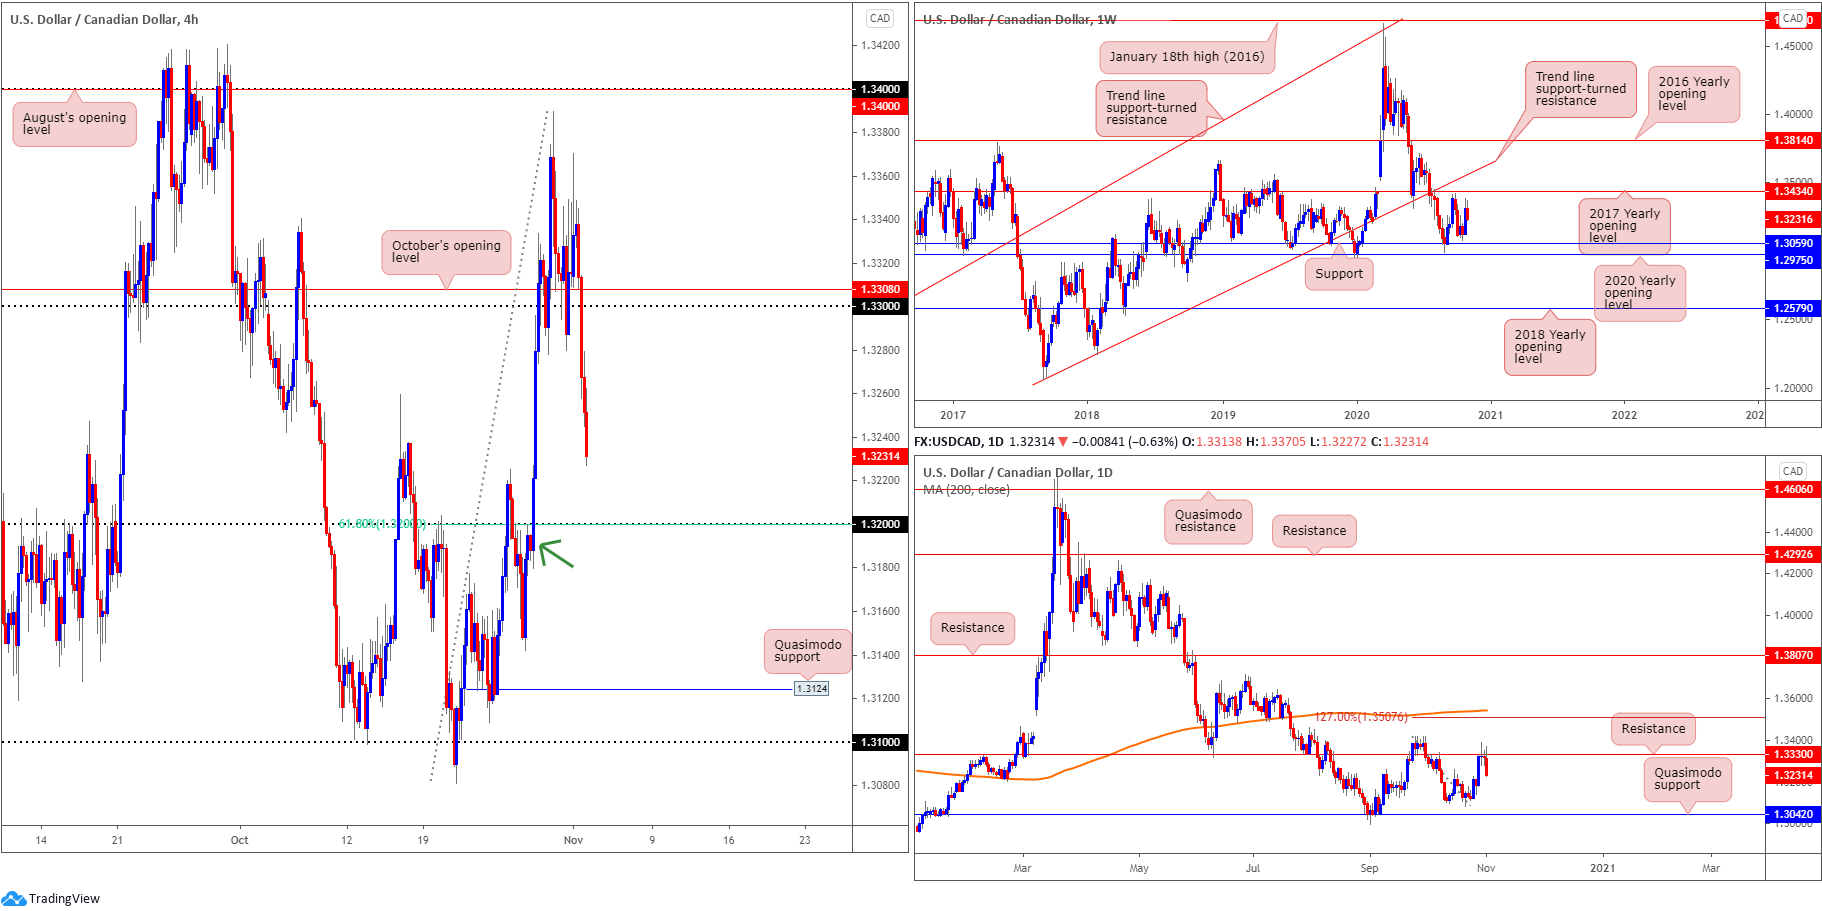
USD/CAD:
Demand for oil off lows at $33.67 a barrel on Monday boosted the Canadian dollar and, ultimately, weighed on USD/CAD, pulling H4 candles through the 1.33 key figure to within striking distance of the 1.32 handle and 61.8% Fibonacci retracement ratio. Technical selling off daily resistance at 1.3330 may have also factored into the recent sell-off. Price action traders may also want to acknowledge the clear H4 demand area resting just under the 1.32 base (green arrow) at around 1.3190ish.
Both the weekly and daily timeframes exhibit scope for additional underperformance, with weekly support priced in at 1.3059, closely shadowed by daily Quasimodo support coming in at 1.3042.
Areas of consideration:
- The 1.32 handle is clearly going to be on the watchlists for some traders today, knowing it blends with a H4 61.8% Fibonacci level and shelters demand around 1.3190.
- However attractive 1.32 appears, higher timeframes demonstrate little interest around this region, projecting further selling could be seen should we reach this figure. Therefore, breakout sellers will likely observe price closely at 1.32 for a potential bearish theme south of the round number, targeting H4 Quasimodo support at 1.3124, followed by 1.31.
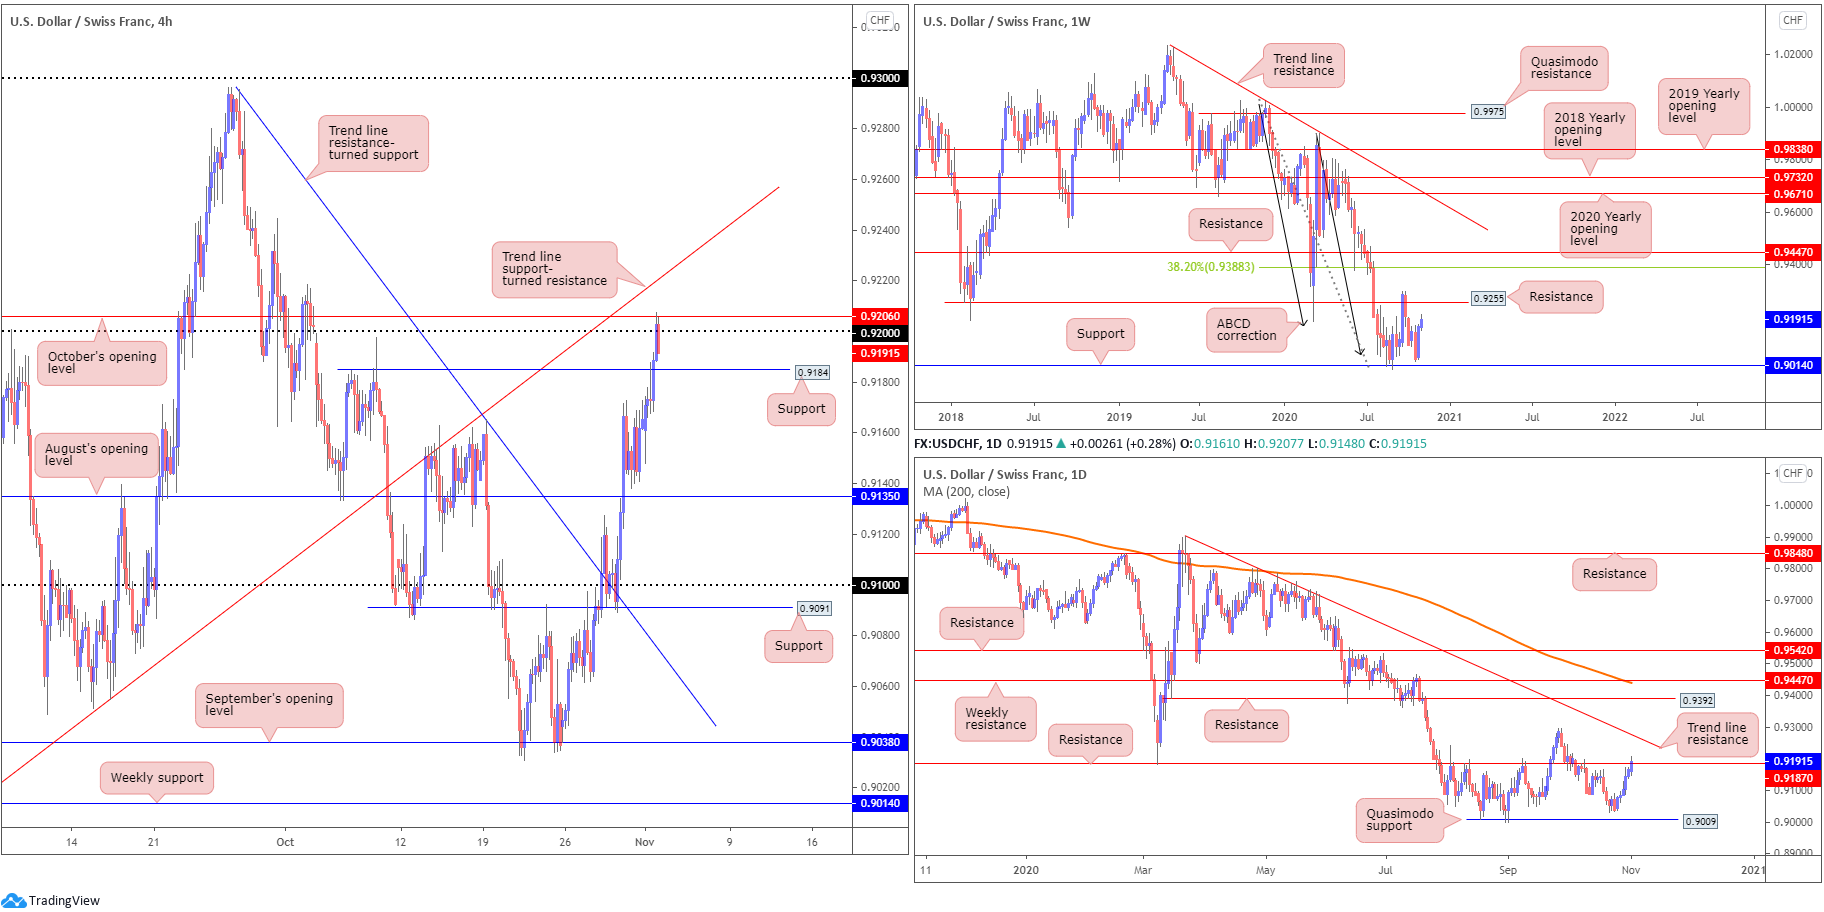
USD/CHF:
The US dollar remained heavily bid against the Swiss franc on Monday, reinforced on the back of broad USD strength as upcoming US elections spark uncertainty.
H4, after a phase of consolidation north of August’s opening value at 0.9135, saw buyers overthrow Quasimodo resistance at 0.9184 (now potential support) to shake hands with the 0.92 handle and October’s opening value at 0.9206.
On the higher timeframes, we can see daily price crossing swords with resistance at 0.9187, after printing six consecutive daily bull candles north of Quasimodo support at 0.9009. A decisive break higher this week exposes trend line resistance, extended from the high 0.9901. Price readers will also likely acknowledge that weekly resistance at 0.9255, a previous Quasimodo support level, merges closely with the aforementioned daily trend line resistance.
Areas of consideration:
- Interested sellers off the 0.92 handle and October’s opening value at 0.9206 will likely seek a H4 close under H4 support at 0.9184 before considering taking action. This is largely due to the lack of bearish interest seen so far at daily resistance and the possible threat of a H4 fakeout above 0.92 to test trend line support-turned resistance, taken from the low 0.8998.
- Should we hold above 0.92, however, and take on the H4 trend line resistance, further selling could be in the offing towards weekly resistance at 0.9255.
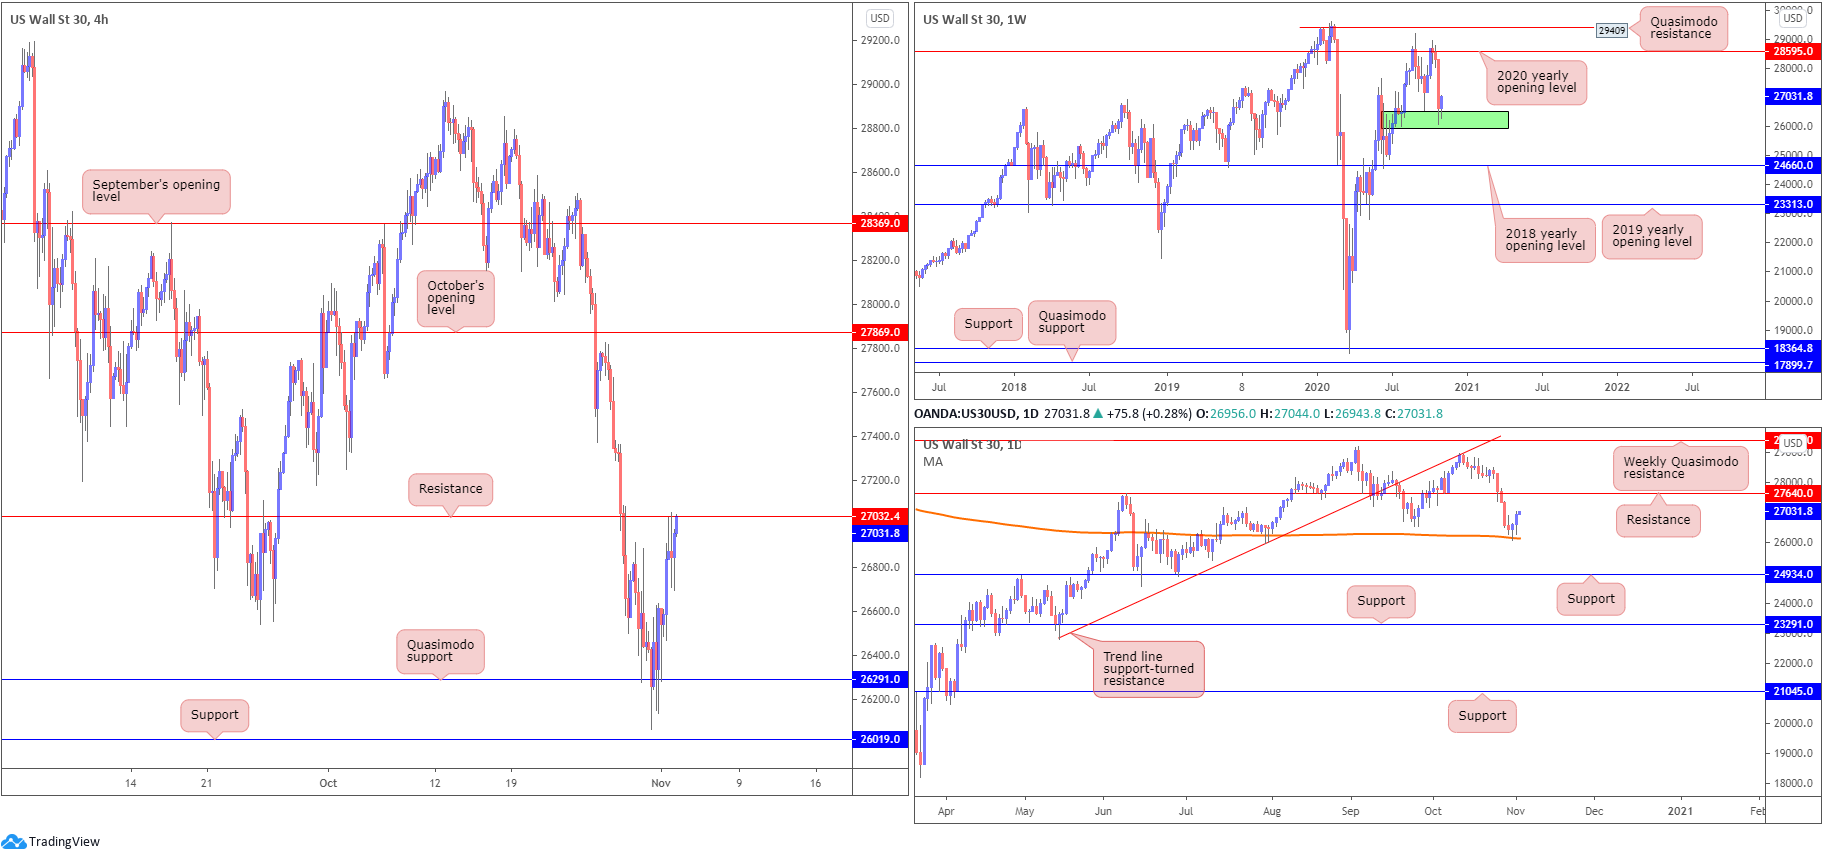
Dow Jones Industrial Average:
US equities concluded on the front foot Monday, a day ahead of the US election. The Dow Jones Industrial Average advanced 423.45 points, or 1.60%, the S&P 500 climbed 40.28 points, or 1.23% and the Nasdaq traded higher by 46.02 points, or 0.42%.
From the weekly timeframe, demand entered view at (green) 25916-26523 last week and has so far been well received by buyers. Should further buying materialise, the 2020 yearly opening value at 28595 is seen. Alongside the weekly demand area, Friday crossed swords with the 200-day SMA (orange – 26145) on the daily timeframe Friday and established a hammer candlestick pattern, which fed buyers another reason to jump in long, targeting resistance at 27640.
Although higher timeframes have a reasonably clear path north right now, H4 resistance at 27032 must be overthrown before the unit seeks October’s opening value priced in at 27869.
Areas of consideration:
- Keeping things simple as we head into election territory, a H4 close above H4 resistance from 27032 today might encourage buying, targeting daily resistance at 27640. Additional buyers are likely to join should the resistance form support on a retest.
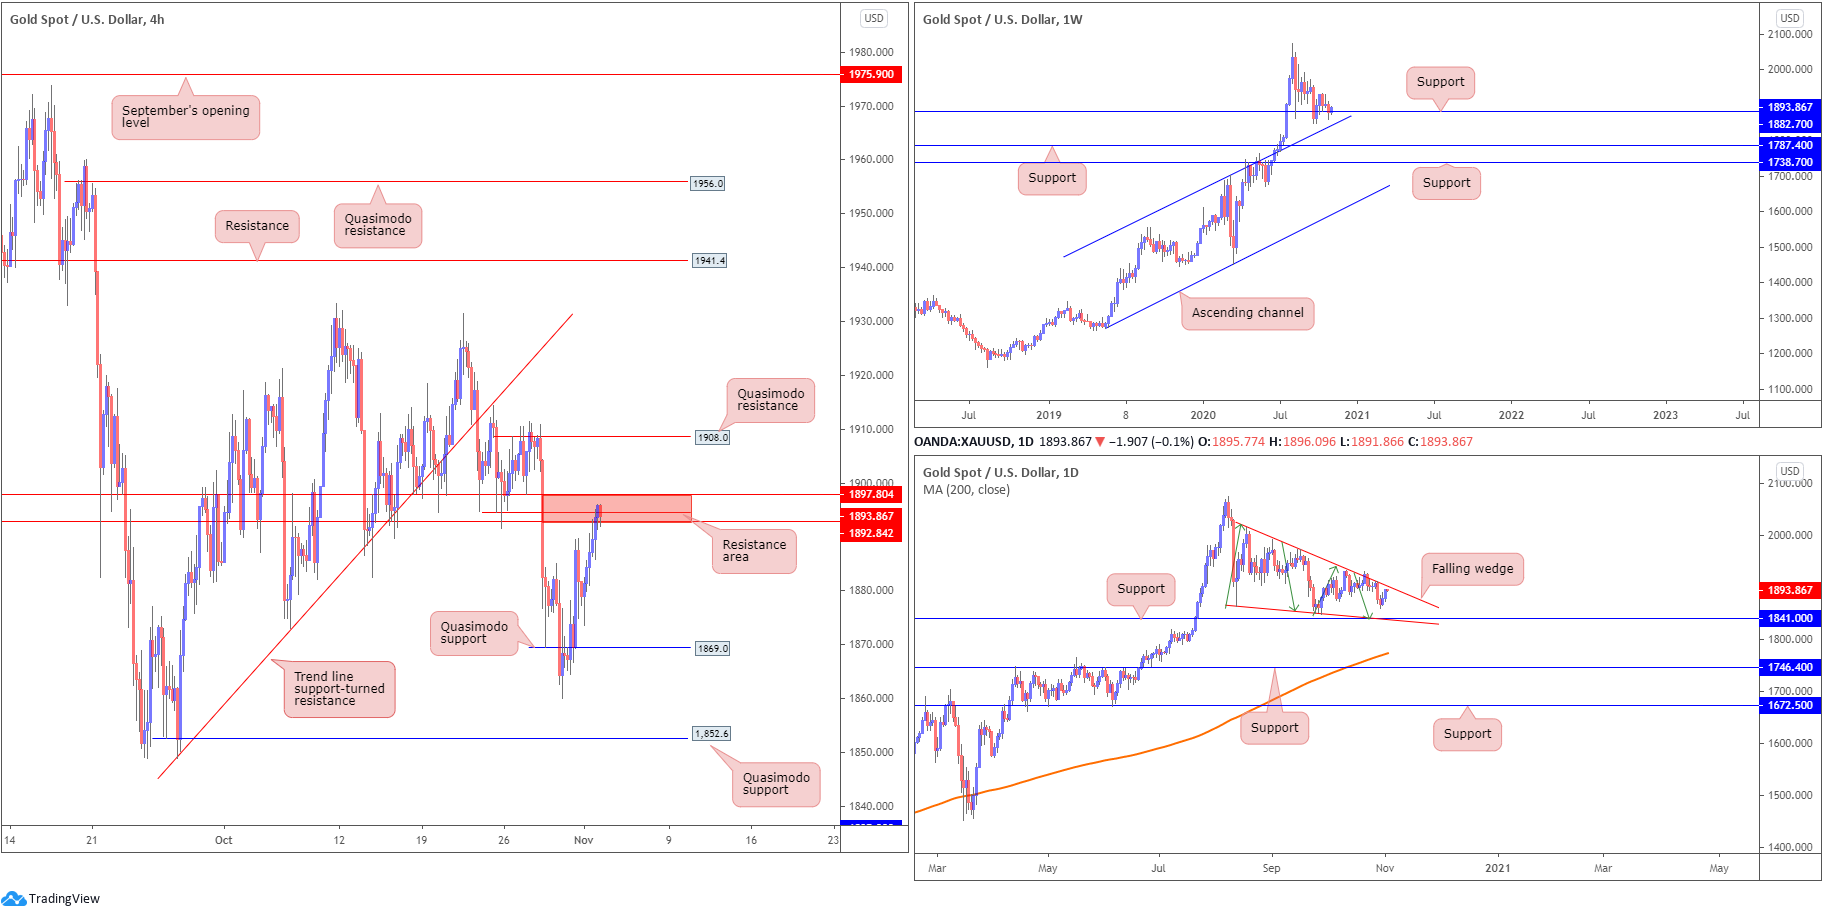
XAU/USD (GOLD):
Gold pencilled in a near-1% gain against the US dollar on Monday, wrapping up a touch off session peaks.
Technically, the rally is not a surprise having seen weekly price recently engage with support at $1,882. Closely reinforcing this level, we can also see channel resistance-turned support, taken from the high $1,703. Should a wave of buying emerge, long-term traders’ crosshairs are likely focussed on the all-time peak $2,075.
The daily timeframe is in the process of creating a falling wedge pattern between $2,015 and $1,862 (the lower boundary also lines up closely with support at $1,841), which may be interpreted as a continuation signal in the event of a breakout north. With reference to trend, the yellow metal has been DECISIVELY gravitating higher since 2016 (although price has been trending higher much longer than this overall).
With Monday searching higher levels, H4 price reached into the walls of a resistance between $1,897-$1,892. A reaction from here could target Quasimodo support at $1,869, while continuation buying turns the spotlight towards Quasimodo resistance at $1,908.
Areas of consideration:
- Short term could have sellers enter the fray from H4 resistance between $1,897-$1,892, targeting H4 Quasimodo support at $1,869. Failure to hold here puts forward an intraday bullish signal to H4 Quasimodo resistance at $1,908. Conservative buyers may seek a $1,897 retest before committing.
- Long term, nonetheless, an eventual breakout above the daily falling wedge could spark bullish moves off weekly support ($1,882).
The accuracy, completeness and timeliness of the information contained on this site cannot be guaranteed. IC Markets does not warranty, guarantee or make any representations, or assume any liability regarding financial results based on the use of the information in the site.
News, views, opinions, recommendations and other information obtained from sources outside of www.icmarkets.com.au, used in this site are believed to be reliable, but we cannot guarantee their accuracy or completeness. All such information is subject to change at any time without notice. IC Markets assumes no responsibility for the content of any linked site.
The fact that such links may exist does not indicate approval or endorsement of any material contained on any linked site. IC Markets is not liable for any harm caused by the transmission, through accessing the services or information on this site, of a computer virus, or other computer code or programming device that might be used to access, delete, damage, disable, disrupt or otherwise impede in any manner, the operation of the site or of any user’s software, hardware, data or property


