
Key risk events today:
Australia Cash Rate and RBA Rate Statement; BoE Gov Carney Speaks; EUR CPI Flash Estimate y/y.
(Previous analysis as well as outside sources – italics).
EUR/USD:
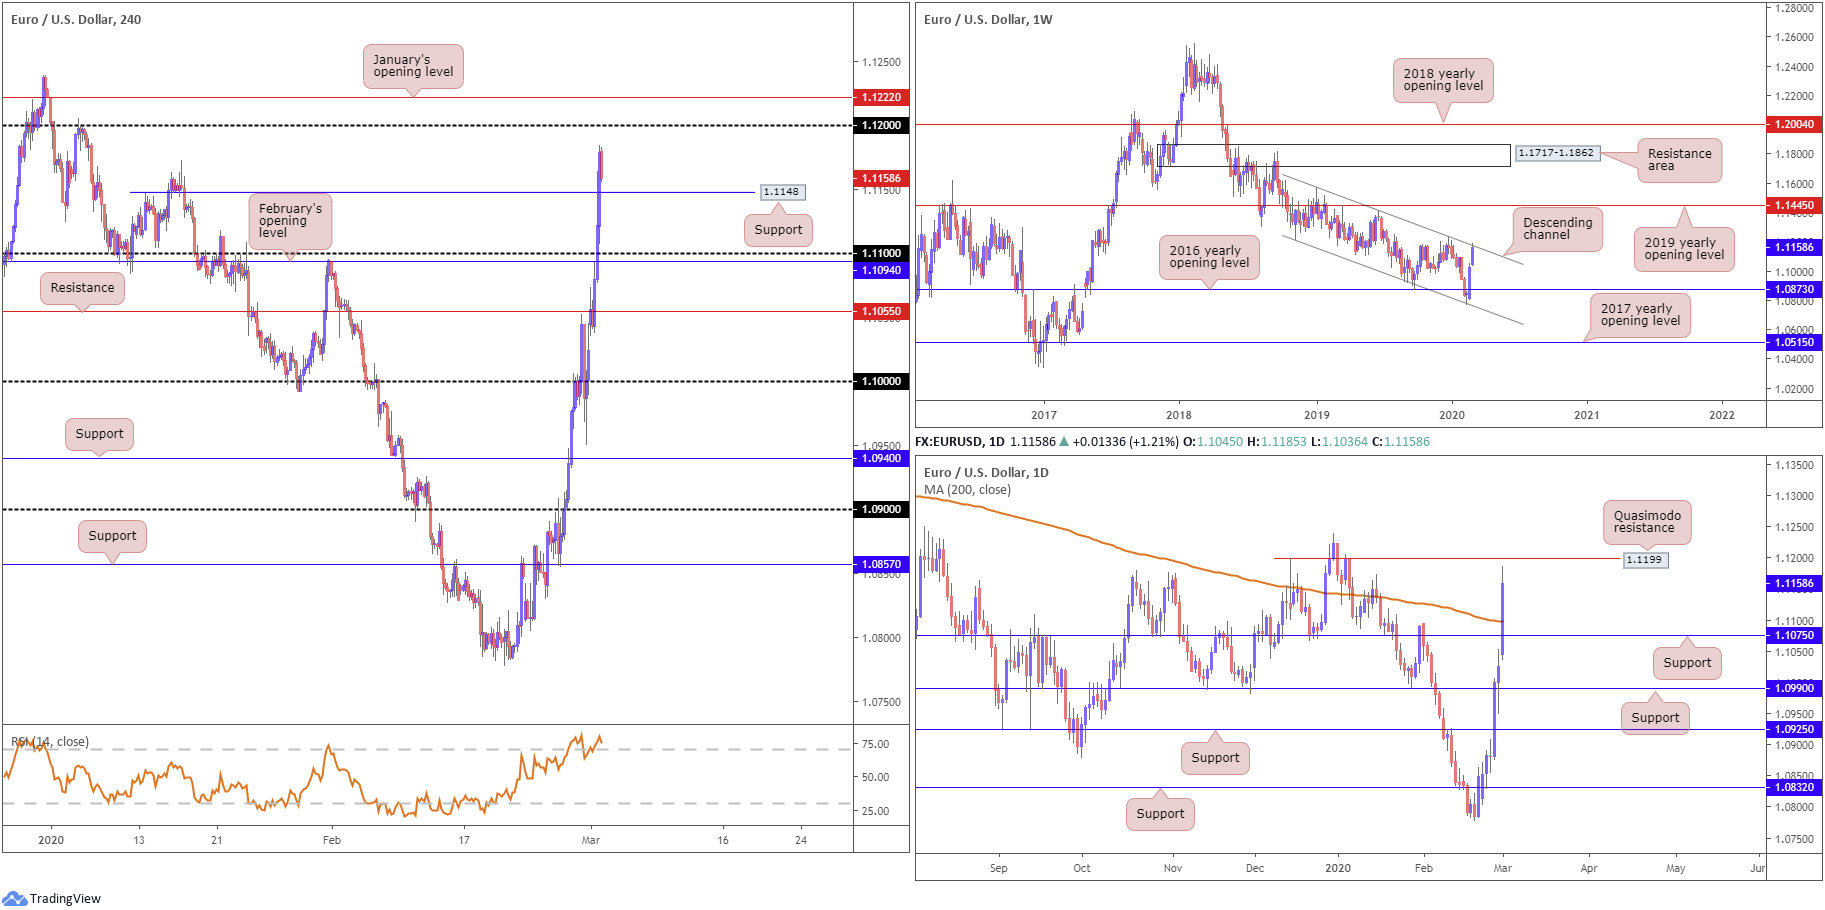
Talks of Fed easing, coupled with record lows in US Treasury yields, witnessed the euro firmly advance Monday, adding more than 120 points into the close.
EUR/USD weekly price recently touched gloves with channel resistance, extended from the high 1.1569. This follows a stronger-than-expected rotation off channel support, taken from the low 1.1109, and sustained upside north of the 2016 yearly opening level at 1.0873. Closer analysis of price action has daily price crossing its 200-day SMA (orange – 1.1098), potentially heading for Quasimodo resistance at 1.1199.
H4 flow wrapped up things a touch south of 1.12, poised to retest support at 1.1148, a previous Quasimodo resistance level. Note above 1.12 we have January’s opening level at 1.1222, whereas below 1.1148, a run back to 1.11 could be on the cards, shadowed closely by February’s opening level at 1.1094. The relative strength index (RSI) is currently testing overbought conditions, printing mild bearish divergence.
Areas of consideration:
A retest at H4 support from 1.1148 is likely to be seen today, though given weekly price has shaken hands with channel resistance and the lack of supporting confluence seen around 1.1148, buyers may be in a fragile position. In the event the support holds, however, a move to 1.12 could be seen.
A test of 1.12 could be interesting as possible resistance, having seen daily Quasimodo resistance at 1.1199 and January’s opening level nearby at 1.1222. A pullback from this neighbourhood could see 1.1148 back in view, with a break targeting 1.11.
GBP/USD:
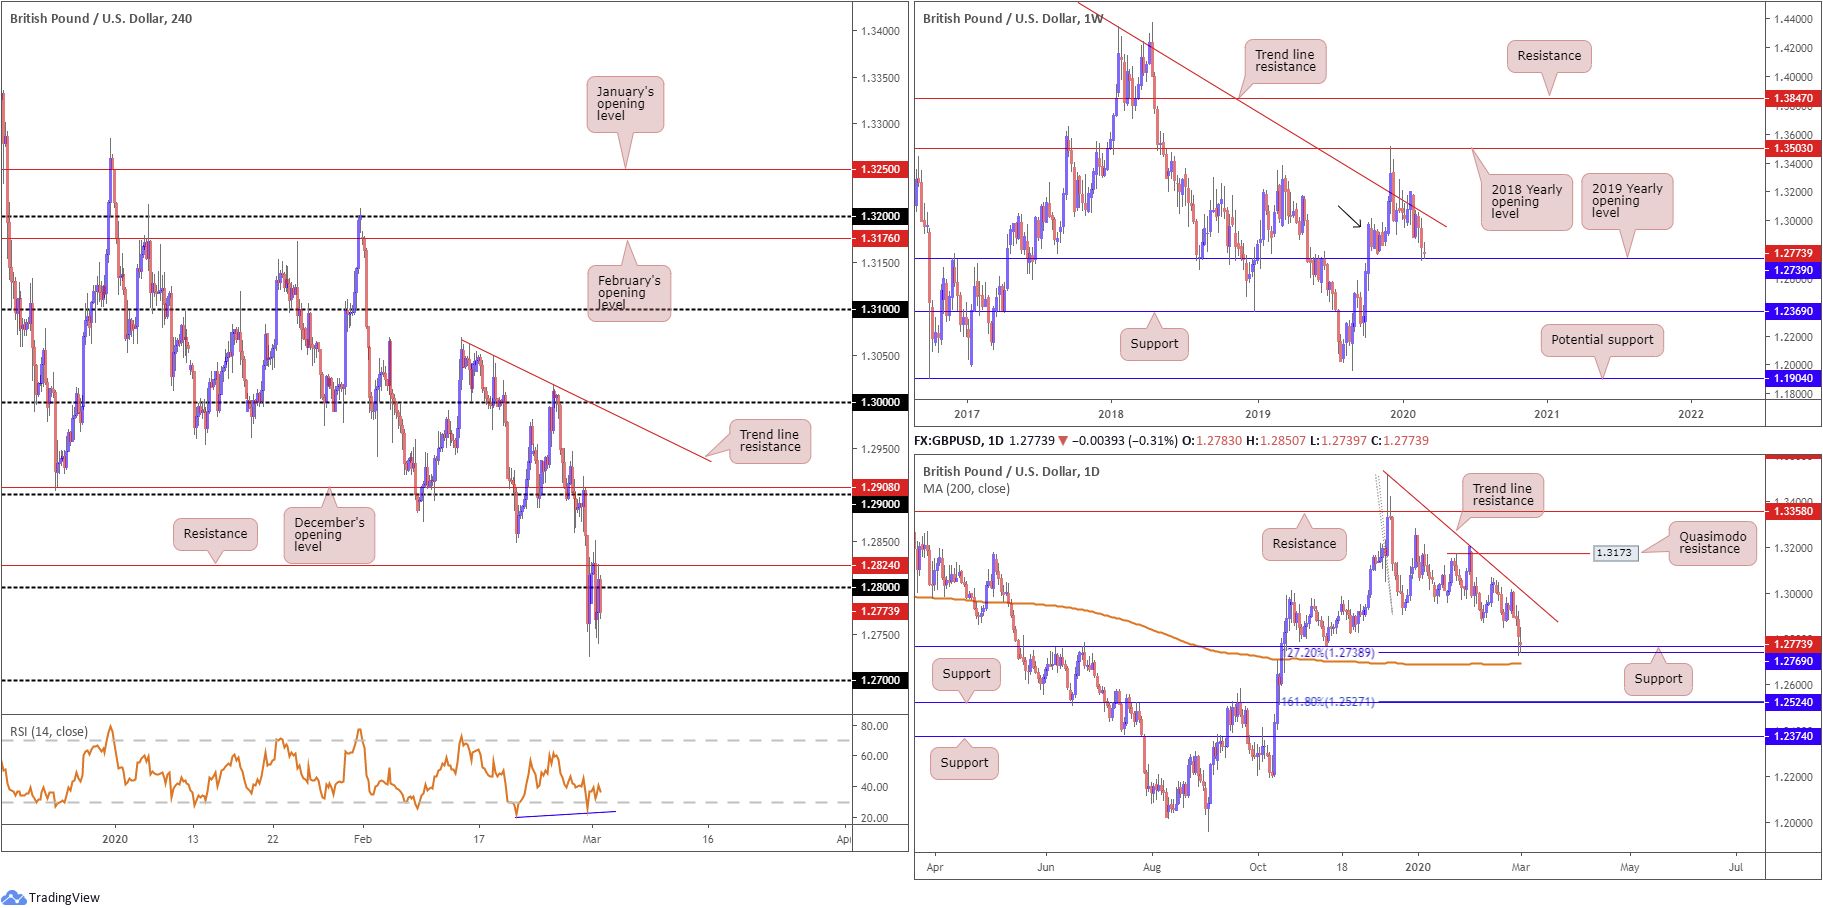
Persistent uncertainty surrounding the future UK-EU trade relationship and fears of a no-deal Brexit, along with a muted response to UK final manufacturing PMI, had sterling stationed around multi-month lows Monday.
Technically, H4 price is capped by resistance at 1.2824 and the round number 1.28. Concerning H4 structure, the 1.27 handle is open for a test, though do bear in mind we are seeing the relative strength index (RSI) produce bullish divergence out of oversold territory.
Since the beginning of the year, weekly price has been languishing beneath long-standing trend line resistance, pencilled in from the high 1.5930. Last week, however, witnessed sellers strengthen their grip and connect with the 2019 yearly opening level at 1.2739, whipsawing through demand around the 1.2939 region (black arrow) and registering fresh YTD lows. A breach of the said support would side-line hopes of recovery and shine the spotlight on support from 1.2369.
In conjunction with the weekly timeframe, we can see price action on the daily timeframe ran into a particularly interesting area of support at 1.2769, a 127.2% Fibonacci extension at 1.2738 and the 200-day SMA. Note the said SMA has been flattening since mid-October 2019. Trend line resistance, extended from the high 1.3514, is next in line should we advance. Failure to hold at 1.2769, nonetheless, has support at 1.2524 to target, which happens to merge closely with a 161.8% Fibonacci extension at 1.2527.
Areas of consideration:
Regardless of the unit clocking YTD lows last week, the combined weekly and daily supports between 1.2739 and 1.2769 is potentially enough to inspire a recovery.
Traders, however, are likely waiting for a H4 close beyond resistance at 1.2824 before considering upside free to 1.29ish. Of course, a break of the current H4 resistance, followed up with a strong retest off 1.28, is likely a preferred scenario for entry.
AUD/USD:
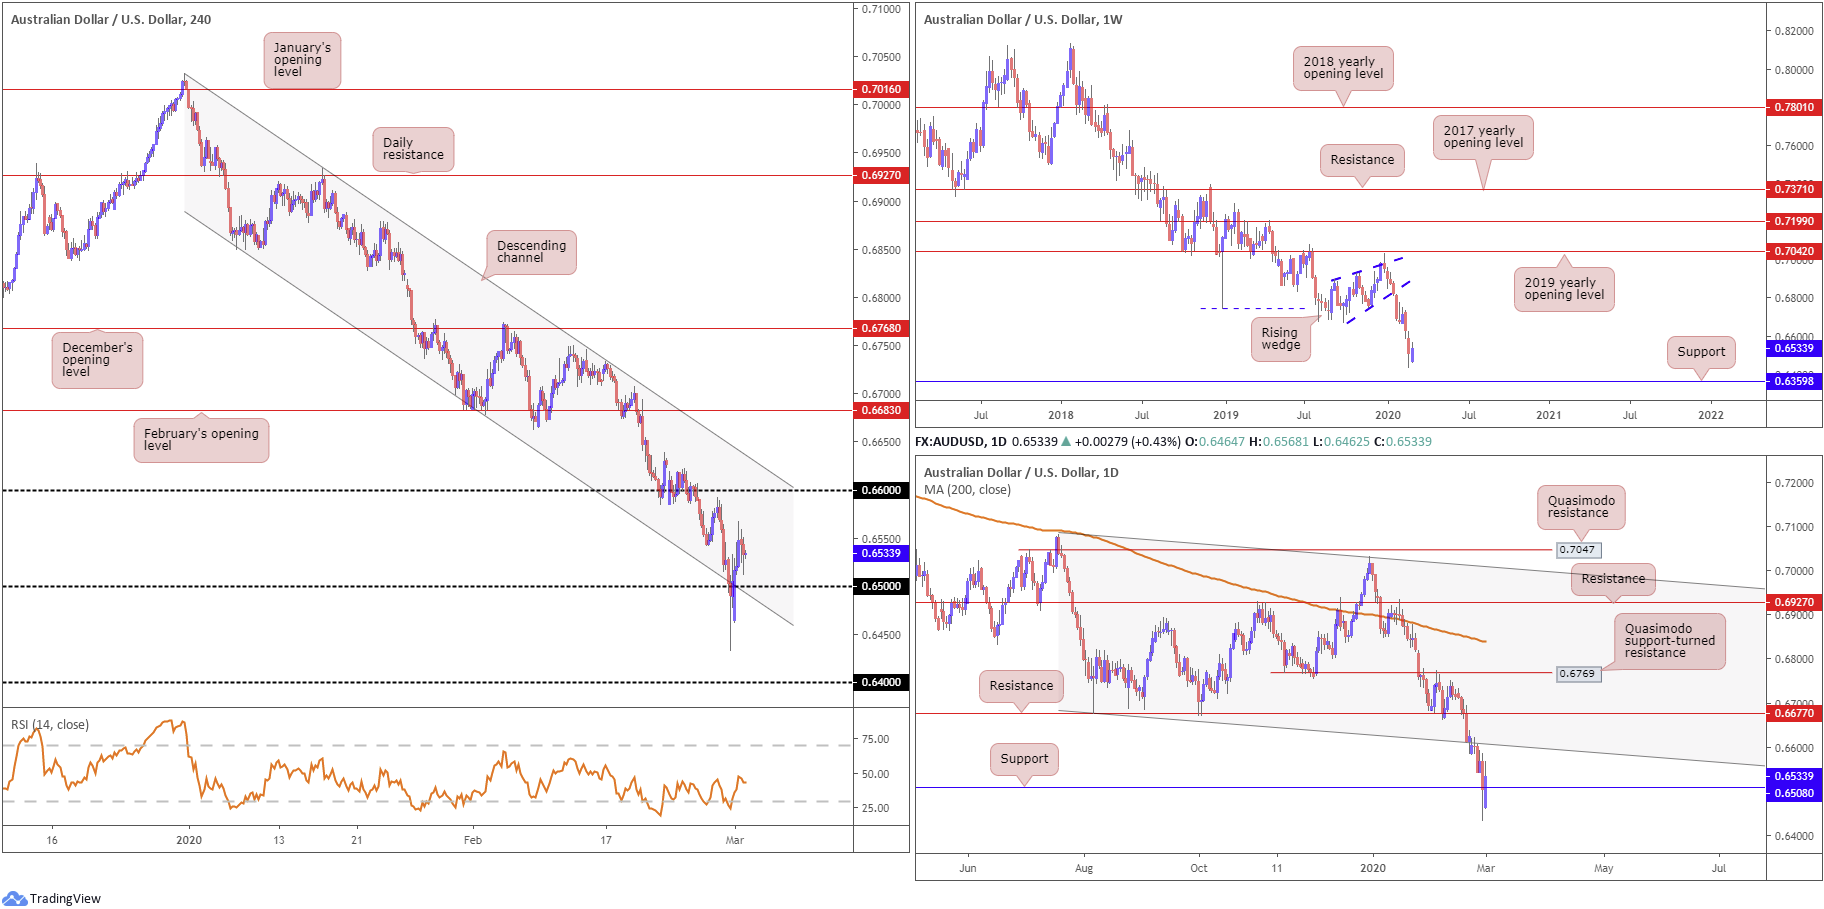
AUD/USD traded comfortably over 0.65 amid USD weakness Monday, as attention turns to the RBA to see whether interest rates are lowered by 25bps, as unanimously anticipated. Analytics also display channel support on the H4 timeframe, extended from the low 0.6850. In terms of resistance on this scale, price could swerve towards the 0.66 handle and channel resistance, etched from the high 0.7031.
AUD/USD on the weekly scale is, despite Monday’s recovery above 0.65, now tilting towards support coming in at 0.6359. Eight out of nine weeks has seen the pair register losses, since topping a touch south of the 2019 yearly opening level at 0.7042, and completing a five-month rising wedge pattern. Note the primary trend has faced south since 2018, and we’re now testing decade lows in this market.
After violating channel support on the daily timeframe, taken from the low 0.6677, and later retesting the lower boundary as resistance, renewed selling emerged, with Friday aggressively grasping support at 0.6508. Holding above the current support could force a retest at the said channel resistance. 0.6301 remains in view as the next support target, in the event we press for lower ground over the coming weeks.
Areas of consideration:
While further recovery could form on the H4 and daily timeframes, the threat of additional downside materialising on the weekly timeframe may deter buyers in this market. The long-term primary trend should also not be overlooked.
Despite this, some buyers likely have 0.65 eyed as potential support today, targeting 0.66, while sellers perhaps have eyes on a H4 close back beneath 0.65 for a run to Friday’s low at 0.6433, the 0.64 handle on the H4 scale, followed by weekly support at 0.6359.
USD/JPY:
Monday’s analysis stated the following regarding a potential resistance zone on the H4 timeframe:
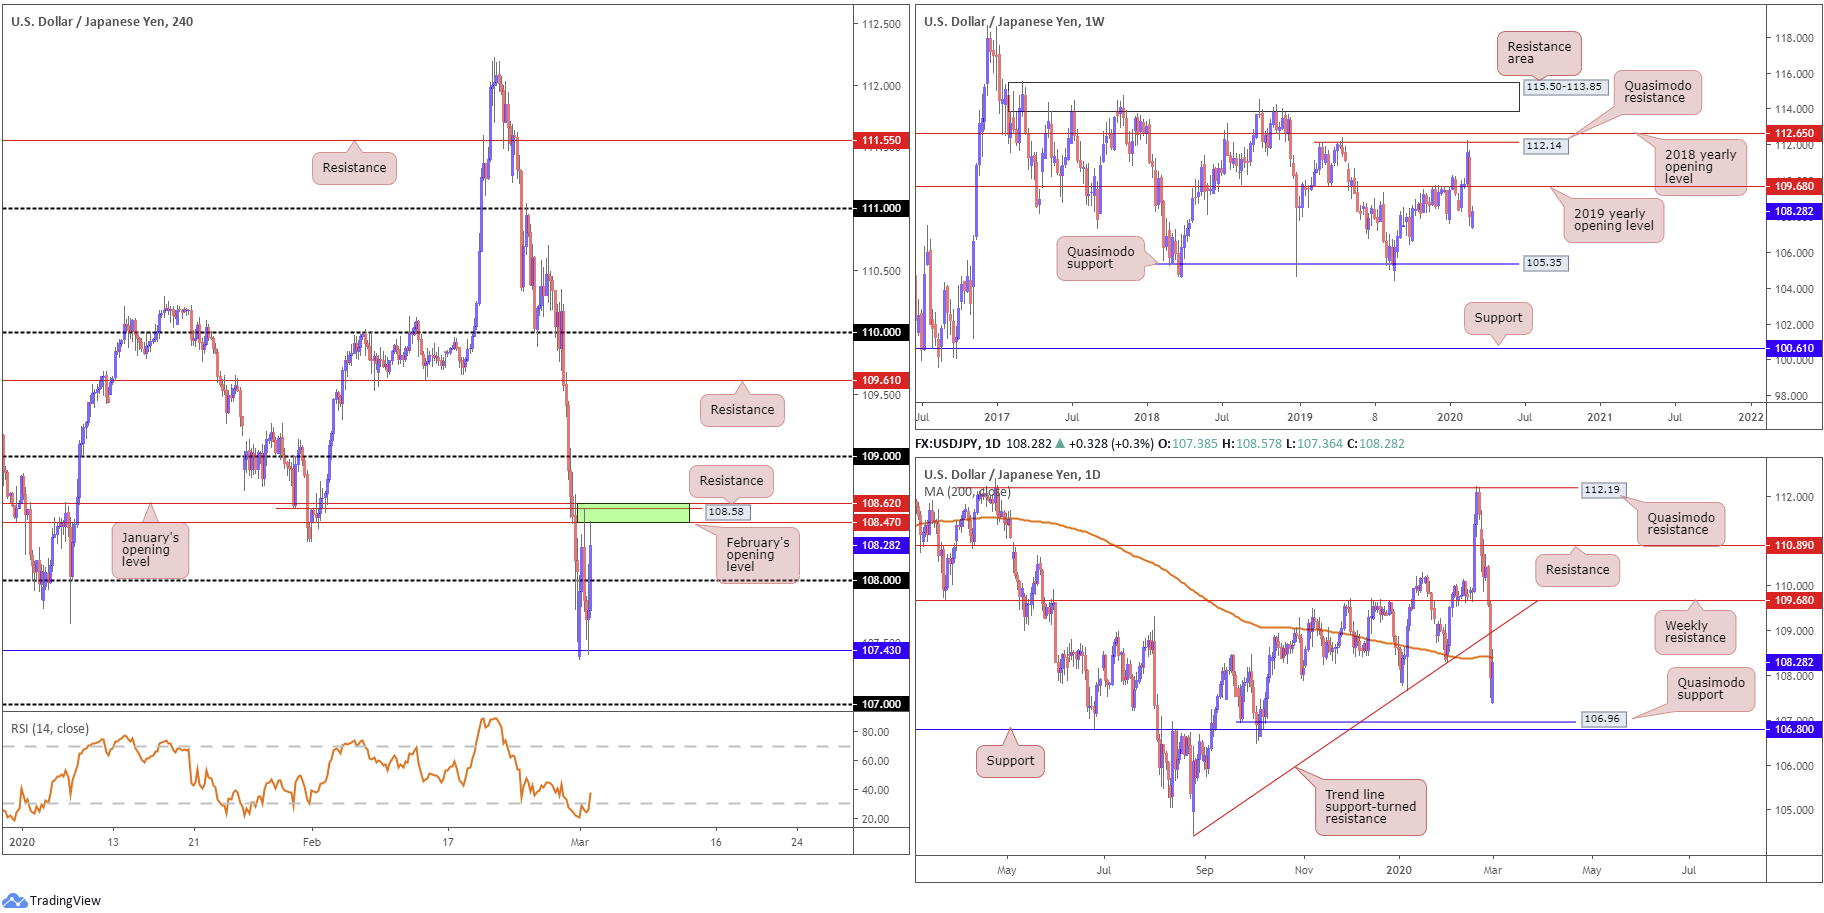
To the upside, a reasonably nice-looking area of resistance exists between 108.62/108.47 (green), comprised of January’s opening level at 108.62, resistance at 108.58 and February’s opening level at 108.47.
As evident from the charts, early Europe on Monday witnessed price action test 108.62/108.47, pulling back through 108. In recent hours, though, the unit recovered, reclaiming 108+ status and retesting the underside of the said resistance area. Mild H4 support at 107.43 appears to be withstanding downside attempts. Traders will also note the relative strength index (RSI) is seen recovering from oversold territory, currently trading at 38.62.
On a wider perspective, daily price, after leaving Quasimodo support at 106.96 unchallenged, is seen retesting the underside of the 200-day SMA (orange – 108.40), a noted upside resistance in Monday’s analysis.
The story on the weekly timeframe had price action record its largest weekly drop since July 2016 last week. Increased buying in this market could position price back at around the 2019 yearly opening level at 109.68. Aside from support possibly continuing to hold off the 107.65 January 8th low, the 106.48 September (2019) 30th low could be next on tap, with following support located around a Quasimodo formation off 105.35, in the event we drop lower.
Areas of consideration:
Seeing the 200-day SMA currently in the fight on the daily timeframe around the 108.40 region, the H4 resistance area at 108.62/108.47 could hold for a second retest.
The possibility of a drive back through 108 is certainly a possibility, with another run at H4 support from 107.43 on the cards, followed by the 107 handle.
Therefore, traders may seek bearish themes off 108.62/108.47 today.
USD/CAD:
Monday had the US dollar index add to losses, testing lows at 97.18, while WTI oil prices chalked up a decisive recovery, lifting firmly above $47/bbl. Collectively this guided USD/CAD lower, erasing more than 50% of last week’s upside.
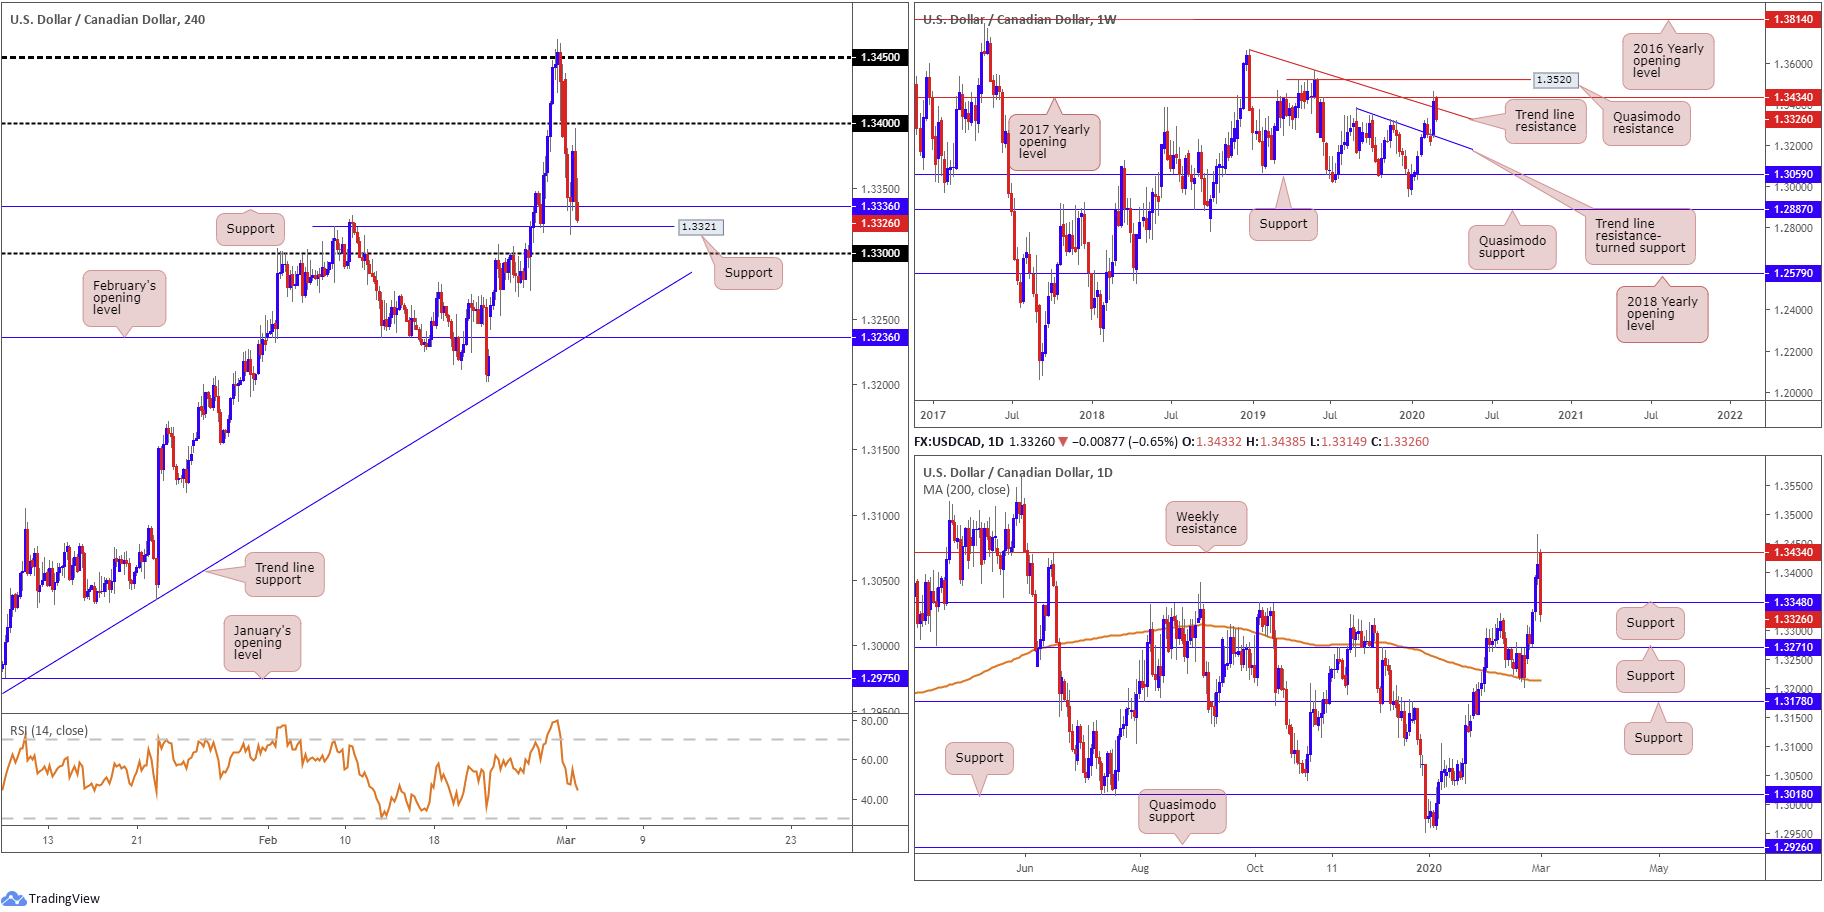
Recent selling hauled the H4 candles south of the 1.34 handle, and tested two layers of interesting support at 1.3321 and 1.3336, two previous Quasimodo resistance levels. 1.34 remains viable resistance on the H4 scale, whereas a break of the current supports has 1.33 in sight.
Technically, yesterday’s sell-off should not come as a surprise. We have weekly price testing trend line resistance, from the high 1.3664, and the 2017 yearly opening level at 1.3434. Daily price also formed a clear-cut shooting star pattern (considered a bearish indicator at peaks) off the 2017 yearly opening level mentioned above on the weekly timeframe at 1.3434.
As for support on the weekly timeframe, a local trend line resistance-turned support, pencilled in from the high 1.3382, may enter view, with a break of here possibly clearing the runway to support at 1.3059. Support at 1.3348 on the daily timeframe is under threat, potentially setting the stage for further selling towards daily support at 1.3271.
Areas of consideration:
Weekly price portends additional selling, as does daily price after overthrowing support at 1.3348. The problem arises on the H4 timeframe – the current H4 supports around 1.3336 and 1.3321, along with the round number 1.33, could hold price higher.
A H4 close beneath 1.33 has trend line support, extended from the low 1.2957, to target, shadowed closely by February’s opening level at 1.3236. Therefore, moves south of 1.33 could trigger seller interest today, in line with higher-timeframe flow.
USD/CHF:
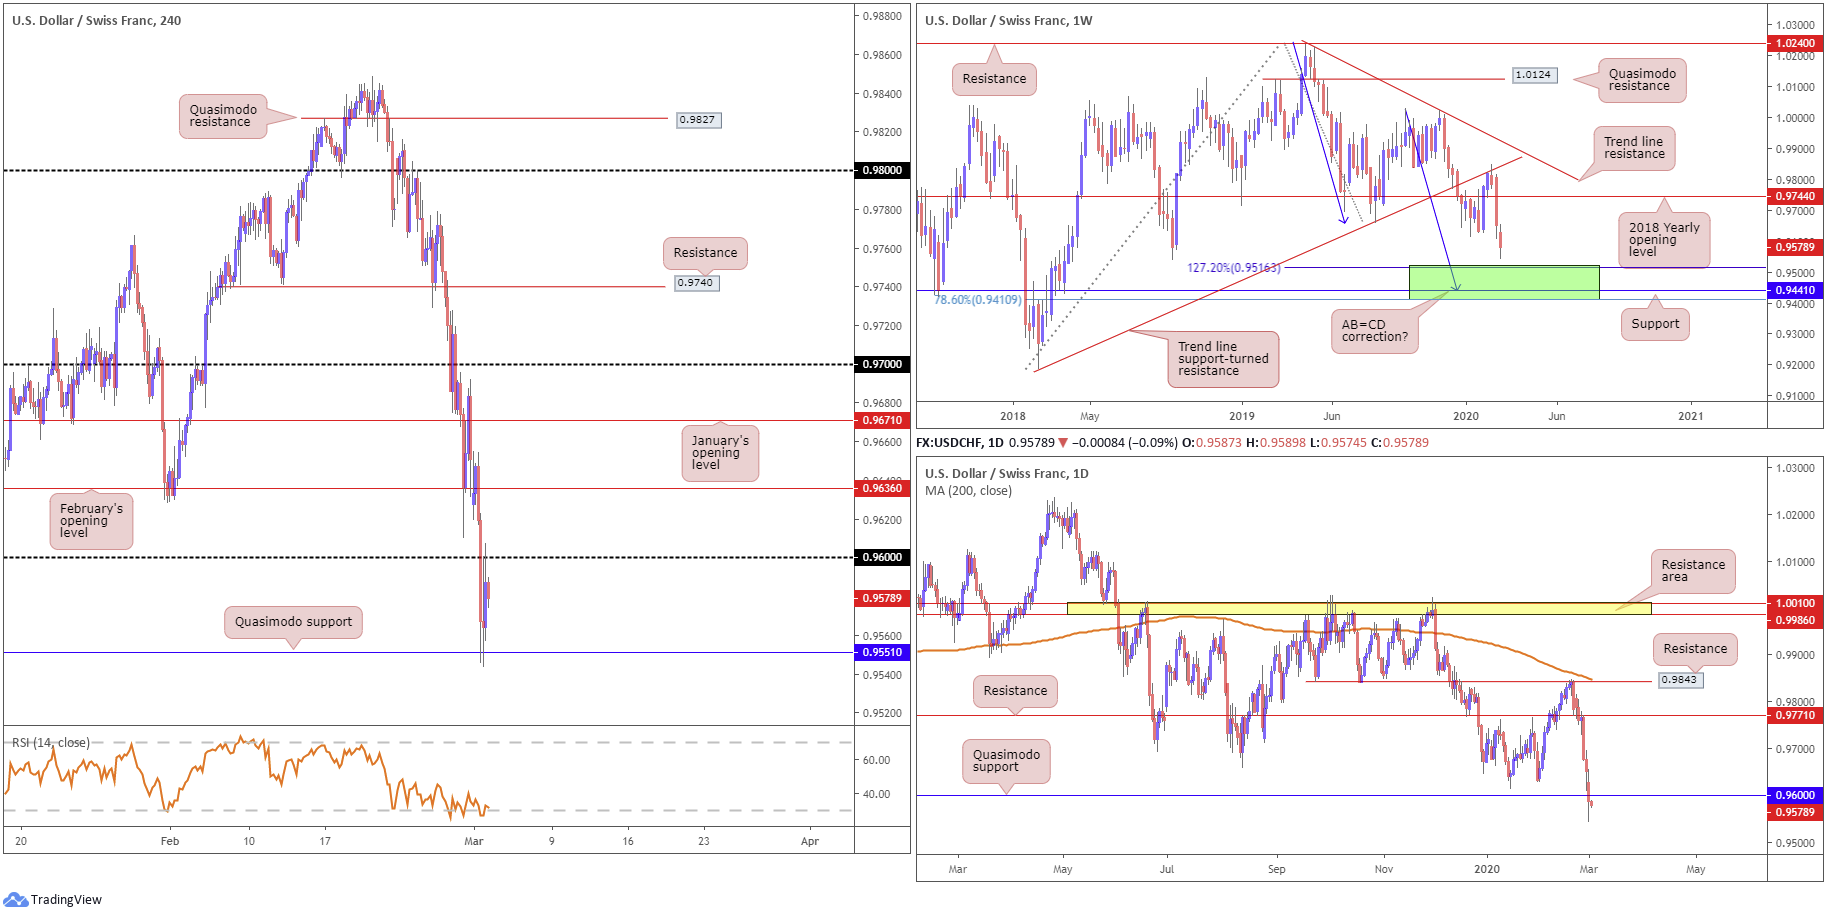
The broad US dollar index traded deep in the red Monday, extending losses from multi-year highs. This weighed on USD/CHF, with the candles seen closing in on the 0.9542 September 21st low (2018), seen clearer on the weekly timeframe. 0.9410/0.9516 offers potential support beyond the aforementioned low on the weekly timeframe (green) – comprised of a 78.6% Fibonacci retracement at 0.9410, support at 0.9441 and a 127.2% AB=CD bullish correction (black arrows) at 0.9516.
A closer reading of price action on the daily timeframe had the pair nudge through Quasimodo support at 0.9600 yesterday. Although never a good sign, the Quasimodo formation is not considered consumed until its extreme low is taken, which is set around the 0.9542 September 21st low (2018) mentioned above.
Across the page on the H4 timeframe, Quasimodo support at 0.9551 held price higher Monday, forcing a revisit at the underside of 0.96, which for the time being, is holding firm. Beyond 0.9551, we see little stopping the market from reaching 0.95; however, lets remain aware that the top edge of a weekly support area is seen at 0.9516, and the daily Quasimodo support at 0.9600 is effectively being retested as resistance on the H4 timeframe.
Areas of consideration:
In the event 0.96 holds today and we see further attacks on H4 Quasimodo support at 0.9551, its likely we’re headed for the weekly support area mentioned above at 0.9410/0.9516.
Moves lower from current price could come to fruition off 0.96, though the threat of buying is there from daily Quasimodo support. On the other side of the coin, weekly traders might want to whipsaw through the 0.9542 September 21st low (2018) to run stops and use liquidity to recover from weekly support at 0.9410/0.9516.
Dow Jones Industrial Average:
US equities staged an impressive recovery Monday, fuelled by expectations policy makers will move to cushion the impact of the COVID-19 outbreak. This follows last week’s precipitous decline of more than 11%. The Dow Jones Industrial Average added 1293.96 points, or 5.09%; the S&P 500 advanced 136.01 points, or 4.60% and the tech-heavy Nasdaq 100 ended higher by 416.14 points, or 4.92%.
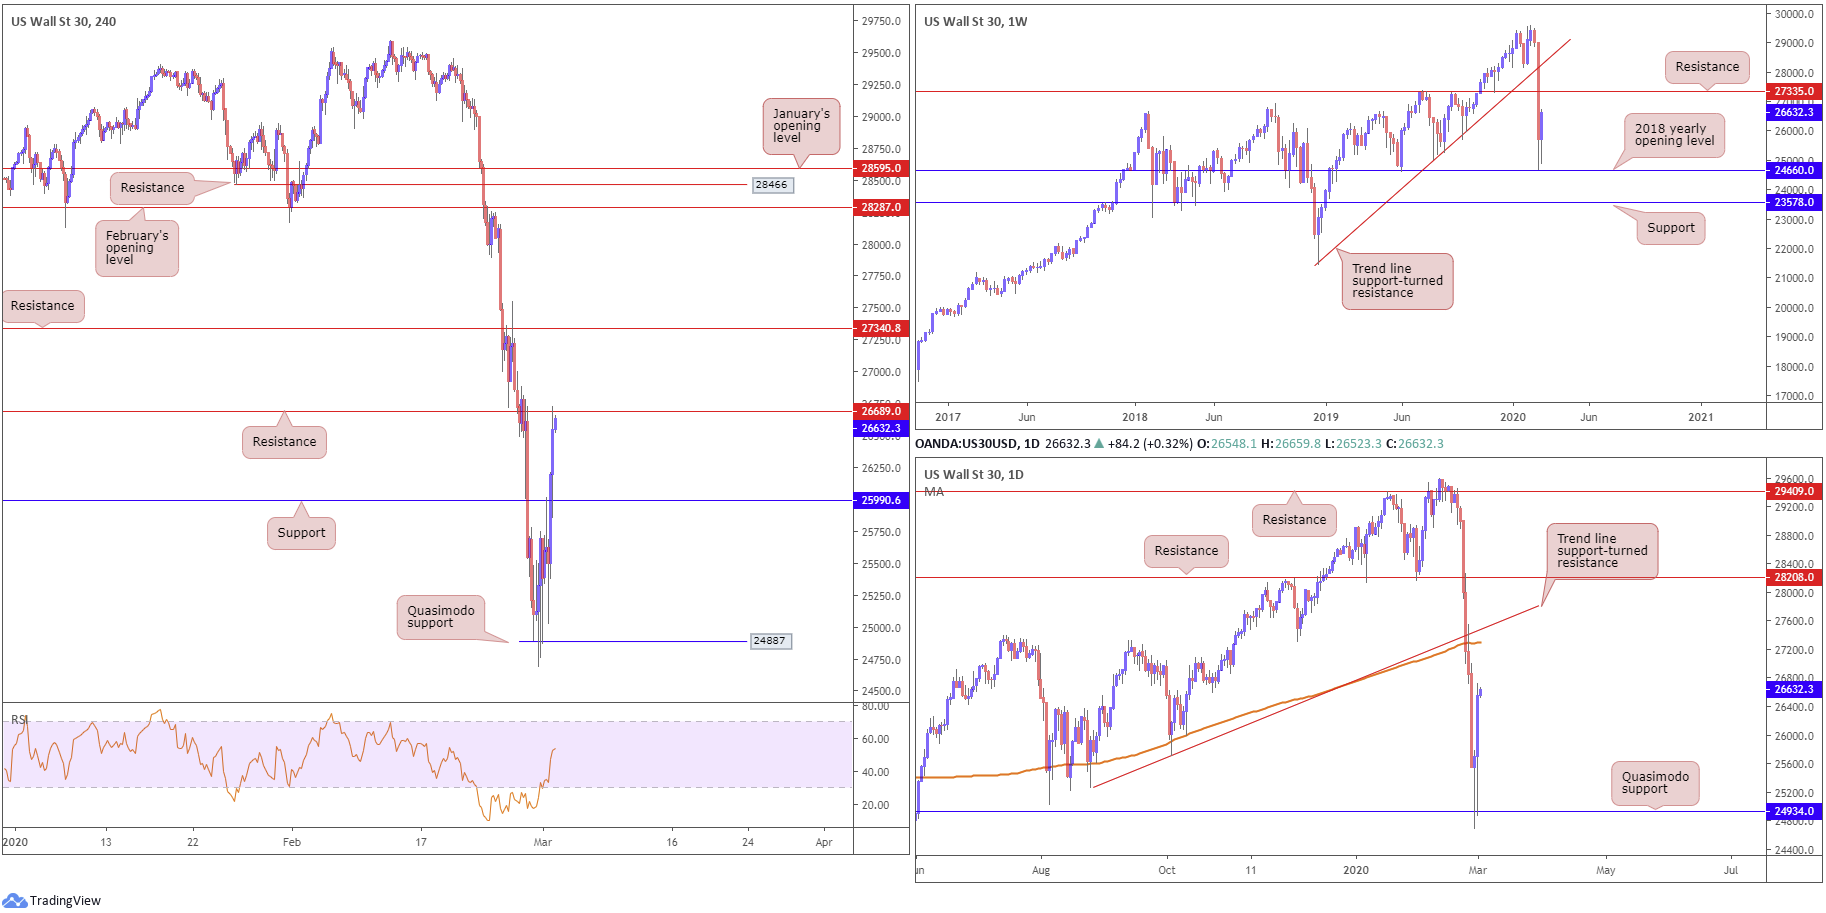
Technically, from the weekly timeframe we saw price bottom a few points north of the 2018 yearly opening level at 24660. Yesterday actually scored its biggest one-day percentage gain in nearly 11 years north of here. Continued bidding could see resistance enter the mix at 27335.
A closer reading of price action on the daily timeframe has the unit extending gains north of Quasimodo support drawn in at 24934. Resistance on this scale is not expected to develop until reaching the 200-day SMA (orange – 27298), closely followed by trend line support-turned resistance, taken from the low 25264.
Monday on the H4 timeframe retested resistance at 25990 and held in the early hours of the session, though after bottoming off lows at 25024, the said resistance gave way and price went on to cross paths with another layer of resistance at 26689. In terms of the relative strength index (RSI), we recently crossed above 50.00.
Areas of consideration:
The current H4 resistance at 26689 offers little in terms of supporting confluence, both locally and from the higher timeframes. The more appealing resistance on the H4 timeframe resides around 27340. Not only does it boast strong history, it converges closely with weekly resistance at 27335 and daily resistances, the 200-day SMA and the trend line support-turned resistance.
According to chart studies, therefore, traders may trigger long entries above 26689, and consider fading H4 resistance at 27340.
XAU/USD (GOLD):
Monday had the yellow metal modestly recover to a session high of 1610.9, though wrapped up the day pretty much unchanged after fading highs into US hours.
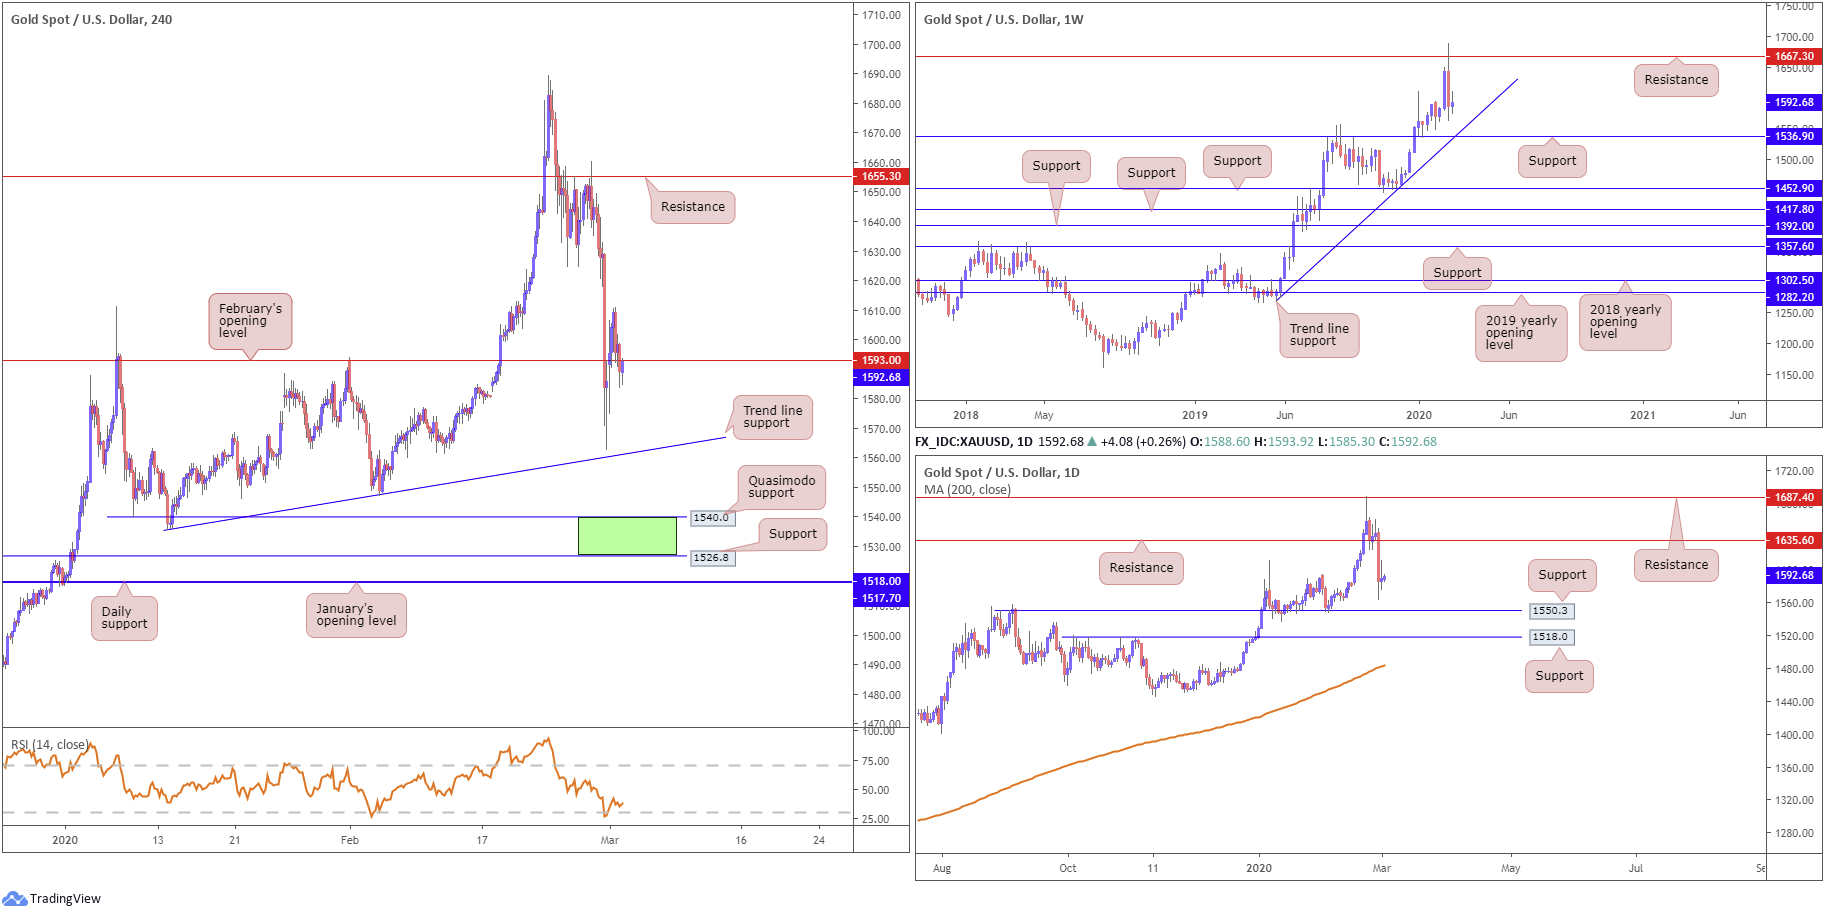
H4 price is seen trading back beneath February’s opening level at 1593.0, after fleeting moves north of the base yesterday. Trend line support, taken from the low 1536.0 is fixed as the next downside target on the H4 timeframe. Beyond this level, though, we can see Quasimodo support at 1540.0, followed by support at 1526.8. Also of interest is the relative strength index (RSI) recently exiting oversold ground, modestly gaining off lows at 25.66.
The weekly timeframe reveals last week concluded in the shape of a bearish outside candle pattern, capped by resistance at 1667.3, and shed more than $55 by the close. Trend line support, drawn from the low 1269.6, along with support plotted at 1536.9, represent potential downside targets on this timeframe. A break of the said levels has support at 1452.9 to target.
On the daily timeframe, support at 1550.3 is seen as a possible floor in this market, with a break highlighting support nearby at 1518.0. Resistance remains at 1635.6, and you will note the 200-day SMA has drifted north since early 2019.
Areas of consideration:
The green area marked on the H4 timeframe between 1526.8/1540.0 represents a potential support zone. Although the outer perimeters form by way of H4 supports, within holds the weekly support level mentioned above at 1536.9 and the converging trend line support. Despite the confluence, a fakeout through the area to daily support at 1518.0 may occur, which, as you can see, fuses with January’s opening level at 1517.7.
Traders are also urged to pencil in the possibility of daily support at 1550.3 holding price higher this week.
The accuracy, completeness and timeliness of the information contained on this site cannot be guaranteed. IC Markets does not warranty, guarantee or make any representations, or assume any liability regarding financial results based on the use of the information in the site.
News, views, opinions, recommendations and other information obtained from sources outside of www.icmarkets.com.au, used in this site are believed to be reliable, but we cannot guarantee their accuracy or completeness. All such information is subject to change at any time without notice. IC Markets assumes no responsibility for the content of any linked site.
The fact that such links may exist does not indicate approval or endorsement of any material contained on any linked site. IC Markets is not liable for any harm caused by the transmission, through accessing the services or information on this site, of a computer virus, or other computer code or programming device that might be used to access, delete, damage, disable, disrupt or otherwise impede in any manner, the operation of the site or of any user’s software, hardware, data or property.


