
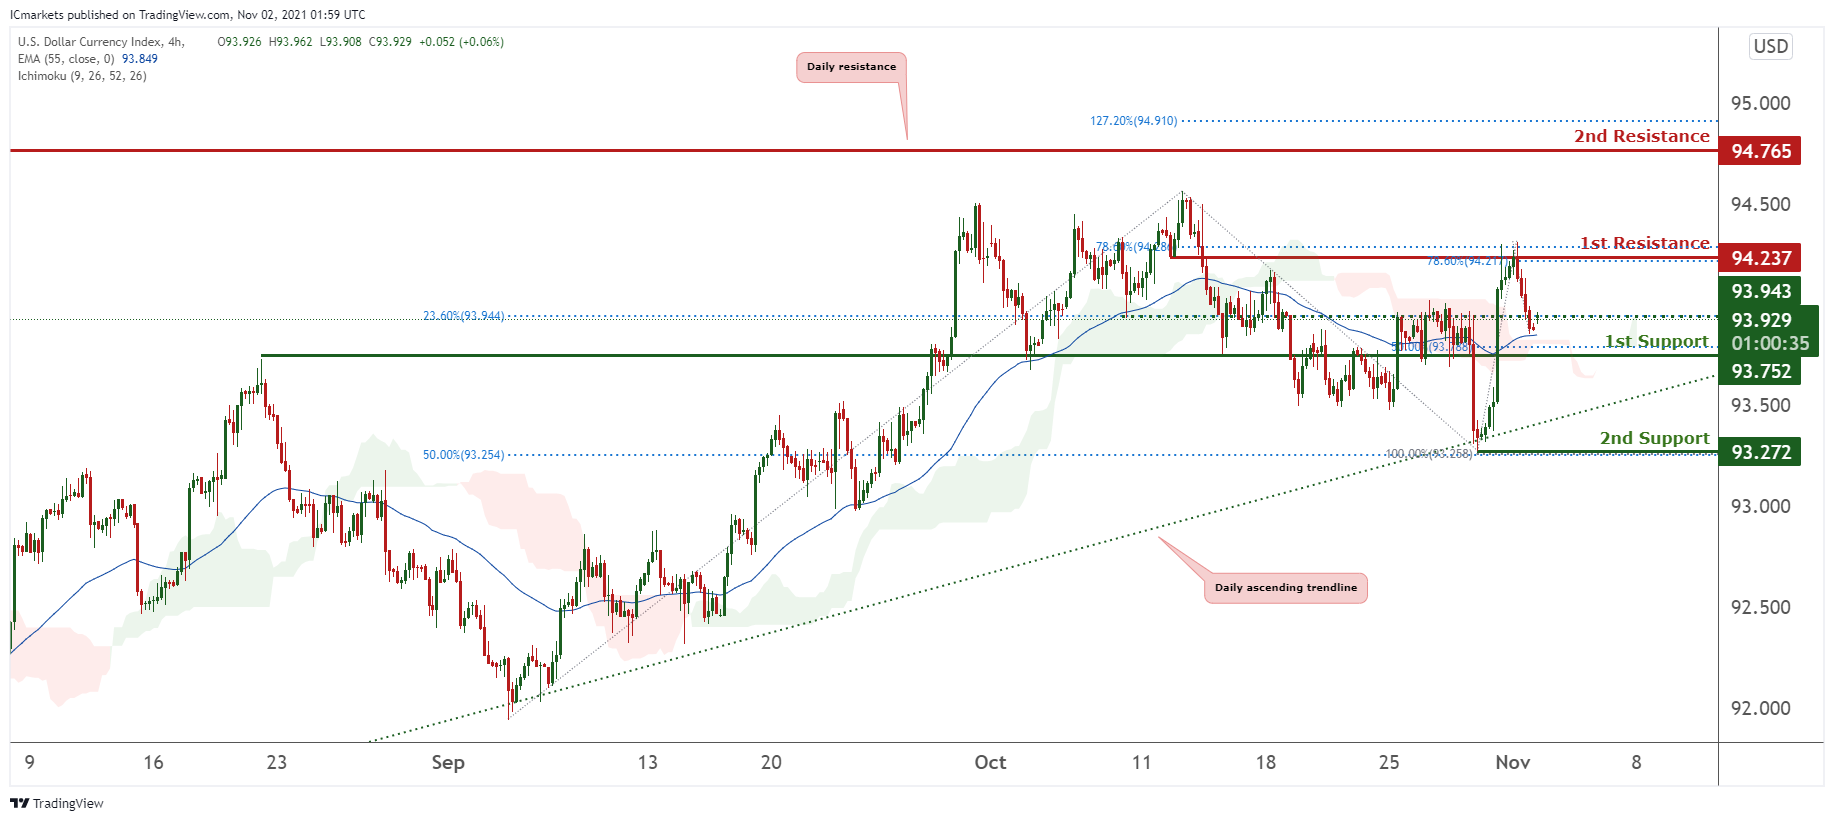
DXY:
On the H4 timeframe, prices are on a bullish momentum. We would watch our intermediate support at 93.929 in line with 23.6% Fibonacci retracement for potential reversals. Breaking that level will find prices dipping towards our 1st support at 93.752 in line with 50% Fibonacci retracement. Technical indicators are showing bullish momentum. Alternatively, prices might climb towards our 1st resistance at 94.237 in line with 78.6% Fibonacci retracement.
Areas of consideration:
- H4 time frame, 1st resistance at 94.237
- H4 time frame, intermediate support at 93.929
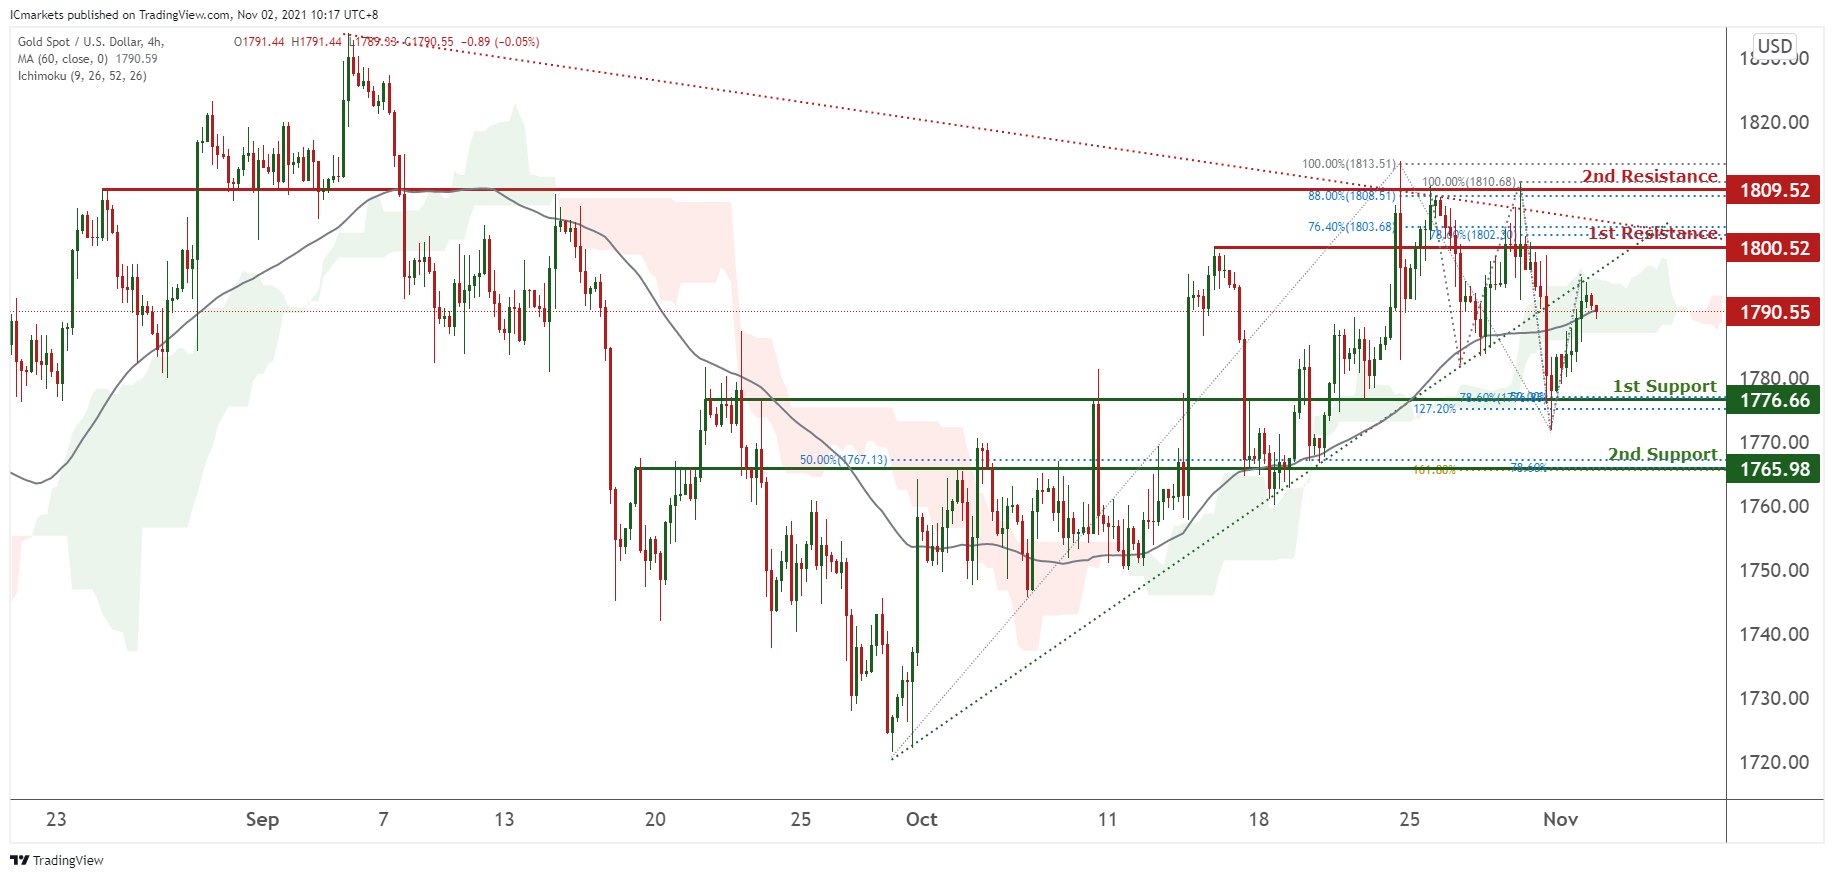
XAU/USD (GOLD):
On the H4 chart, prices have recently broken our triangle and are on a bearish momentum. We see the possibility of prices dipping towards our 1st support at 1776.66 in line with 127.2% Fibonacci extension and 38.2% Fibonacci retracement. Technical indicators are showing bearish momentum. Alternatively, prices might climb higher towards our 1st resistance at which is an area of Fibonacci confluences.
Areas of consideration:
- 4h 1st support at 1776.66
- 4h 1st resistance at 1800.52
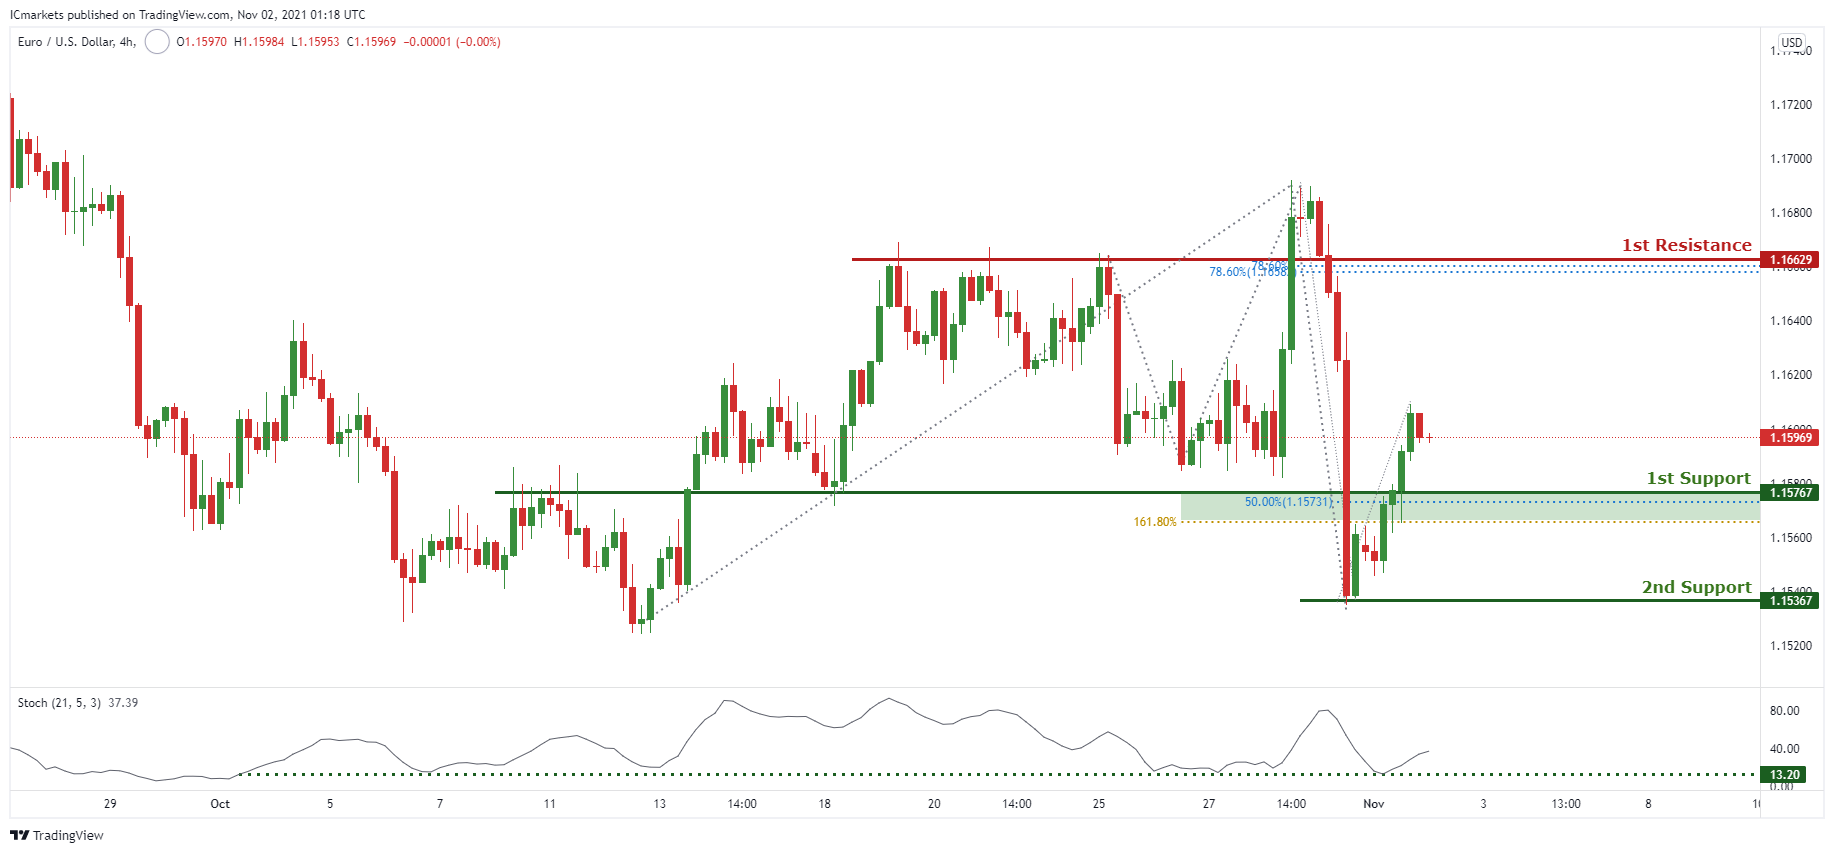
EUR/USD:
On the H4 chart price is near the first support level of 1.15767 which is also 50% Fibonacci retracement and 161.8% Fibonacci projection. Price can then potentially bounce from the first support to the first resistance of 1.16629 which is 78.6% Fibonacci projection and 78.6% Fibonacci retracement. Alternatively if price were to break the first support, it can potentially go to the second support level of 1.15367. Our bullish bias is supported by the stochastic which is near the support level.
Key considerations :
- Watch first support 1.15767
- Watch first resistance 1.16629
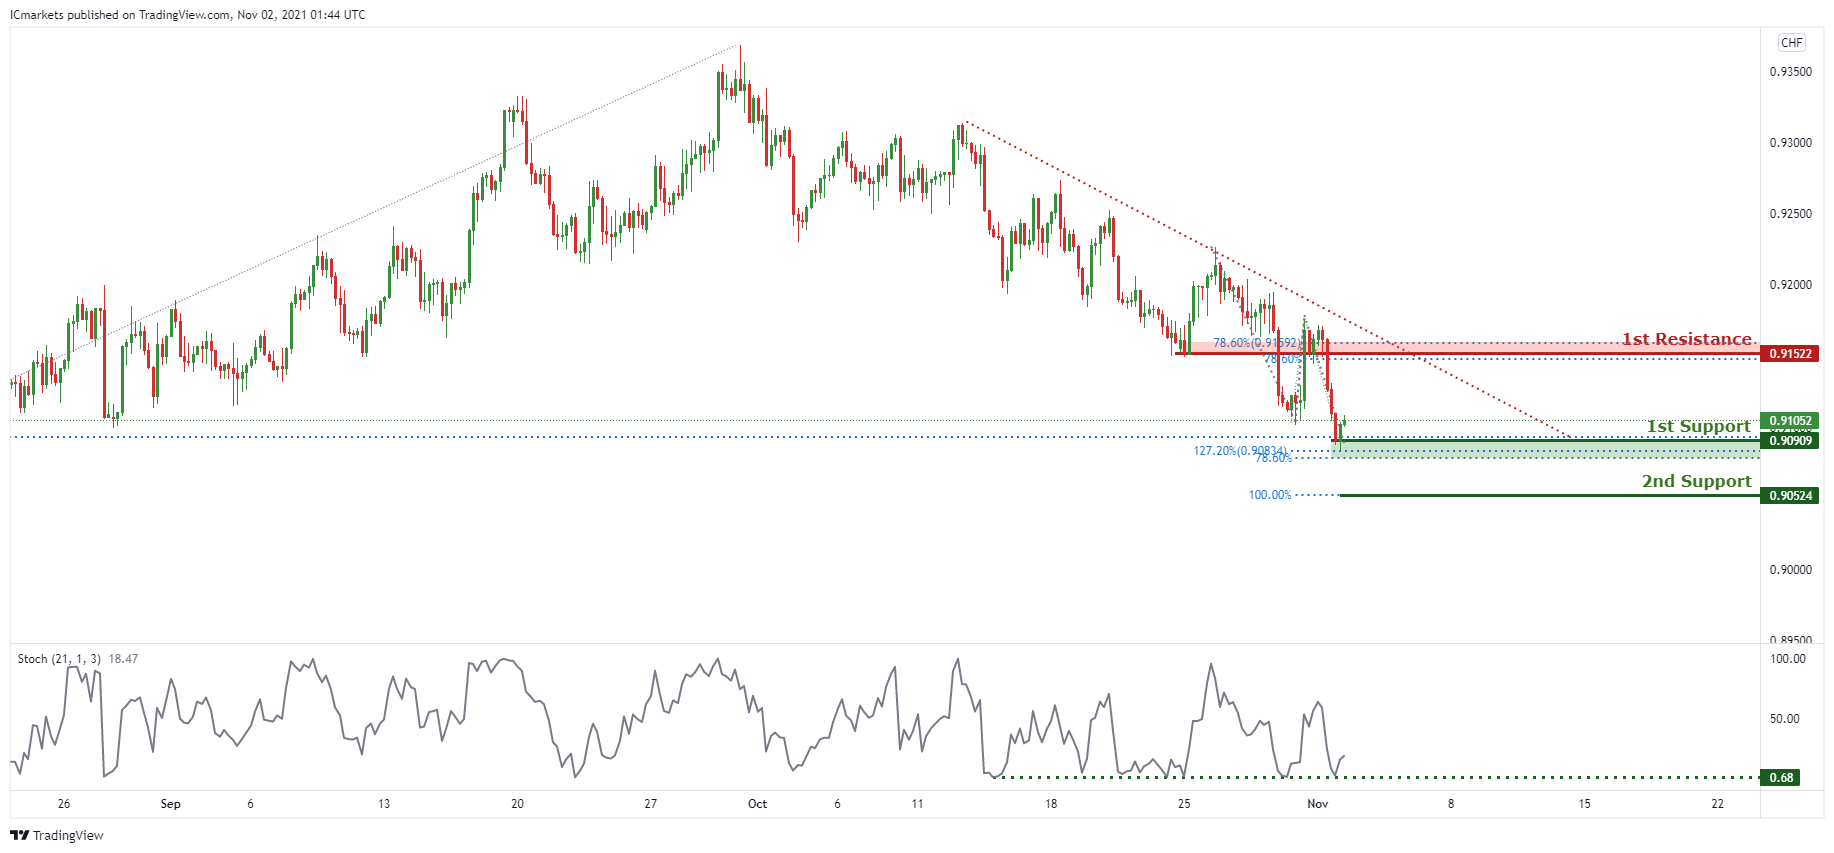
USD/CHF:
In reference to yesterday’s analysis, price indeed dropped to the 1st support at 0.91039. We can now expect price to make a short-term bullish bounce from 1st support in line with 127.2% Fibonacci retracement and 78.6% Fibonacci projection towards the 1st Resistance in line with 78.6% Fibonacci projection and 78.6% Fibonacci retracement. Our short-term bullish bias is further supported by the stochastic %K line where the it bounced off the support level.
Areas of consideration:
- Watch 1st Support at 0.90909
- Watch 1st Resistance at 0.91522
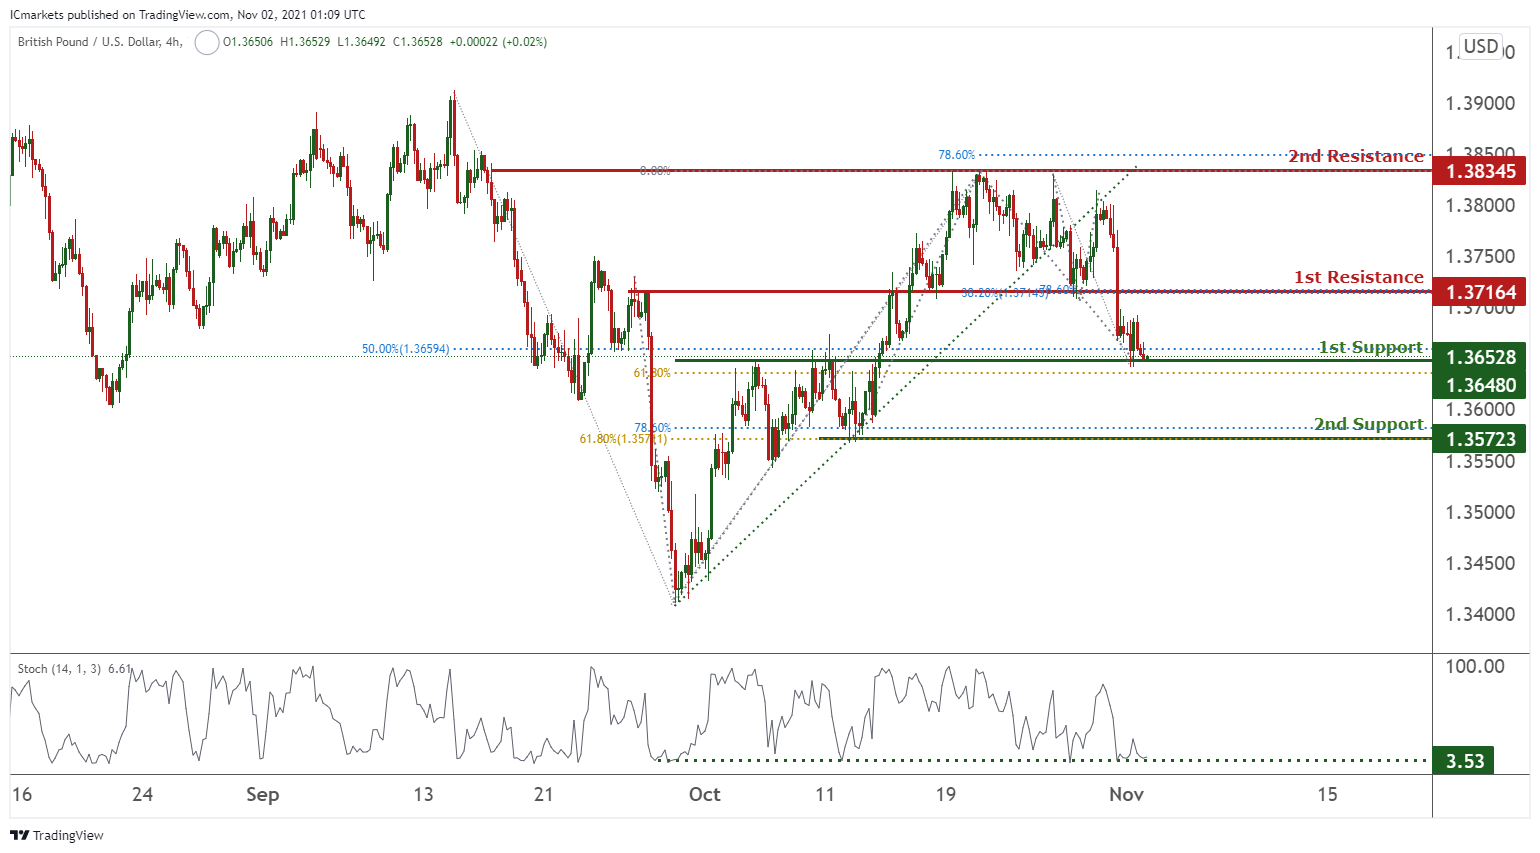
GBP/USD:
On the H4 chart price is at first support level of 1.36480 which is 50% Fibonacci retracement and 61.8% Fibonacci projection. Price can potentially go to the first resistance of 1.37164 which is also 38.2% Fibonacci retracement and 78.6% Fibonacci projection. Alternatively if price were to break the first support level, it may dip to the 2nd support level of 1.35723 which is also 78.6% Fibonacci projection and 61.8% Fibonacci retracement. Our bullish bias is further supported by stochastic as it is near the support level.
Areas of consideration
H4 first support – 1.36480
H4 first resistance 1.37164
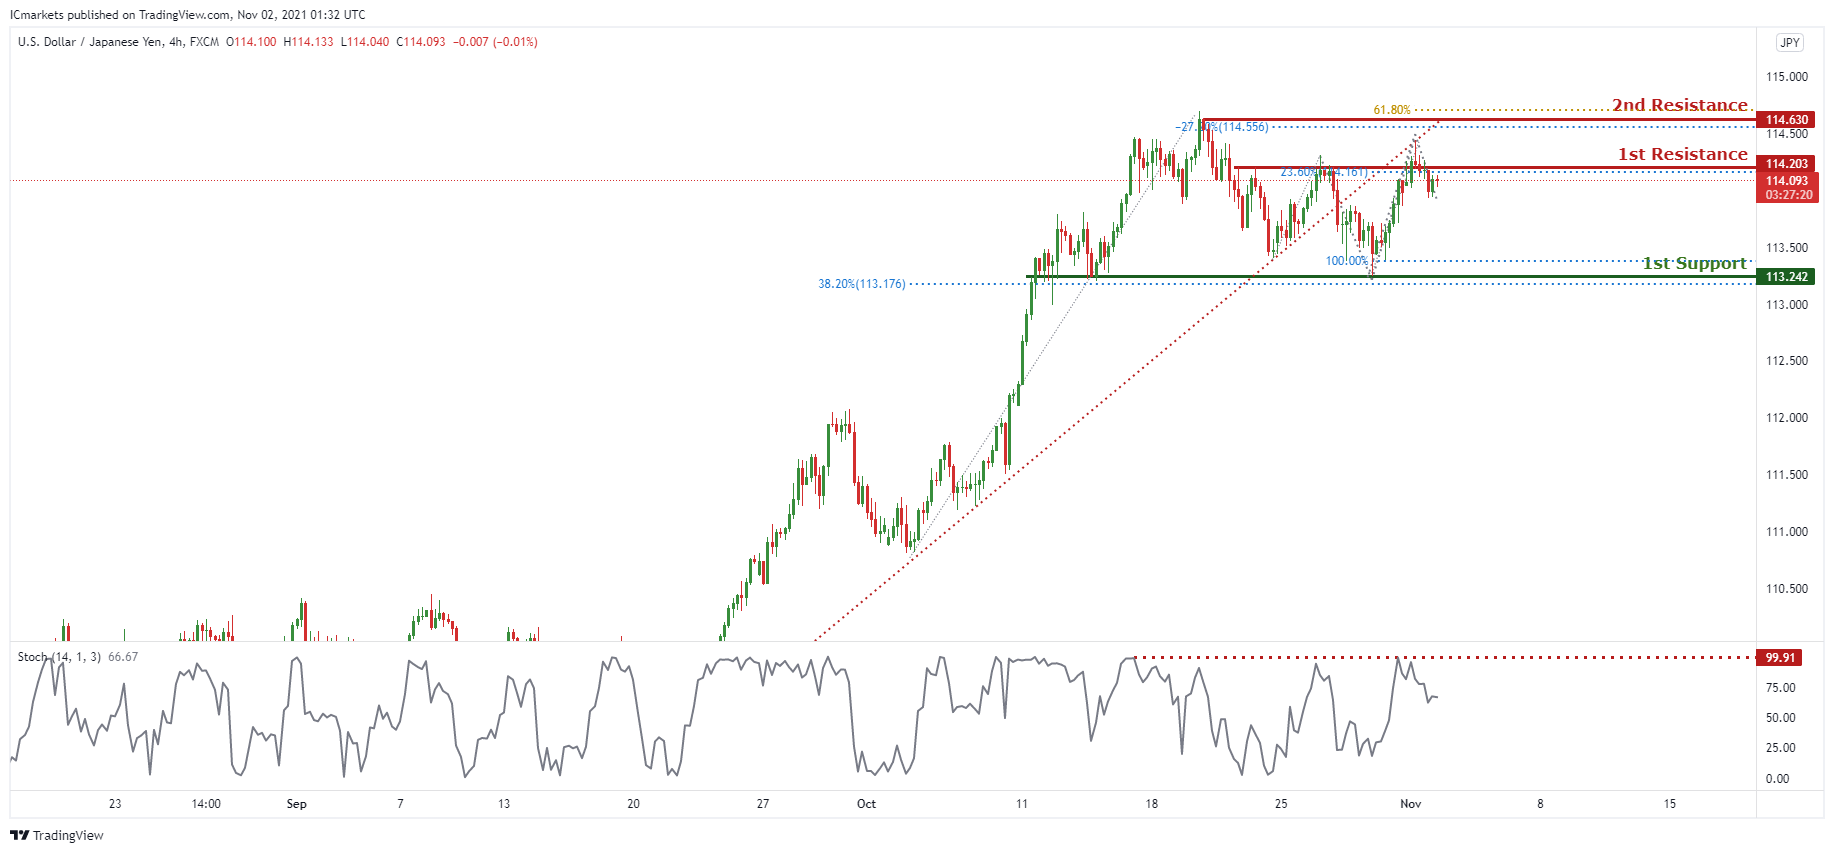
USD/JPY
On the H4 timeframe, price broke out of the ascending trendline support showing an overall bearish momentum. We are expecting price to drop from the 1st resistance in line with 23.6% Fibonacci retracement towards the 1st Support in line with 38.2% Fibonacci projection and 100% Fibonacci projection. Our bearish bias is further supported by the stochastic indicator where the %K line touched the resistance level.
Areas of consideration:
- H4 1st resistance level 114.203
- H4 1st support level 113.242
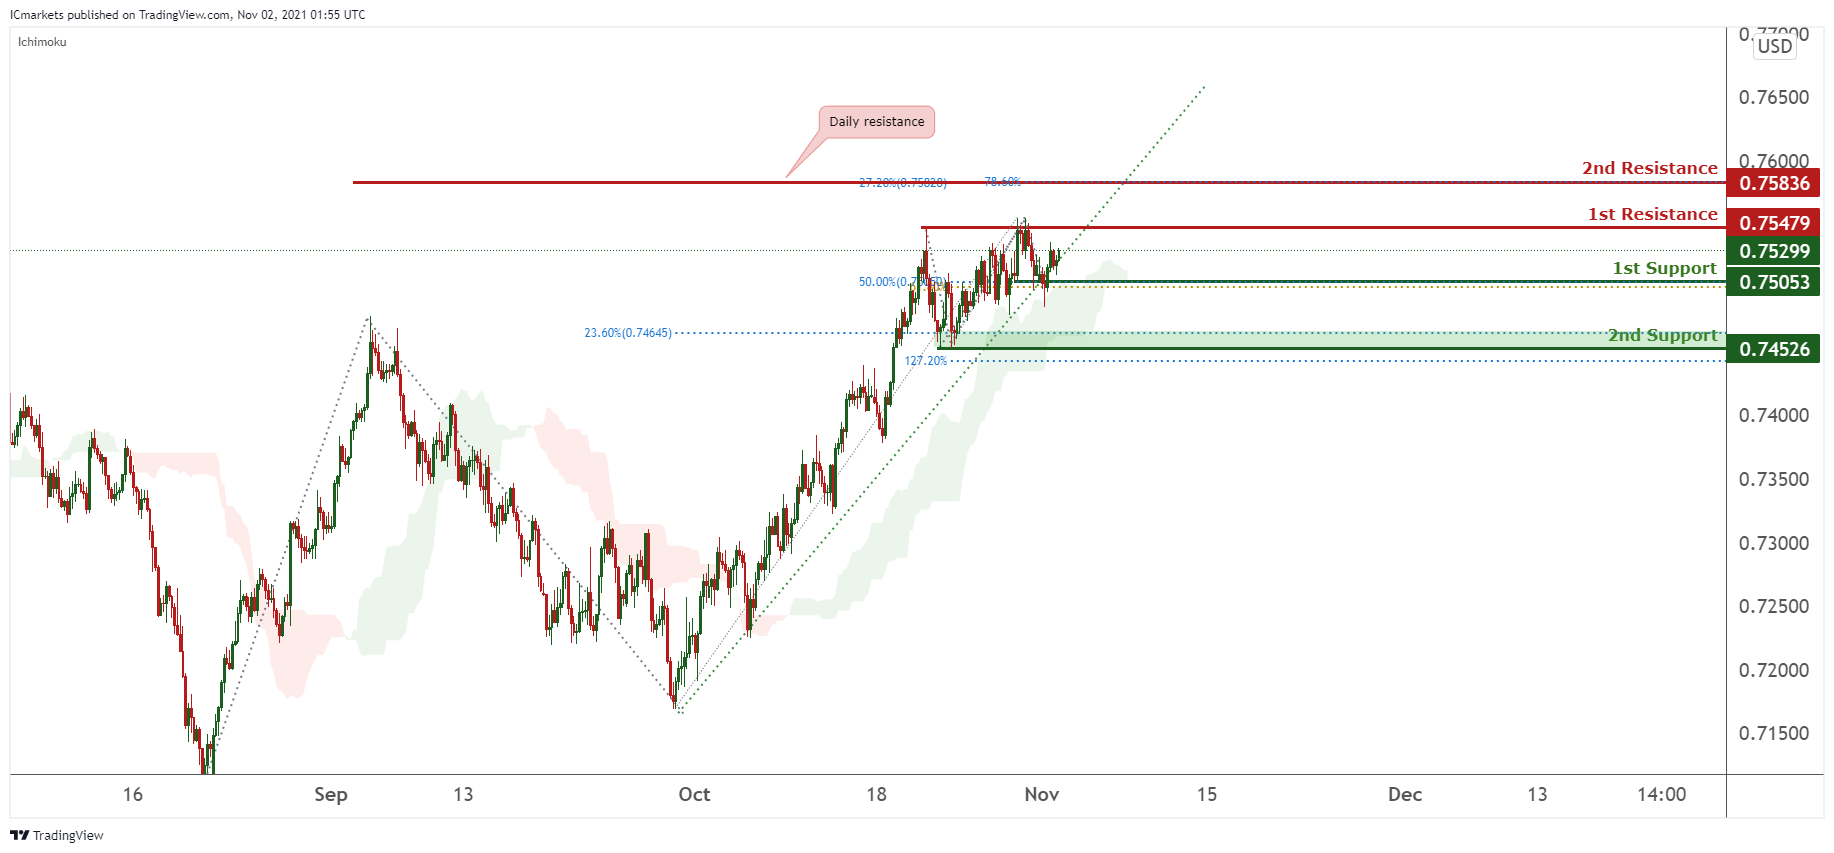
AUD/USD:
On the H4, in reference to yesterday’s analysis, price indeed bounced at the 1st Support and now approaching the 1st Resistance. We can now expect the price to reach the 1st Resistance in line with the previous swing high. Traders can hold on and wait for the price to swing higher before getting into the entry.
Areas of consideration:
- H4 1st resistance level 0.75479
- H4 1st support level 0.75053
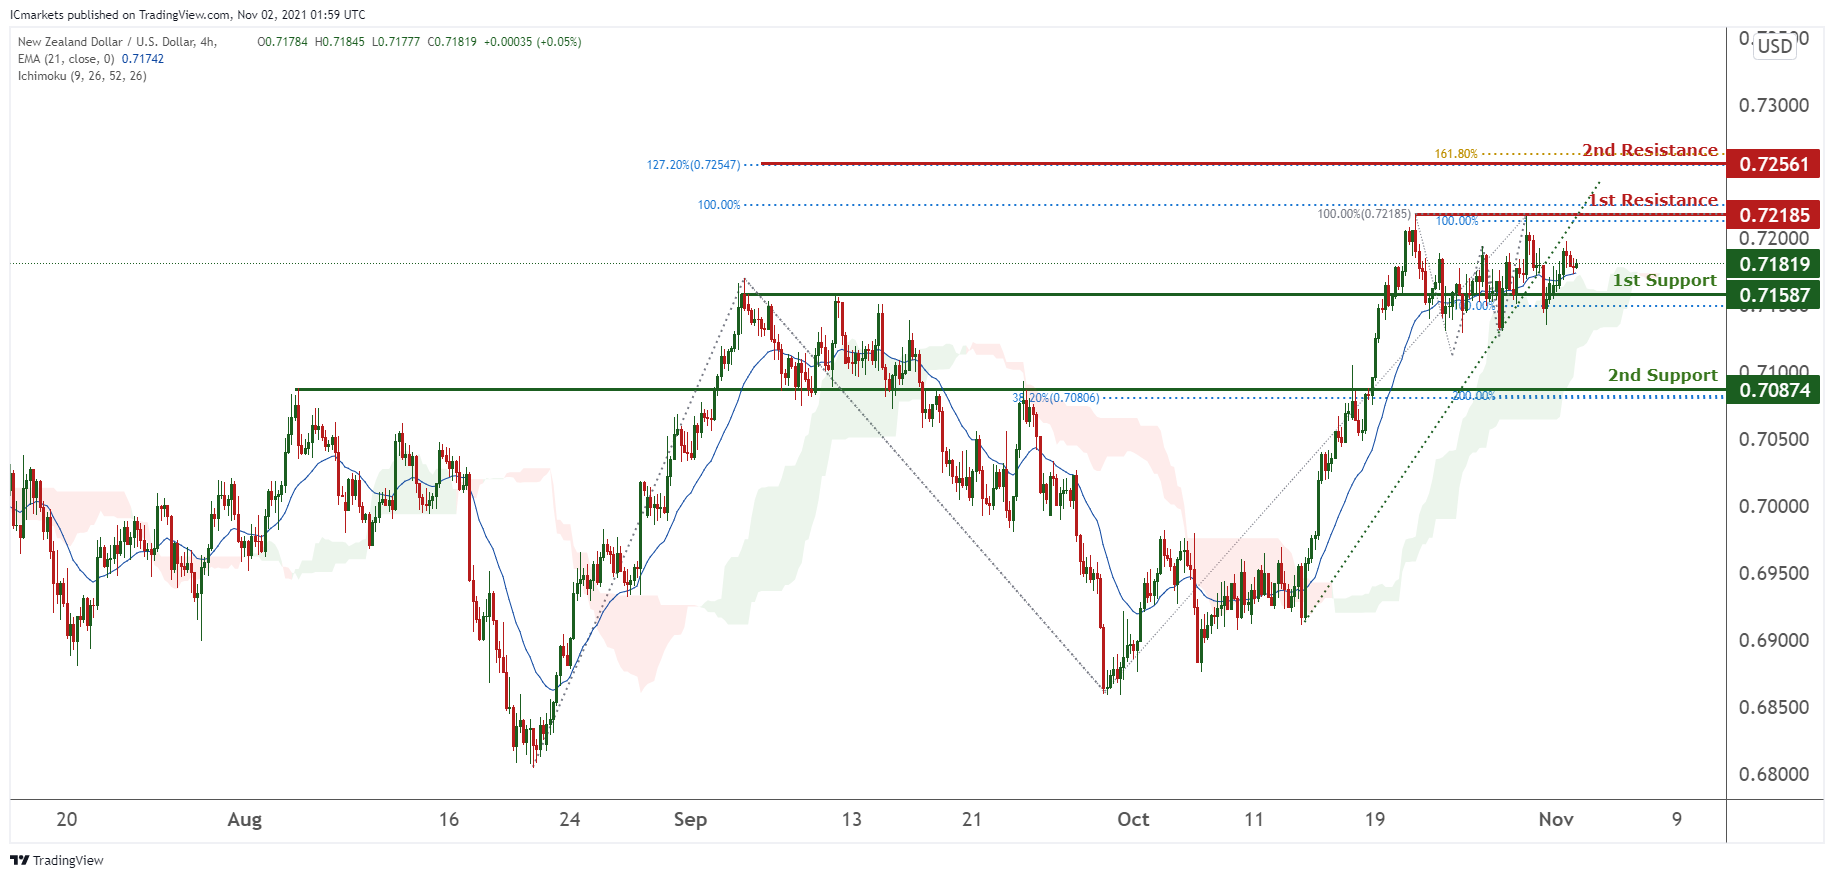
NZD/USD:
On the H4 timeframe, prices are on a bullish momentum and are currently hovering around our 1st support at 0.71565 in line with 50% Fibonacci retracement. We see the potential for prices to climb higher towards our 1st resistance at 0.72185 in line with 100% Fibonacci extension. Technical indicators showing bullish momentum. Alternatively, prices might dip towards our 2nd support at 0.70874 in line with 38.2% and 50% Fibonacci retracement.
Areas of consideration:
- H4 time frame, 1st resistance at 0.72185
- H4 time frame, 1st support at 0.71565
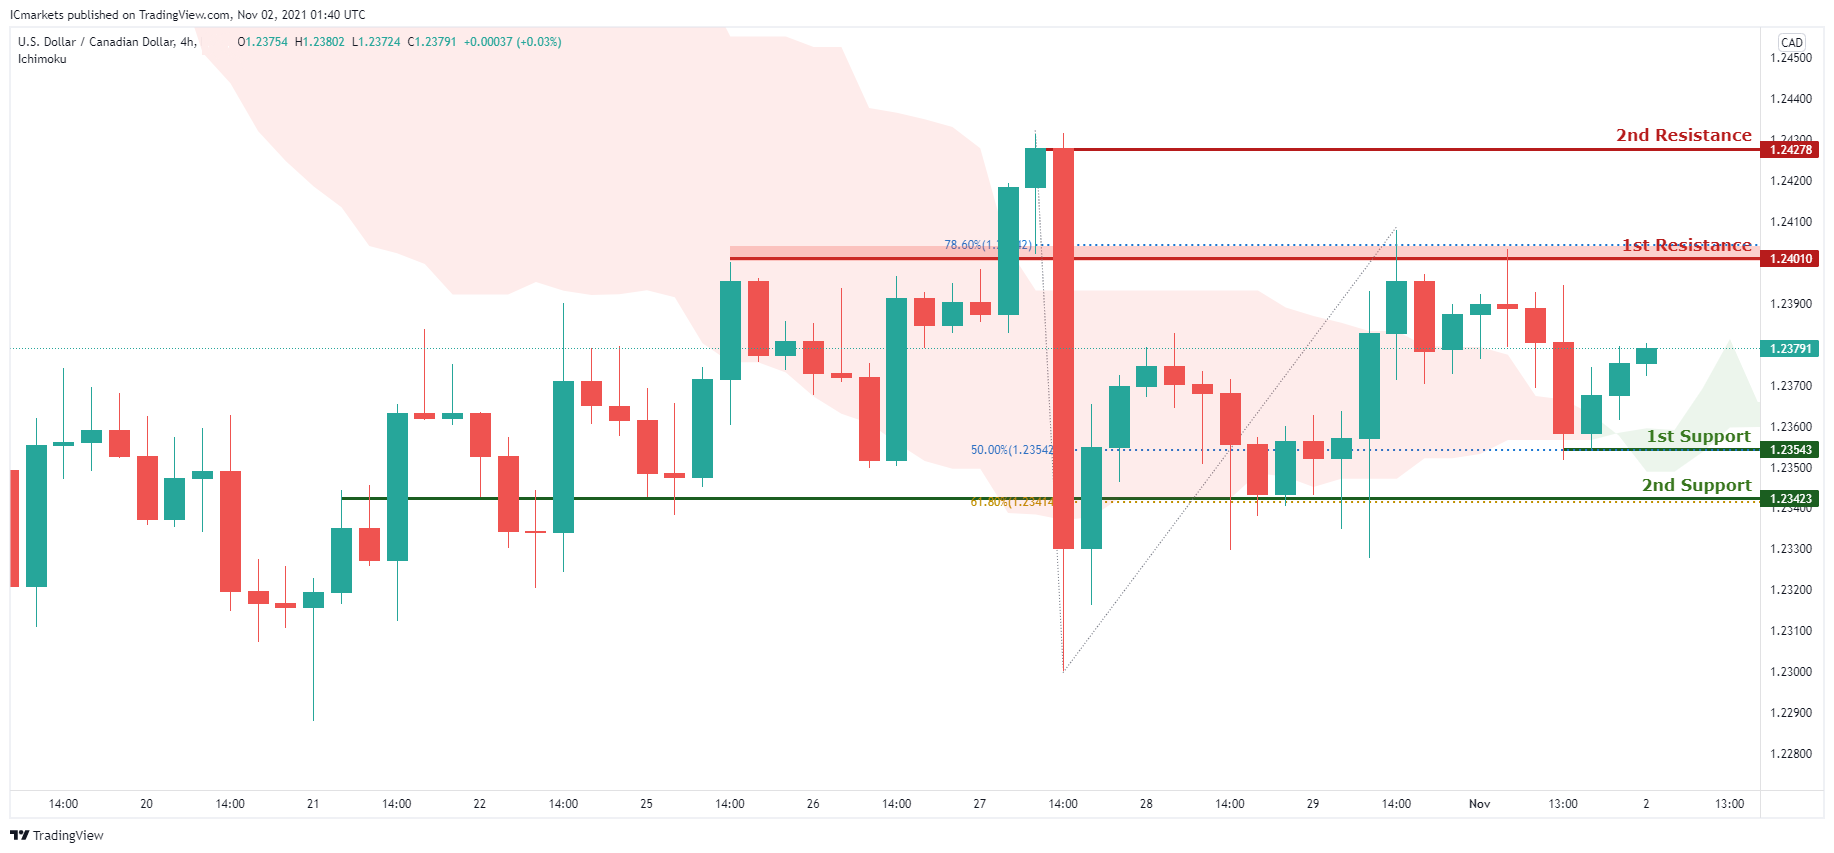
USD/CAD:
On the H4, with price breaking the ichimoku cloud which indicates a bullish momentum, we are expecting to see price rise to 1st resistance at 1.24010 in line with the 78.6% Fibonacci retracement from 1st support at 1.23557 in line with the 50% Fibonacci retracement levels. Price may possibly rise to 2nd resistance at 1.24278 in line with the graphical swing high resistance. However, a dip from 1st resistance may be more likely due to the strong overlap resistance in the area. Alternatively, we may see price dip to 1st support at 1.23557 in line with the 50% Fibonacci retracement and graphical swing low support and possibly even to 2nd support at 1.23423 in line with the 61.8% Fibonacci retracement level and graphical swing low support.
Areas of consideration:
- H4 time frame, support at 23557
- H4 time frame, resistance at 24010
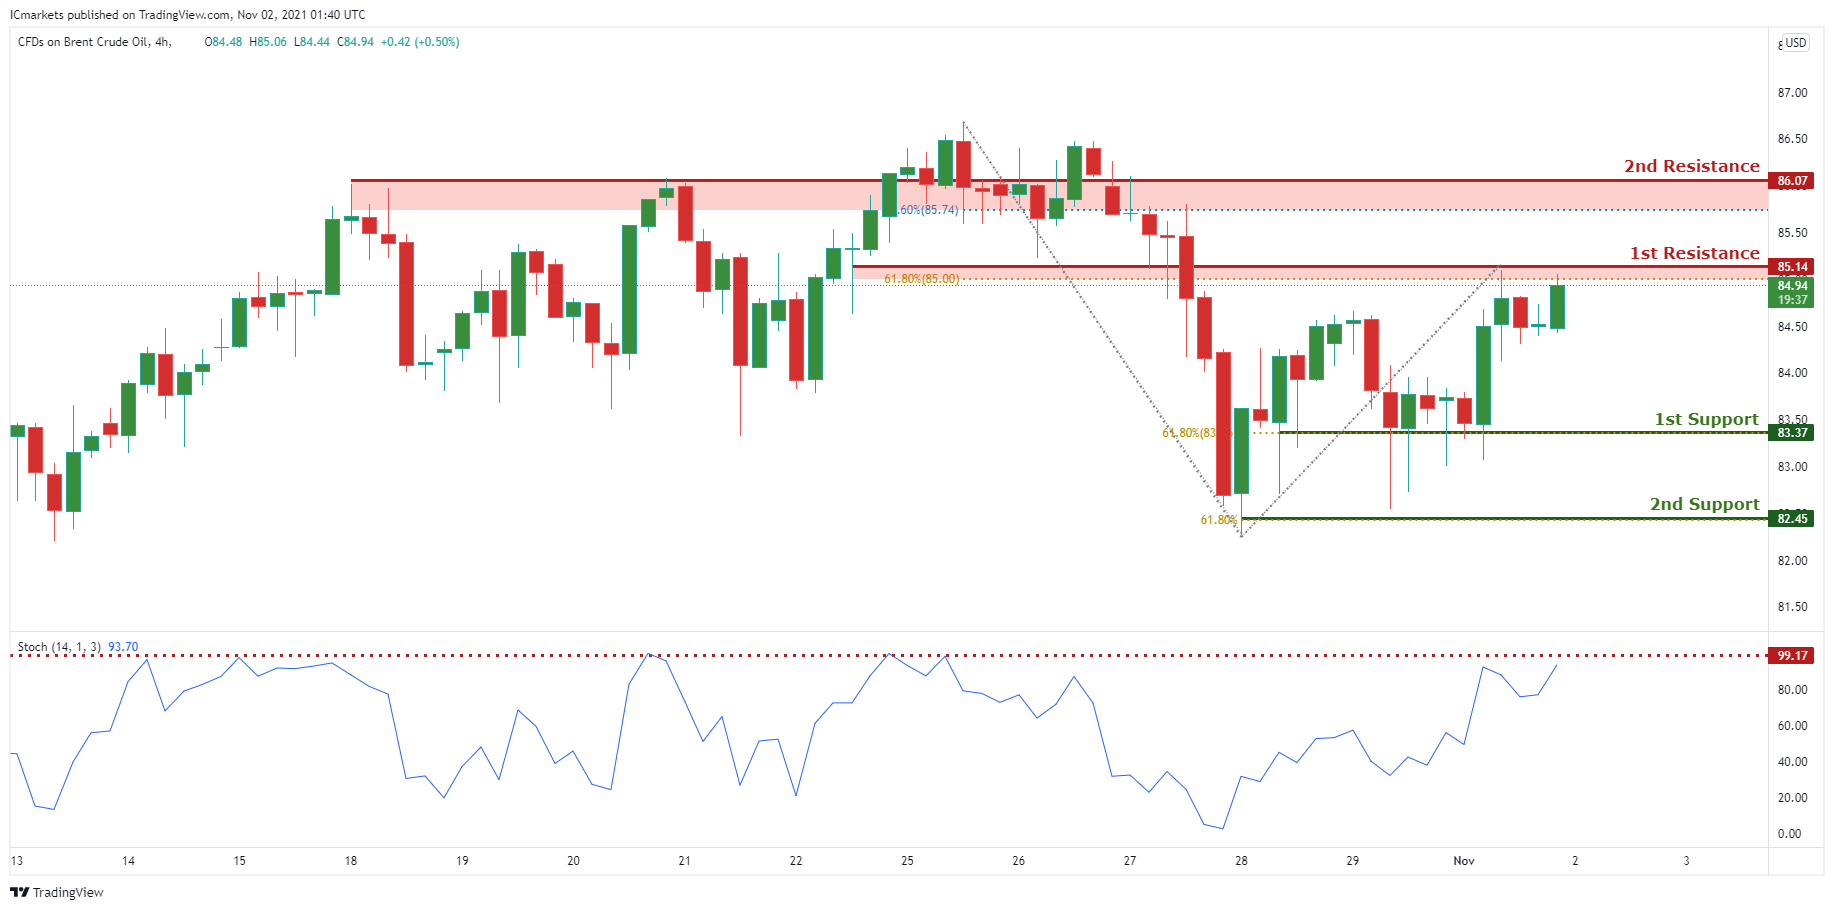
OIL:
On the H4 timeframe,with price reaching the resistance on the stochastics indicator, we are expecting a bearish dip to 1st support at 83.37 in line with our horizontal swing low support and 61.8% Fibonacci retracement level and possibly our 2nd support at 82.45 in line with our 61.8% Fibonacci extension levels and graphical swing low support. Alternatively, price may break 1st resistance structure at 85.14 in line with the 61.8% Fibonacci retracement and head for 2nd resistance at 86.07 which is in the area of the 78.6% Fibonacci retracement area.
Areas of consideration:
- H4 time frame, 1st resistance of 14
- H4 time frame, 1st support of 37
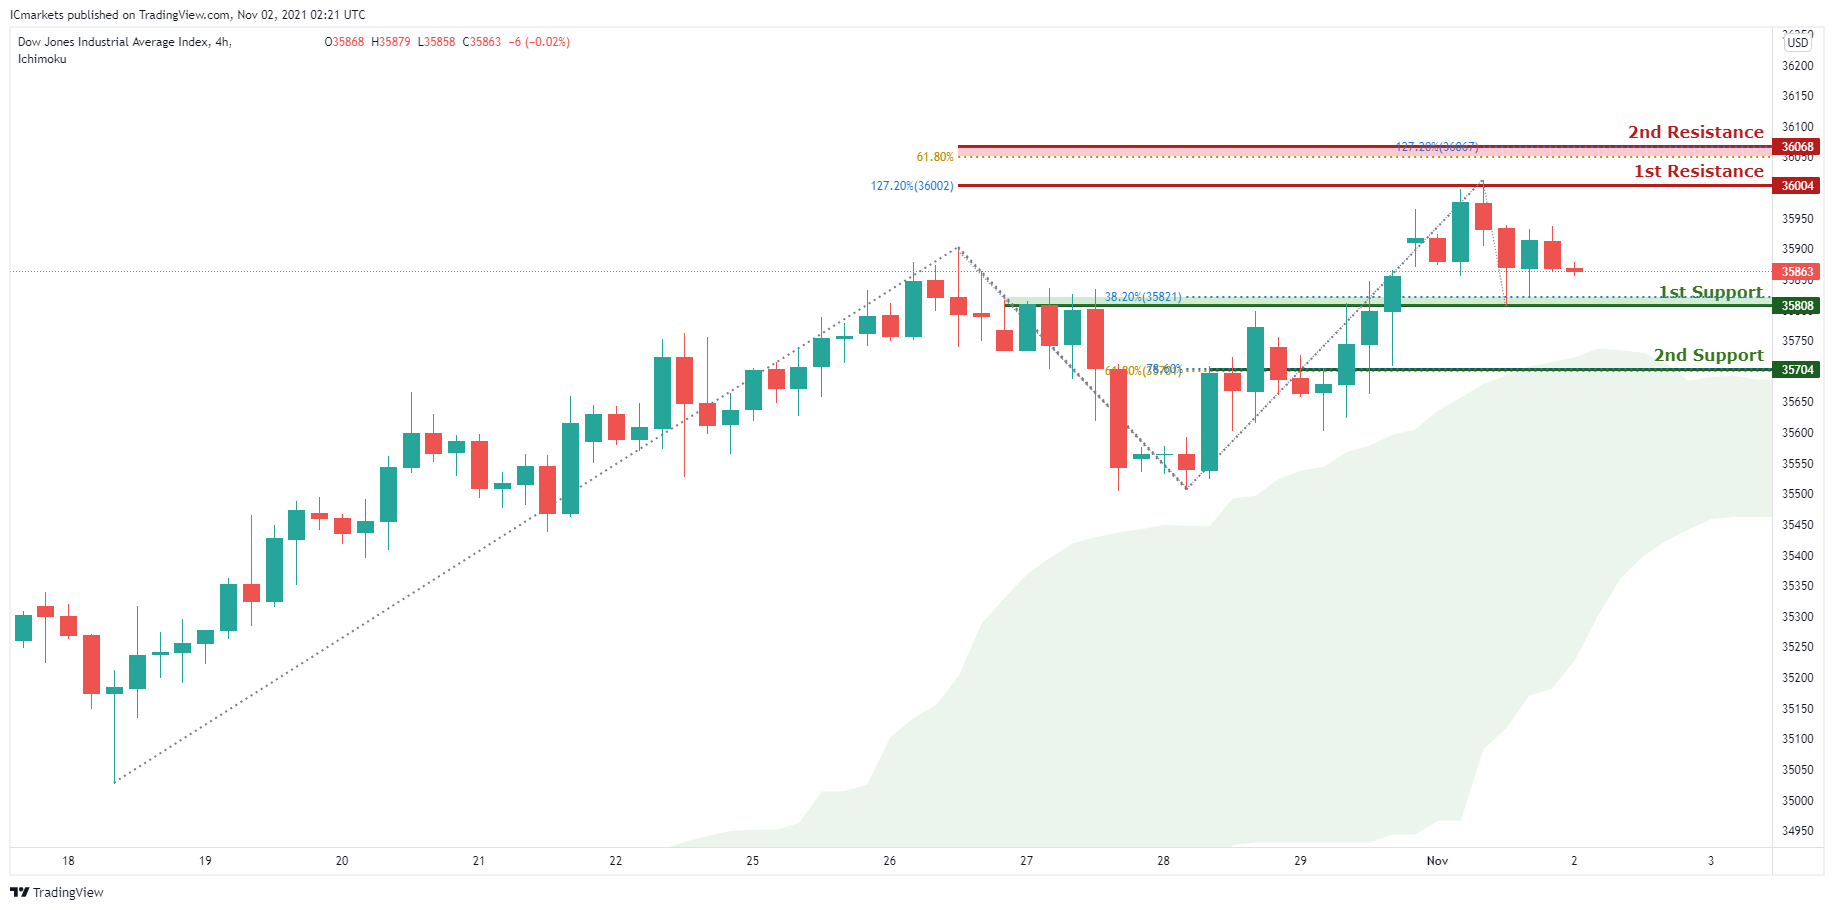
Dow Jones Industrial Average:
On the H4, with price trading above the ichimoku cloud, we are biased that the market on this timeframe is bullish. We are expecting to see price head to 1st resistance at 36004 in line with the 127.2% Fibonacci extension level from 1st support at 35808 in line with the 38.2% Fibonacci retracement level. If price breaks structure at 1st resistance, we may see price head for 2nd resistance at 36068 in line with the 61.8% and 127.2% Fibonacci extension level. Alternatively, we may see price break 1st support and head for 2nd support at 35704 in line with the 61.8% and 78.6% Fibonacci retracement level.
Areas of consideration:
- 4H resistance at 36004
- 4H support at 35808
The accuracy, completeness and timeliness of the information contained on this site cannot be guaranteed. IC Markets does not warranty, guarantee or make any representations, or assume any liability regarding financial results based on the use of the information in the site.
News, views, opinions, recommendations and other information obtained from sources outside of www.icmarkets.com.au, used in this site are believed to be reliable, but we cannot guarantee their accuracy or completeness. All such information is subject to change at any time without notice. IC Markets assumes no responsibility for the content of any linked site.
The fact that such links may exist does not indicate approval or endorsement of any material contained on any linked site. IC Markets is not liable for any harm caused by the transmission, through accessing the services or information on this site, of a computer virus, or other computer code or programming device that might be used to access, delete, damage, disable, disrupt or otherwise impede in any manner, the operation of the site or of any user’s software, hardware, data or property.


