
Key risk events today:
RBA Cash Rate and Rate Statement; OPEC-JMMC Meetings; FOMC Member Williams Speaks; RBA Gov. Lowe Speaks.
EUR/USD:
The US dollar index reigned supreme Monday, and the bid in safe-haven assets unwound after the outcome of the G20, with JPY, CHF and XAU seeing outflows. Data imbalance also favoured the buck, with the EU manufacturing sector remaining in contraction territory and US activity showing improvement.
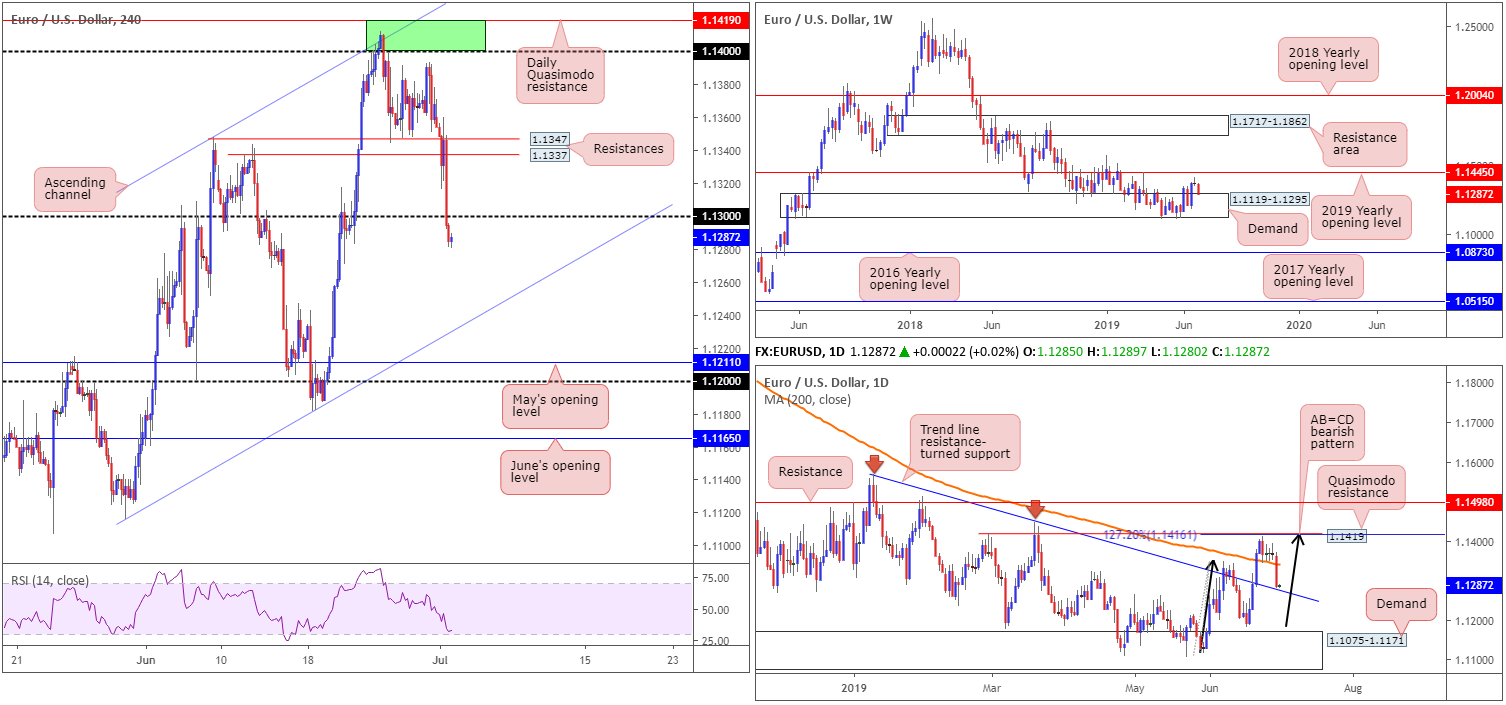
The EUR/USD, down 0.73% on the day, dethroned a number of key technical supports on the H4 timeframe yesterday, including the 1.13 handle. With this base likely to serve as a resistance going forward, traders’ crosshairs are possibly fixed on channel support taken from the low 1.1116.
Higher-timeframe flows show daily price overthrew its 200-day SMA (orange – around 1.1343) and concluded the day bottoming a few points north of a trend line resistance-turned support extended from the high 1.1569. This comes after price action recently topped just ahead of a Quasimodo resistance at 1.1419 as well as its merging 127.2% AB=CD – black arrows – bearish pattern at 1.1416.
Weekly action, on the other hand, is seen testing the top edge of a demand area coming in at 1.1119-1.1295, after failing to connect with upside resistance at the 2019 yearly opening level drawn from 1.1445 last week. This shows signs of seller strength.
Areas of consideration:
Although weekly demand mentioned above at 1.1119-1.1295 exhibits signs of weakness, daily structure is within striking distance of a notable trend line resistance-turned support. H4 flow, however, depicts a bearish tone sub 1.13, with room to perhaps push as far south as the H4 channel support highlighted above.
As is evident from the above reading, price action appears to be caught between a rock and a hard place. Irrespective of the direction one selects, opposing structure is clear. Therefore, unless you’re comfortable with this, opting to remain on the sidelines for the time being may be the better path to take today.
GBP/USD:
Down 0.45%, sterling slipped lower Monday largely on the back of USD bidding, though also a function of weaker-than-expected UK manufacturing PMI.
For those who read Monday’s report you may recall the piece highlighting the following:
Friday’s H4 shooting star pattern (black arrow) could be enough to draw in sellers today and target 1.2626 (entry and risk can be determined according to the said candlestick structure). This, of course, all depends on the outcome of the G20 summit and the market’s response at the open.
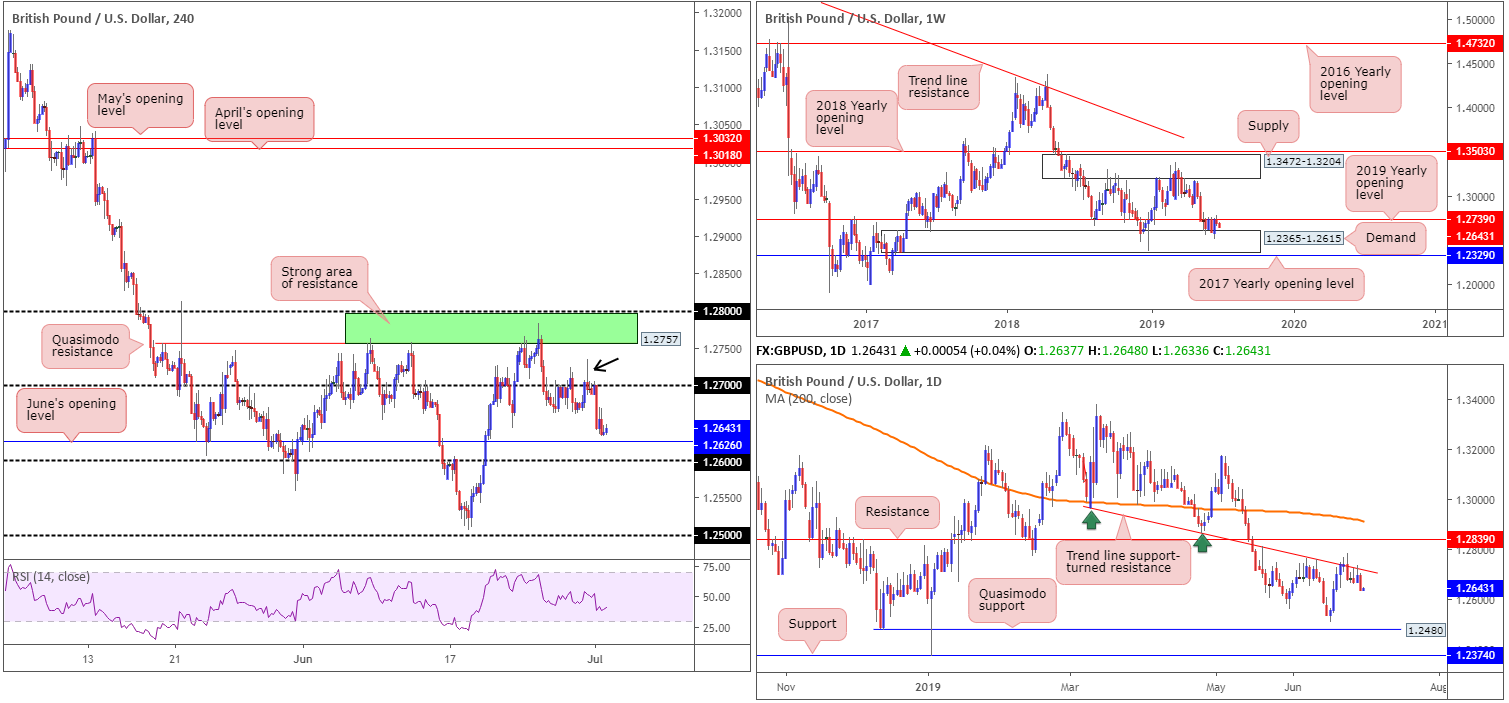
As you can see from the H4 timeframe this morning, price action sold off from 1.27 (the area the H4 shooting star formation formed).
Not only did traders have candlestick confirmation at a round number on the H4 timeframe, higher-timeframe structure also pointed to further selling. Here’s what Monday’s report had to say on the bigger picture:
From the weekly timeframe:
In similar fashion to our previous weekly report, buyers and sellers remain warring for position between long-standing demand at 1.2365-1.2615 and the 2019 yearly opening level at 1.2739, since May 20.
Areas outside of this border to be conscious of fall in around the 2017 yearly opening level at 1.2329 (support) and supply coming in at 1.3472-1.3204. Traders may also wish to acknowledge the unit is currently seen defending the underside of the 2019 yearly opening level, so selling may ensue this week.
Daily timeframe:
In tandem with the 2019 yearly opening level at 1.2739 on the weekly timeframe, daily movement concluded the week chalking up back-to-back bearish selling candles off the underside of a trend line support-turned resistance taken from the low 1.2960. Beyond here, traders’ crosshairs are likely fixed on resistance drawn from 1.2839, whereas a move lower has Quasimodo support at 1.2480 to target.
Areas of consideration:
Well done to any of our readers who managed to catch yesterday’s sell. June’s opening level at 1.2626 is considered the next downside target, closely followed by the top edge of weekly demand at 1.2615 and then the 1.26 round number.
AUD/USD:
The Australian dollar was among the worst performers in the FX space Monday, down 0.82% against the US dollar. Weak Chinese manufacturing data (some analysts state this has enhanced the prospects the RBA will cut rates by 25bps at its meeting today) alongside the market’s preference for the greenback, collectively weighed on the commodity-linked currency.
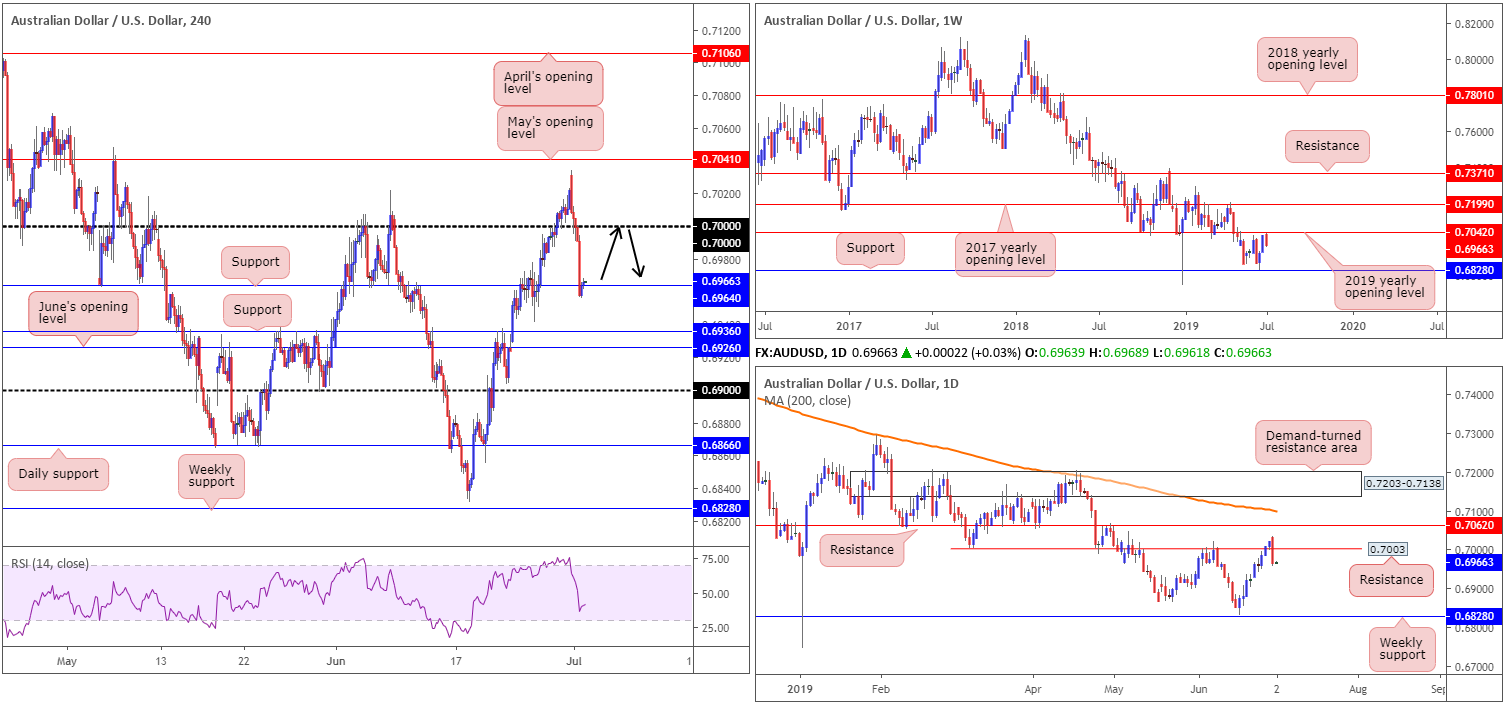
Leaving the 2019 yearly opening level at 0.7042 unchallenged on the weekly timeframe, the next support target comes in at 0.6828. The story on the daily timeframe shows price action produced a notable bearish engulfing candlestick formation yesterday, consequently reclaiming resistance at 0.7003. Weekly support mentioned above at 0.6828 is also the next downside hurdle on this timeframe.
Closer analysis on the H4 timeframe reveals the unit also reclaimed the key figure 0.70 to the downside in recent movement, clearing the pathway south to support at 0.6964, which, as you can see, is currently holding ground. Beyond here, another layer of support resides at 0.6936, closely followed by June’s opening level at 0.6926.
Areas of consideration:
In light of the current technical position this morning, the research team notes an ideal scenario would be for a retest of 0.70 as resistance. This, followed by a H4 bearish candlestick (entry and risk can be determined according to the candlestick structure), is particularly interesting for shorts, seeing as both weekly and daily timeframes exhibit space to manoeuvre lower.
In the event we fail to reach 0.70, however, short-term selling opportunities likely exist below 0.6964, targeting 0.6926/0.6936. Traders are urged to consider risk/reward conditions before pulling the trigger. Aim for at least a 1:1 ratio.
USD/JPY:
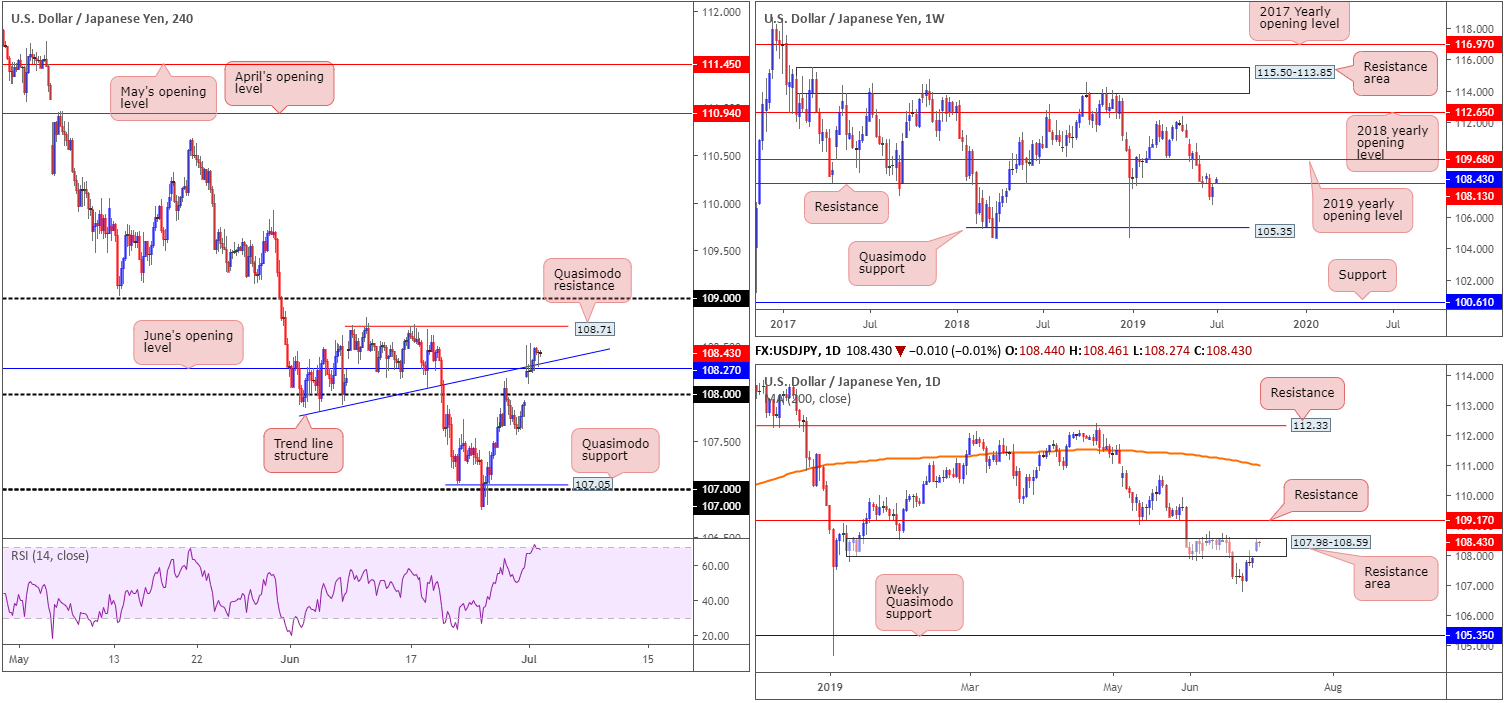
Despite gapping northbound at the open in response to the weekend’s G20 movement, the USD/JPY entered a consolidative phase, braced by June’s opening level at 108.27 and trend line support (taken from the low 107.81) on the H4 timeframe. While H4 buyers appear to exhibit strength off this base, resistance is seen nearby at 108.71: a Quasimodo formation, followed closely by 109. It might also interest some traders to note daily price drove higher into the walls of a resistance area at 107.98-108.59, thanks to recent upside. Note beyond this barrier, we have some room to play with as the next upside target resides at 109.17.
Higher up on the curve, however, weekly price shows the unit climbed above resistance at 108.13, which if holds as support, could provide the spark traders need to continue pushing north towards the 2019 yearly opening level at 109.68.
Areas of consideration:
Unfortunately, buying June’s opening level at 108.27 is hampered by the daily resistance area at 107.98-108.59, along with nearby Quasimodo resistance on the H4 timeframe at 108.71. Some traders may find confidence in the recent break of weekly resistance at 108.13, though the breaking candle is fresh and has four more days of trade to follow, which could see a pullback take shape to fill the opening weekend gap. Therefore, despite resistances not offering much in terms of selling opportunity, the bulls are lacking, according to our technical studies.
USD/CAD:
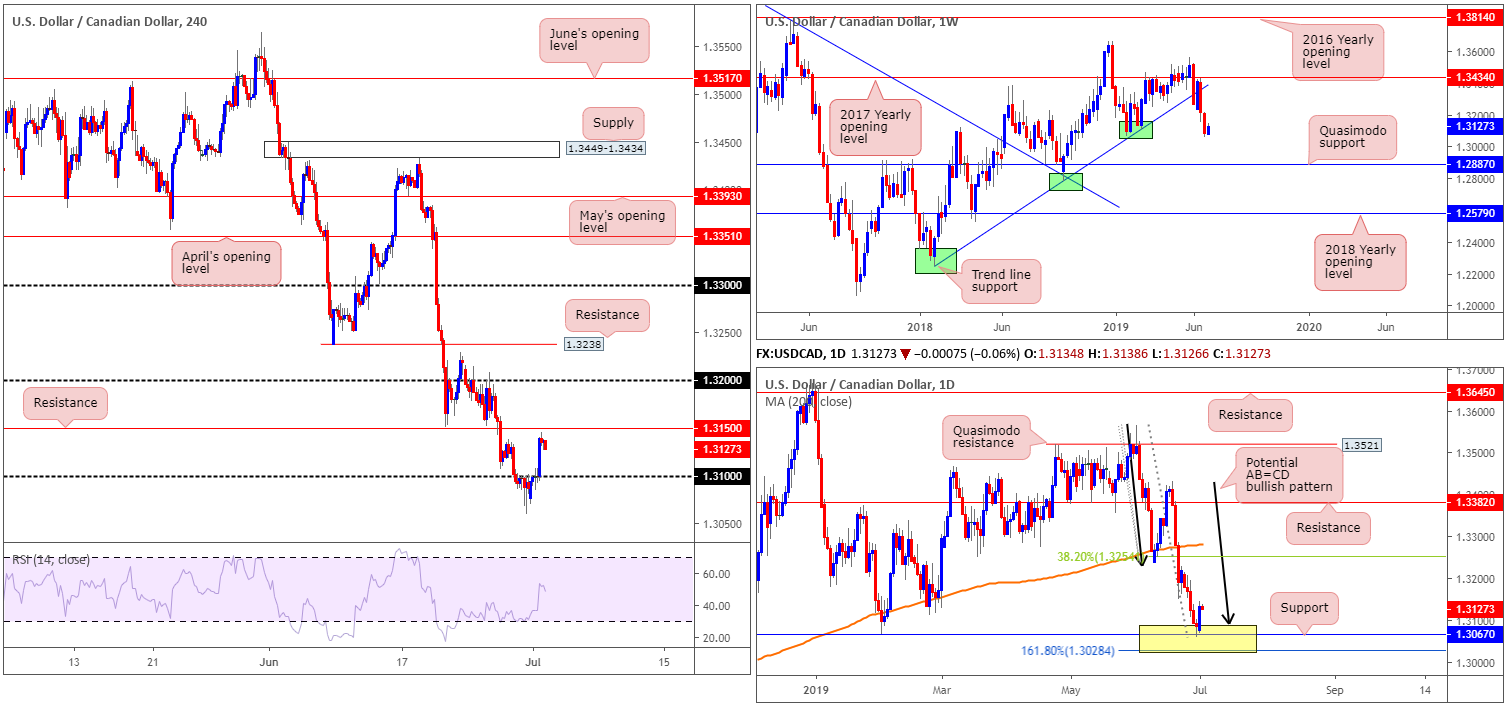
Having observed the US dollar advance in US hours Monday, and WTI ease from highs, the USD/CAD reclaimed 1.31 to the upside and settled for the day just south of H4 resistance at 1.3150. Should we engulf 1.3150, look for a run towards 1.32 to emerge.
For traders who read Monday’s report you may recall the following from the higher timeframes:
Daily perspective:
A closer analysis of price action on the daily timeframe saw a decisive close beneath the 200-day SMA and opened the door for a run to a support area fixed between 1.3028/1.3089 (yellow). Comprised of an AB=CD (black arrows) formation at 1.3089, a support at 1.3067 and a 161.8% Fibonacci extension at 1.3028 (forms part of the AB=CD structure), this area entered the mix Friday and tested the support level seen within at 1.3067 in the shape of a reasonably strong hammer pattern (considered a bullish candlestick signal).
As you can see, price action followed through strongly on Monday from 1.3028/1.3089.
Monday’s report also had the following to say on H4 structure:
H4 perspective:
As a result of recent selling, focus shifts to the 1.31 handle which was taken out Friday. The reaction from the daily support area mentioned above at 1.3028/1.3089 hampered breakout selling below 1.31 and produced two back-to-back hammer patterns into the close.
With daily players potentially looking to take things higher, and H4 action testing the underside of 1.31, traders may opt to wait and see if further buying is seen out of 1.3028/1.3089 and a H4 close forms above 1.31. This acts as confirmation buyers are interested in the daily zone and may take things higher from here and, thus could be a good opportunity to buy this market.
Areas of consideration:
Unfortunately, H4 price did not manage to close above 1.31 prior to trading higher yesterday. Despite this, well done to any of our readers who felt the daily support area at 1.3028/1.3089 was enough confluence to entice buyers into the market. The first take-profit target from here can be seen at the 38.2% daily Fibonacci resistance value at 1.3254 (measured from the A-leg to the D-leg of the AB=CD formation).
USD/CHF:
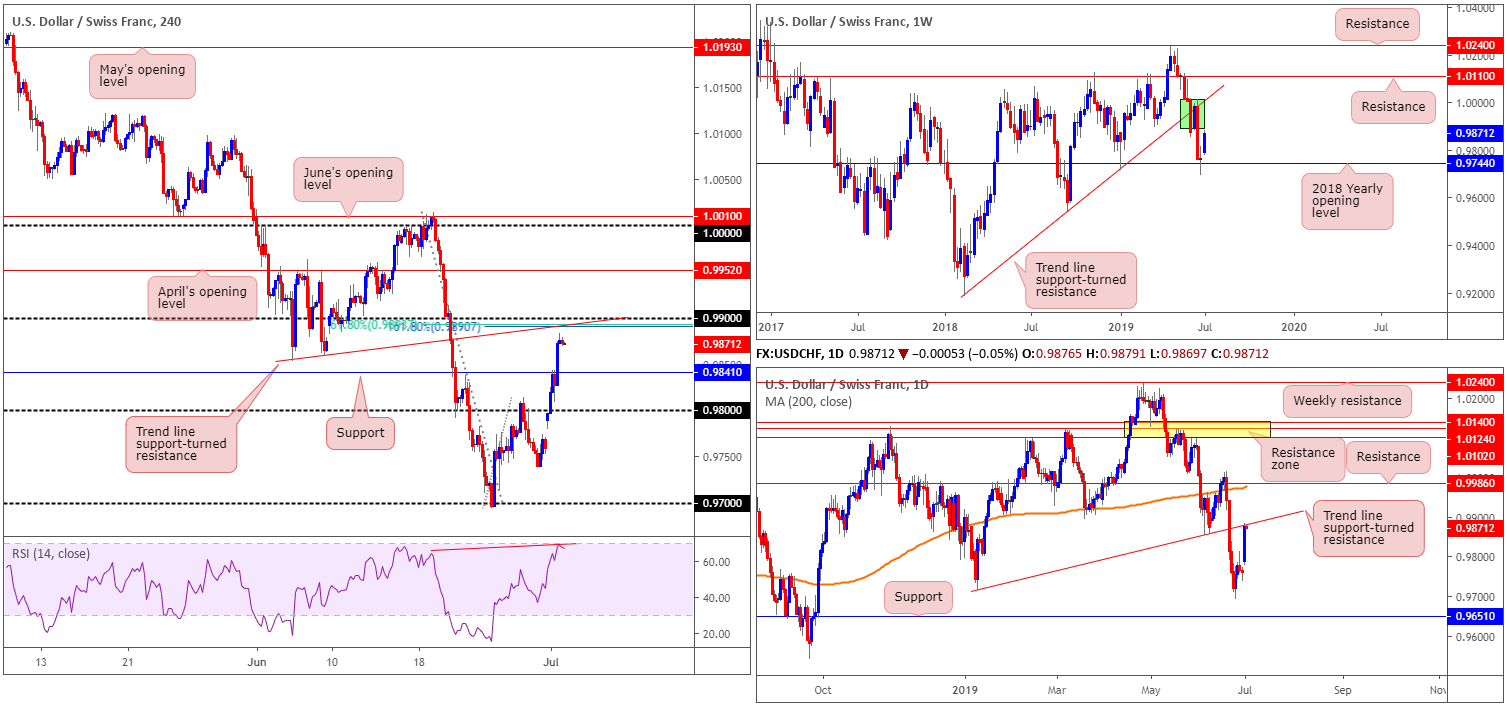
Boosted by improved market sentiment – risk on after the US and China agreed to resume trade talks and suspend any further tariff hikes at the G20 summit at the weekend – the US dollar gathered steam against its Swiss counterpart as demand for safe-haven assets diminished.
From the weekly timeframe, we can see that price action respected the 2018 yearly opening level at 0.9744 in the shape of an indecision candle last week, and turned higher in recent movement. Despite buying, a thick body of supply is present on the weekly timeframe nearby at 1.0014-0.9892 (green). In conjunction with this, daily price also recently shook hands with a trend line support-turned resistance taken from the low 0.9716. Beyond here, the research team has the 200-day SMA (orange around 0.9977) in sight.
Recent upside on the H4 timeframe demolished 0.98 as a resistance Monday, unbolting the door to 0.99 and its nearby confluence: trend line support-turned resistance taken from the low 0.9853, a 161.8% Fibonacci extension point at 0.9890 and a 61.8% Fibonacci retracement at 0.9894. In addition to this, indicator-based traders may wish to note the RSI is currently pencilling in a hidden divergence reading near overbought territory (red line).
Areas of consideration:
With all three timeframes displaying nearby resistance, traders are urged to consider the 0.99 region as a potential sell zone today. A H4 bearish candlestick configuration chalked up from this area is, given the surrounding confluence both locally and on the bigger picture, a high-probability shorting opportunity, targeting H4 support at 0.9841 as the initial take-profit zone.
Dow Jones Industrial Average:
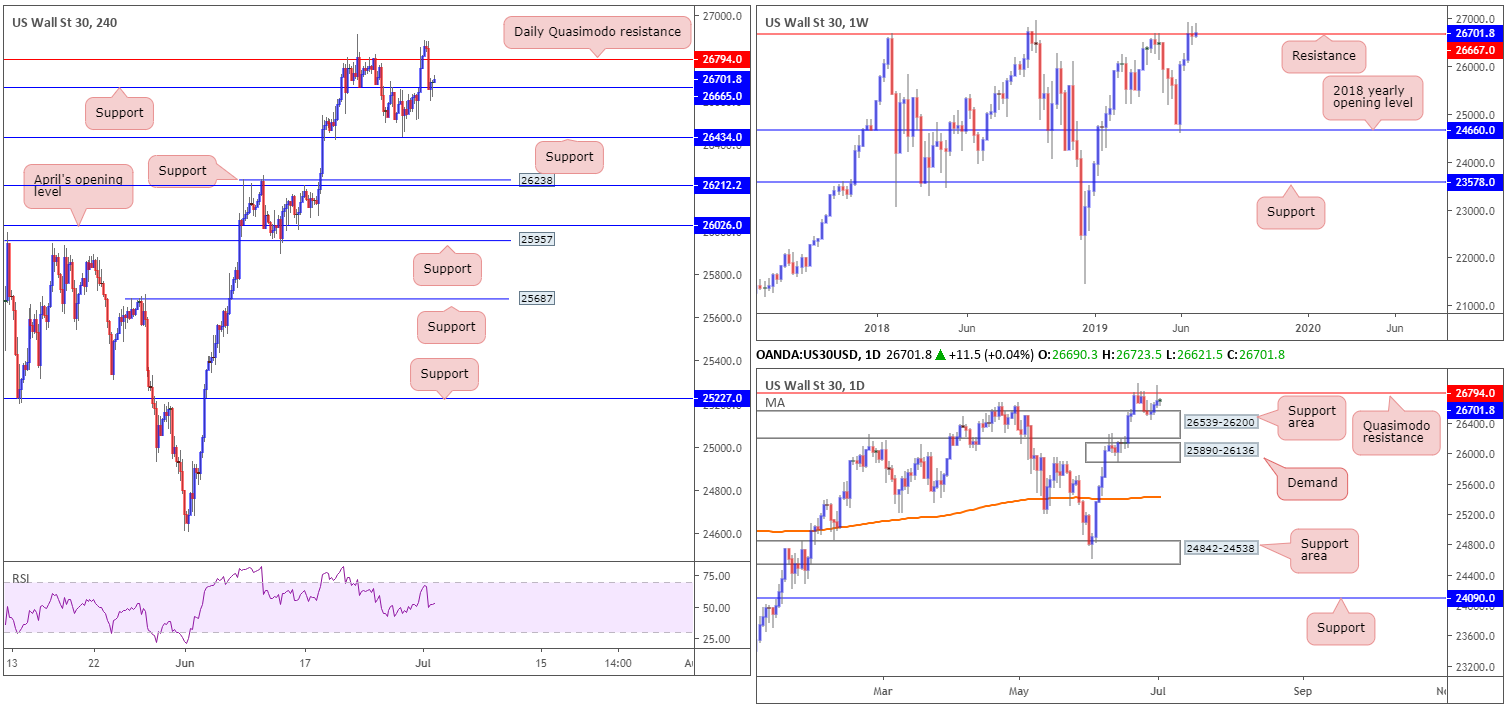
US equities traded higher Monday, though found resistance and pared earlier gains. Still, the boost was enough to push major benchmark indexes to fresh closes. Markets were buoyed after the US agreed to resume trade talks with China and hold off on additional tariffs on $300 billion of Chinese imports. All three main U.S. stock indexes rose. The Dow Jones industrial average rose 0.44%; the S&P 500 advanced 0.77% and the tech-heavy Nasdaq 100 also added 1.27%.
On the technical front, weekly resistance at 26667 is under pressure and shows little sign of holding at this time. Therefore, it is certainly worth pencilling in the next upside target on this scale: the all-time high at 26939.
Quasimodo resistance on the daily timeframe at 26794 re-entered the fight Monday, and held ground by way of a shooting star bearish candlestick pattern. The next downside target on this scale resides close by at the support area drawn from 26539-26200.
H4 support at 26665 held firm into the close yesterday and recently produced a hammer candlestick signal (considered bullish).
Areas of consideration:
With buyers and sellers undecided on the weekly timeframe, and price action sandwiched between Quasimodo resistance at 26794 and a support area at 26539-26200, as well as H4 buying off support at 26665 potentially hampered by the aforesaid Quasimodo resistance, trading this market remains difficult.
With that being the case, opting to remain on the sidelines is the better path to take, according to our technical reading.
XAU/USD (GOLD):
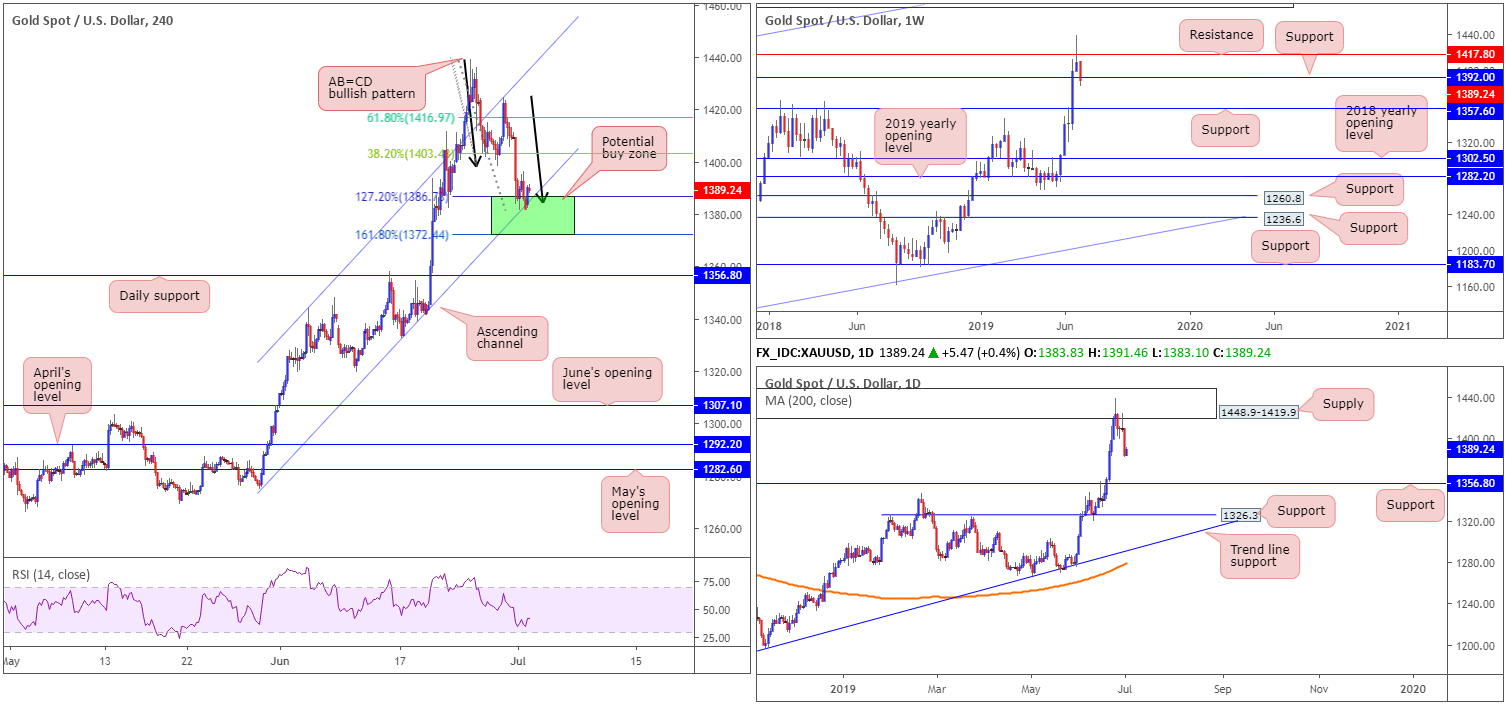
Improved market sentiment weighed on safe havens Monday, with bullion slipping more than 1.80% vs. the US dollar. As highlighted above, Markets were buoyed after the US agreed to resume trade talks with China and hold off on additional tariffs on $300 billion of Chinese imports.
For traders who read Monday’s report you may remember the following:
On the H4 timeframe, traders can see the candles re-entered an ascending channel formation (1274.8/1344.0) in recent trade and retested the upper edge of the said channel Friday. Follow-through selling from here has the channel support in view as the next downside target, which happens to closely unite with weekly support at 1392.0.
Traders may also wish to acknowledge the possibility of an AB=CD bullish pattern forming (black arrows), which has a termination zone positioned between the 127.2% and 161.8% Fibonacci extension points between 1372.4/1386.7 (green area).
As is evident from the H4 timeframe this morning, price action is testing 1372.4/1386.7. Knowing this area is closely positioned to weekly support underlined above at 1392.0, there’s a chance we could observe a reaction take shape from here. This is despite daily price selling from supply at 1448.9-1419.9, and showing space to press as far south as support at 1356.8.
Areas of consideration:
Taken from Monday’s report:
On account of the above reading, the H4 green zone is considered a high-probability buy. Ultimately, stop-loss orders can be positioned beyond the area’s range, with the first upside target generally set around the 38.2% Fibonacci retracement of legs A-D (of the AB=CD pattern) at 1403.4, followed by a second take-profit level at the 61.8% Fibonacci retracement at 1416.9.
The accuracy, completeness and timeliness of the information contained on this site cannot be guaranteed. IC Markets does not warranty, guarantee or make any representations, or assume any liability with regard to financial results based on the use of the information in the site.
News, views, opinions, recommendations and other information obtained from sources outside of www.icmarkets.com.au, used in this site are believed to be reliable, but we cannot guarantee their accuracy or completeness. All such information is subject to change at any time without notice. IC Markets assumes no responsibility for the content of any linked site.
The fact that such links may exist does not indicate approval or endorsement of any material contained on any linked site. IC Markets is not liable for any harm caused by the transmission, through accessing the services or information on this site, of a computer virus, or other computer code or programming device that might be used to access, delete, damage, disable, disrupt or otherwise impede in any manner, the operation of the site or of any user’s software, hardware, data or property.


