
EUR/USD:
The single currency kicked off the week on a fragile note Monday, weighed on by a revival of dollar bidding and disappointing Eurozone inflation numbers.
Eurozone inflation slowed to 1.4% in March from 1.5% a month earlier. Further to this, core Eurozone inflation slowed to 0.8%. Boosting the dollar, nonetheless, had March’s PMI, according to the Institute for Supply Management, register 55.3%, an increase of 1.1 percentage points from the February reading of 54.2%.
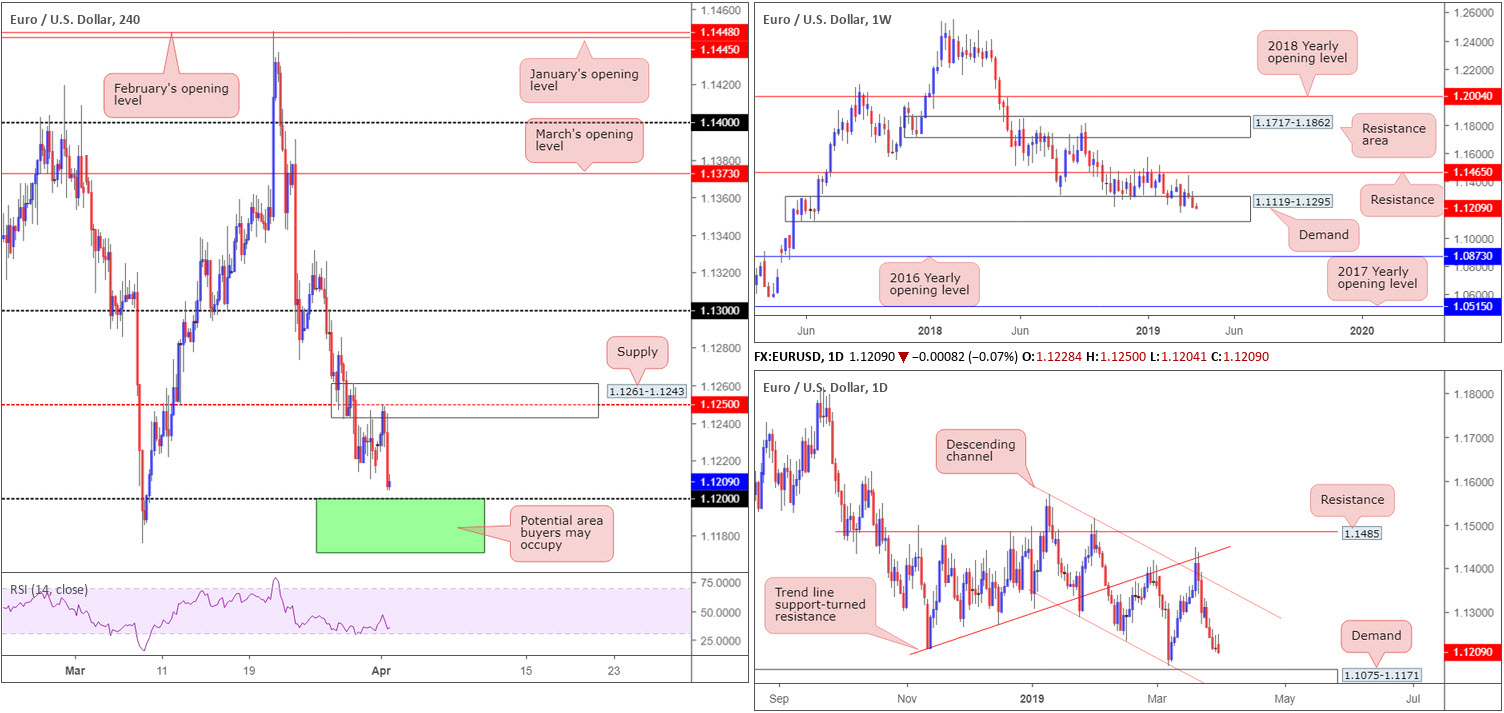
In terms of where we stand on the charts as we head into Tuesday’s segment, the H4 candles ran through Friday’s low at 1.1209 yesterday, following a reasonably strong selloff from supply coming in at 1.1261-1.1243 (and its converging 1.1250 resistance). This, as you can see, exposed nearby support at 1.12, a psychological barrier.
Weekly flow, as highlighted in Monday’s weekly briefing, remains within the walls of demand at 1.1119-1.1295. Overall, the long-term trend on the weekly timeframe continues to face a southerly direction, with traders’ crosshairs now likely fixed on 1.1176: the 2019 yearly low. The next area of interest beyond the current demand, however, falls in around the 2016 yearly opening level priced in at 1.0873. According to the daily timeframe, the pair remains poised to approach demand at 1.1075-1.1171 this week. Note this demand area is fastened to the underside of the current weekly demand.
Traders may want to acknowledge 1.12 applied on the H4 timeframe is sited within the walls of the aforementioned weekly demand area, and less than thirty points above the current daily demand zone.
Areas of consideration:
1.1171/1.12 (green H4) is in view as a potential area buyers may occupy today. Not only is this zone enclosed within weekly demand, we have the top edge of daily demand present at 1.1171 and also the yearly low lurking at 1.1176.
A handsome H4 bullish candlestick pattern (entry/risk levels can be determined according to this structure) printed from 1.1171/1.12, in light of the region’s confluence, serves as an ideal trigger for buyer intent.
Today’s data points: US Core Durable Goods Orders m/m; US Durable Goods Orders m/m.
GBP/USD:
Sterling recorded hearty gains Monday, aided on the back of upbeat UK data. The headline seasonally adjusted UK purchasing managers’ Index (PMI) rose to a 13-month high of 55.1 in March, up from a revised reading of 52.1 in February (originally reported as 52.0). The PMI has remained above the 50.0 benchmark for 32 consecutive months (Markit).
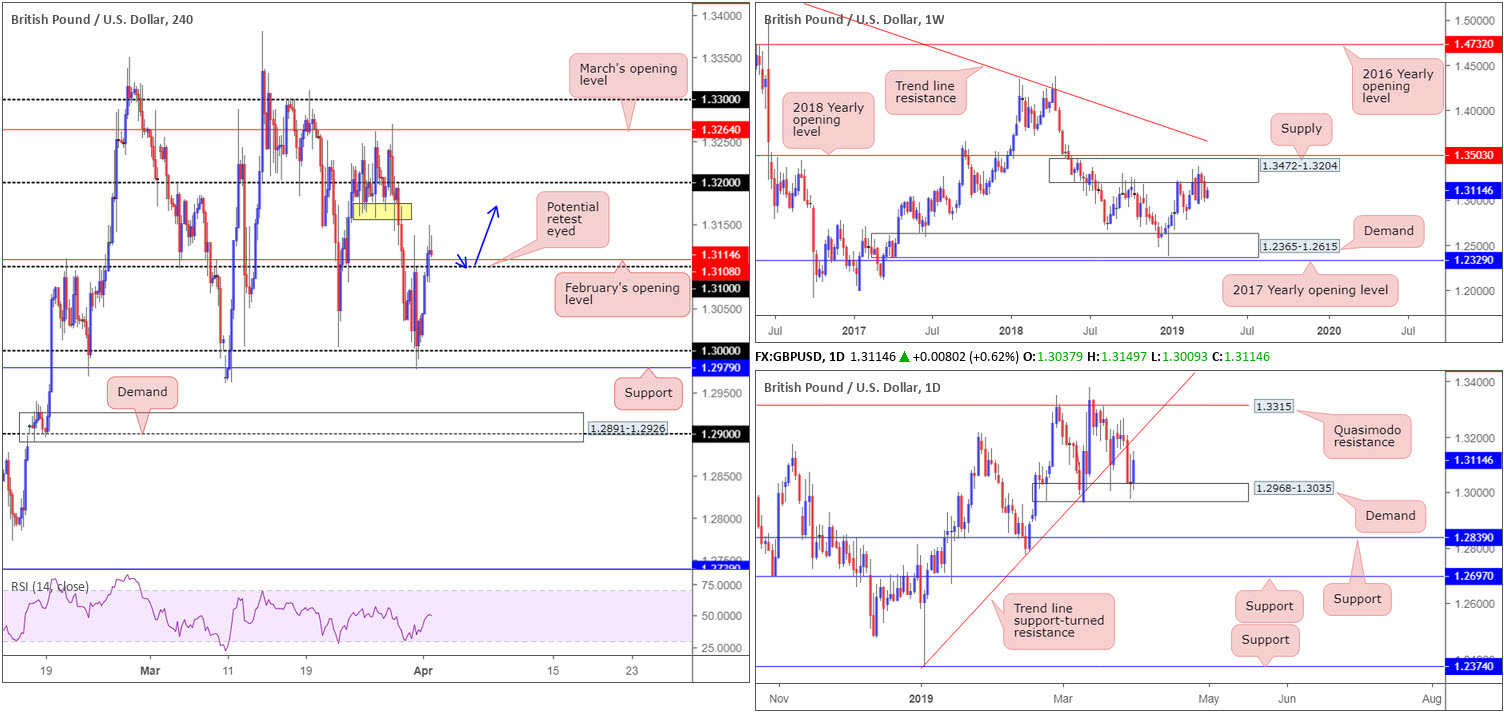
Recent buying hauled H4 action above its 1.31 handle and February’s opening level nearby at 1.3108. Beyond here, traders likely have their crosshairs fixed on a run towards 1.32ish, though local resistance (yellow – prior support) may also hinder upside around 1.3160.
Technically speaking, buying was also likely bolstered by daily demand at 1.2968-1.3035, though according to this timeframe’s structure, trend line support-turned resistance (extended from the low 1.2373) is likely to hamper further buying.
Garnishing the weekly chart is supply drawn from 1.3472-1.3204. Since the end of February this has been home to many traders as price flips between gains/losses. The next obvious downside target falls in around demand at 1.2365-1.2615.
Areas of consideration:
A retest at 1.31 as support today (blue arrows) could unlock the doors to an intraday buying opportunity, targeting between 1.32/1.3160 on the H4 timeframe. With psychological numbers prone to fakeouts, waiting for additional confirmation to form is recommended. Having this provides traders a way of identifying buyer intent as well as offering entry and risk levels to work with (based on the chosen confirmation method).
Today’s data points: US Core Durable Goods Orders m/m; US Durable Goods Orders m/m.
AUD/USD:
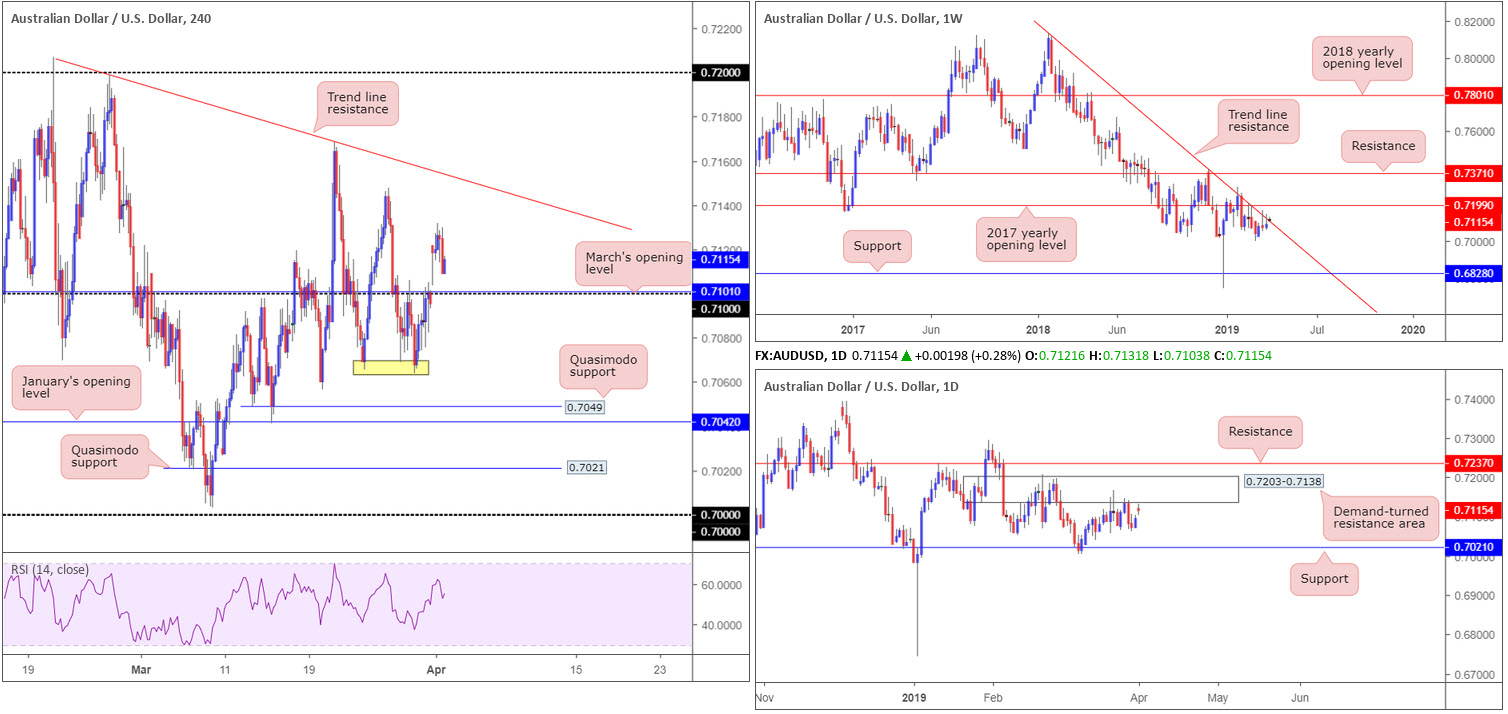
The pair built on Friday’s gains early trade Monday, opening by means of a bullish gap in response to a strong Chinese manufacturing PMI print. Despite clearing 0.71 (and merging March’s opening level at 0.7101) to the upside on the H4 timeframe, impetus was lacking around 0.7130s given the US 10-year Treasury yield attacked higher prices and the US dollar concluded the day in positive territory above its 97.00 mark (US dollar index).
Many intraday traders likely have eyeballs on 0.71 for a potential retest play today. Although a bounce from here is not out of the question, traders may want to acknowledge where the unit stands in the overall picture. Weekly candles remain kissing the underside of a long-standing trend line resistance (etched from the high 0.8135). The market could eventually observe additional selling take shape from here as downside appears reasonably free until connecting with support coming in at 0.6828. Further adding to this bearish note, the daily timeframe reveals a demand-turned resistance area positioned overhead at 0.7203-0.7138.
Areas of consideration:
Entering long from 0.71 is a chancy trade for reasons stated above.
In the event our higher-timeframe reading is accurate and H4 action overthrows 0.71, selling this market (preferably on a retest – entry and risk levels can be determined according to the rejection candle’s structure) towards 0.7067ish (around Thursday’s low – yellow), followed by Quasimodo support at 0.7049, is an option.
Today’s data points: Australian Building Approvals m/m; RBA Rate Statement and Cash Rate; Australian Annual Budget Release; US Core Durable Goods Orders m/m; US Durable Goods Orders m/m.
USD/JPY:
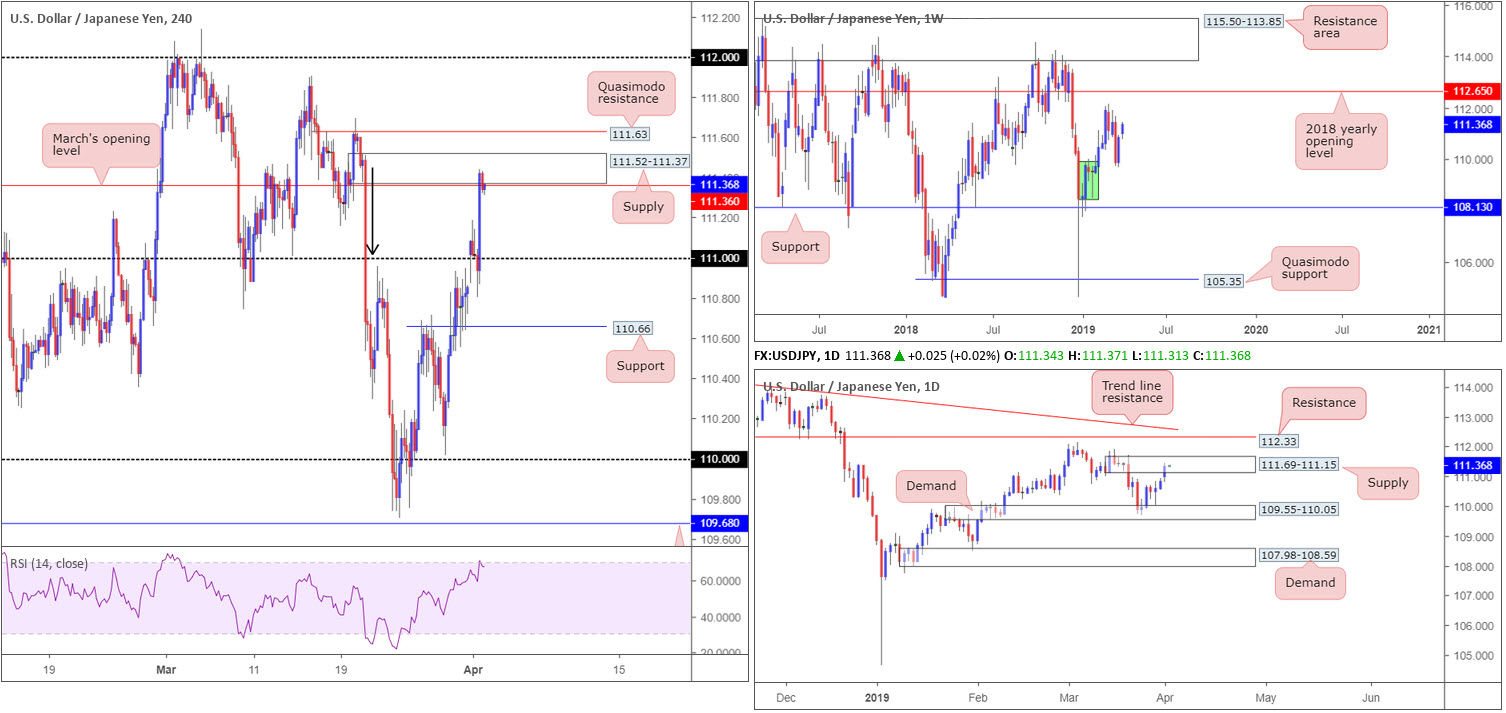
The Japanese yen ceded further ground to its US counterpart Monday, as the H4 candles cleared 111 to the upside.
March’s PMI, according to the Institute for Supply Management, registered 55.3%, an increase of 1.1 percentage points from the February reading of 54.2%. This guided the US 10-year Treasury yield higher, alongside the US dollar and, as a result, the USD/JPY as well.
Mildly paring gains from H4 supply at 111.52-111.37 into the close (fuses with March’s opening level at 111.36) highlights an interesting area. Not only is the supply itself attractive given the strength of the sellers from its base (black arrow), the area also resides within the parapets of daily supply coming in at 111.69-111.15. Therefore, this may generate sufficient impetus to force a retest at 111 today. It might also interest traders to note the RSI indicator is seen kissing its overbought value.
In the event we push for higher levels today, nonetheless, the H4 Quasimodo resistance nearby at 111.63, which still remains within he walls of the current daily supply zone, is next in the firing range.
Areas of consideration:
In light of the current H4 supply being sited within daily supply, a sell from here is an idea today, targeting 111 as an initial take-profit target. Should the H4 zone fail to hold and we head for H4 Quasimodo resistance mentioned above at 111.63, a sell from here is also a consideration, again targeting 111 as the initial port of call.
Waiting for additional confirmation to form before pulling the trigger is something to consider at the aforesaid H4 supply (entry/risk levels can be defined according to the confirmation technique selected). This helps avoid an unnecessary loss should the pair head for the Quasimodo resistance, which we believe is a clear enough barrier to trade without confirmation (stops can be positioned above the apex of the pattern around 111.70ish).
Today’s data points: US Core Durable Goods Orders m/m; US Durable Goods Orders m/m.
USD/CAD:
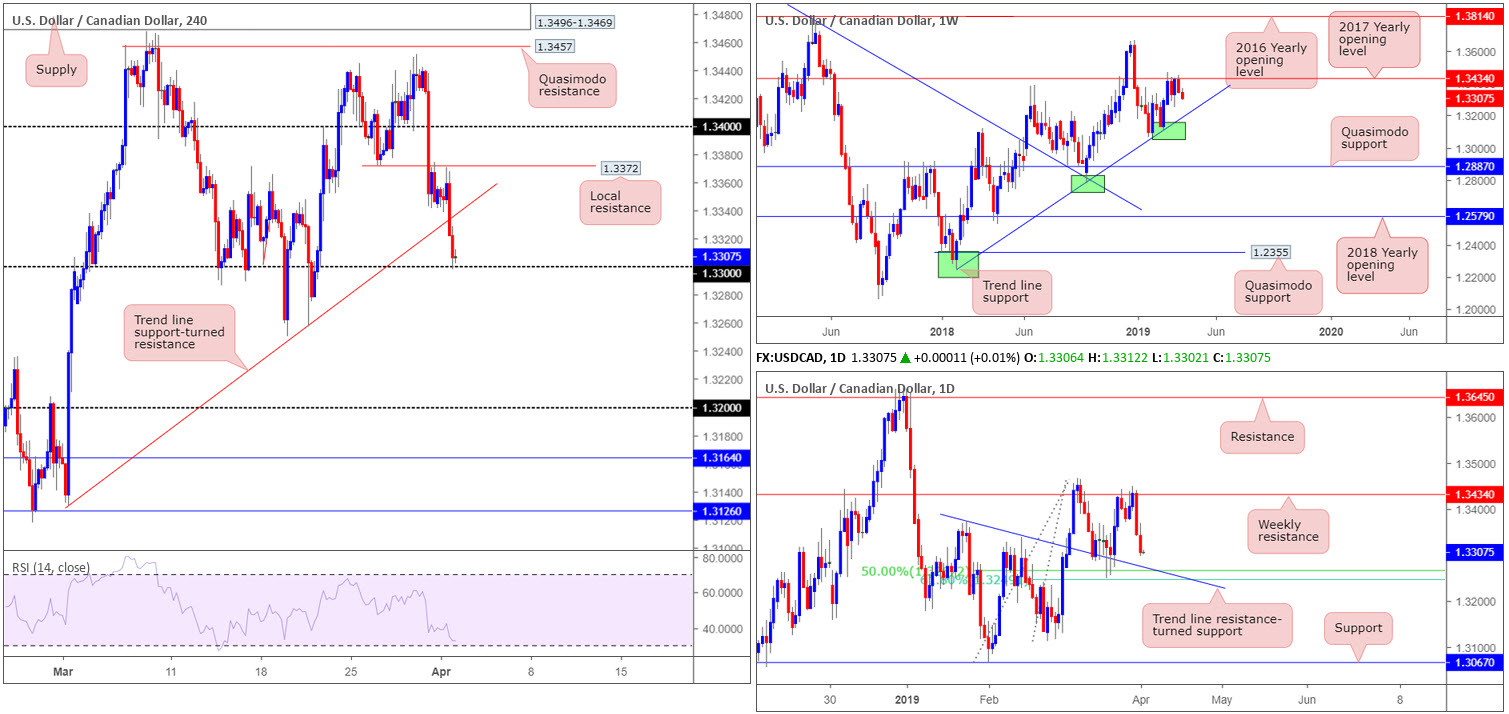
USD/CAD bulls remained on the back foot Monday, down 0.30% on the day. Extending Friday’s losses, yesterday’s descent dethroned trend line support (extended from the low 1.3129) on the H4 timeframe and shook hands with 1.33 into the closing bell.
On the occasion further downside is observed and the aforementioned H4 structure is overthrown, a run towards 1.32 could be in store.
In terms of where the market is positioned on the weekly timeframe, the pair remains engaged with notable resistance at 1.3434 (the 2017 yearly opening level) following a dominant push higher from trend line support (taken from the low 1.2247). In conjunction with weekly movement, daily flow could also generate additional selling, targeting a 50.0% support at 1.3267, which happens to merge closely with a 61.8% Fibonacci support at 1.3248 and a trend line resistance-turned support (extended from the high 1.3375).
Areas of consideration:
With daily candles poised to approach 1.3260ish and weekly price indicating we may head for levels beyond here, entering long from 1.33 on the H4 timeframe could prove a testing trade.
On account of the above, the research team notes a potential H4 close beneath 1.33 is likely, which is enough to underline a possible sell towards the 50.0% support at 1.3267 on the daily timeframe as the initial target. While breakout traders may be satisfied entering short at the close of a breakout candle, conservative traders may opt to wait and see if a retest at the underside of 1.33 is seen before pulling the trigger. An ideal scenario would be for the retest to form in the shape of a H4 bearish candlestick formation, as traders can use this to outline entry/risk levels as well as define seller intent.
Today’s data points: US Core Durable Goods Orders m/m; US Durable Goods Orders m/m.
USD/CHF:
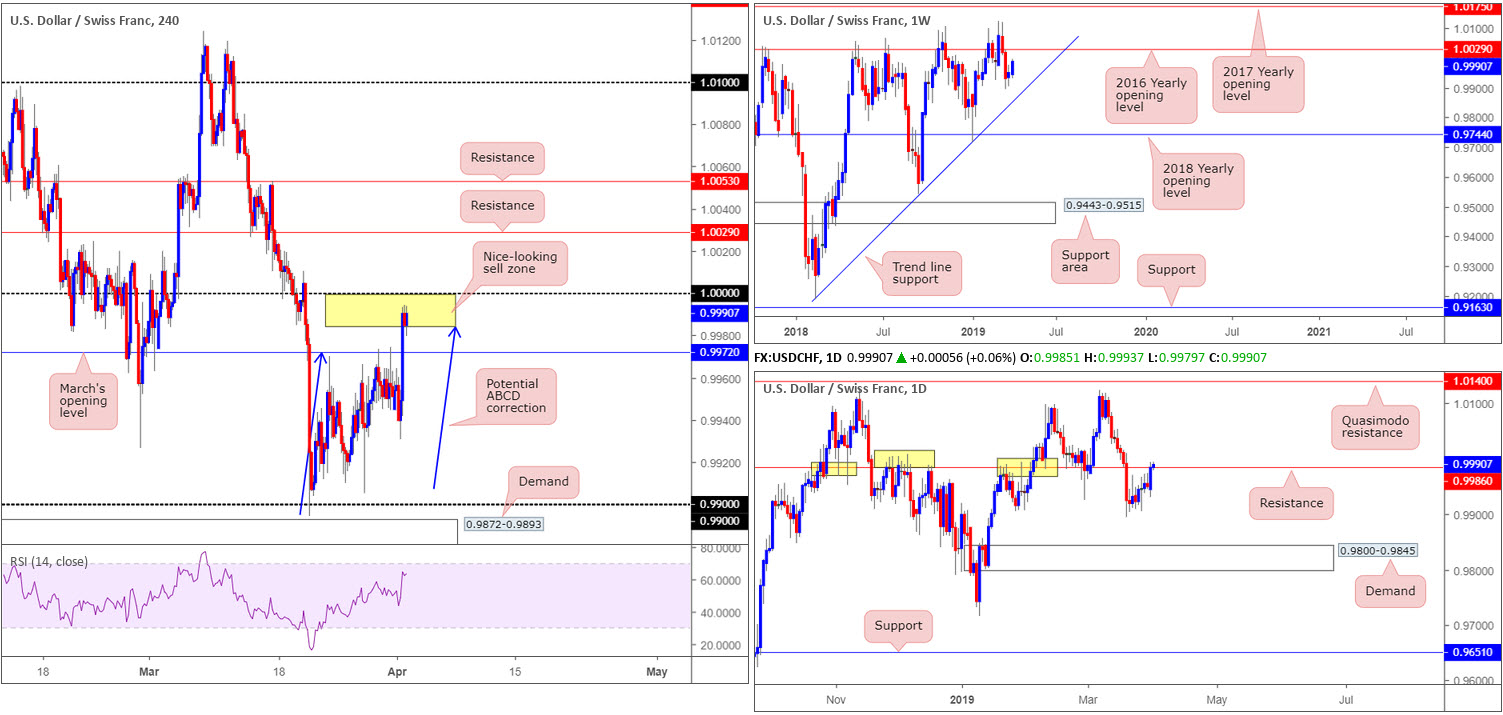
Underpinned by strong US data, the 10-year US Treasury yield surged higher Monday. This – coupled with a reasonably robust dollar – lifted the greenback higher vs. the Swiss franc and cleared March’s opening level at 0.9972. As evident from the H4 timeframe, recent moves positioned the candles within an interesting area of resistance between 1.0000 (parity) and 0.9985, a bearish ABCD (blue arrows) correction pattern (yellow). Also tucked within this area is daily resistance plotted at 0.9986.
The only grumble to selling 1.0000/0.9985 is the weekly timeframe suggesting we may be heading beyond here towards the 2016 yearly opening level at 1.0029.
Areas of consideration:
Between 1.0000 (parity) and 0.9985 (yellow) is, according to our technical studies, a reasonably solid sell zone. As round numbers are prone to fakeouts, though, entering on additional confirmation is a point worth considering – entry and risk levels can then be determined according to your chosen confirmation method. In terms of the next support target, March’s opening level mentioned above at 0.9972 is a potentially troublesome support to keep in mind. Beyond here, yesterday’s low at 0.9930 is also in sight.
Today’s data points: US Core Durable Goods Orders m/m; US Durable Goods Orders m/m.
Dow Jones Industrial Average:
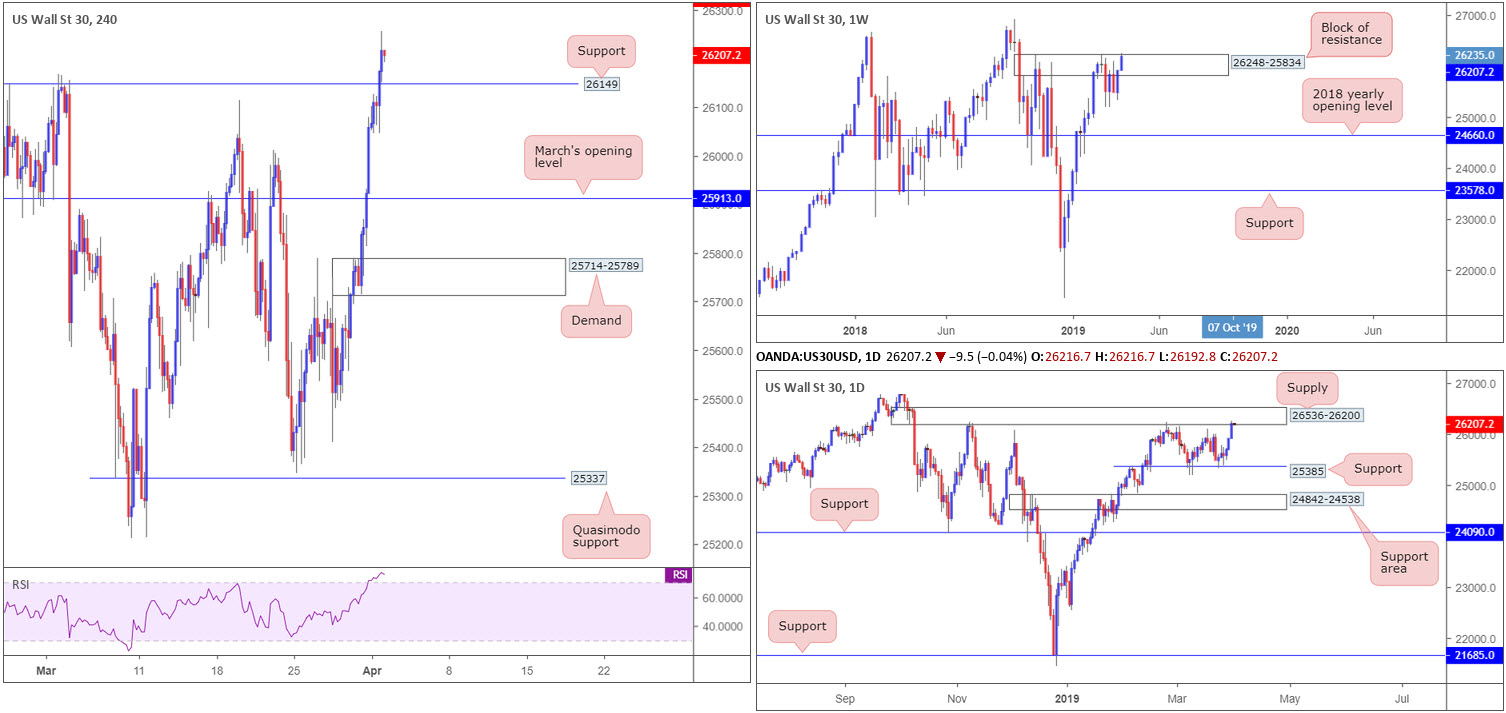
US equities marched higher Monday, extending the market’s upward momentum as it comes off its best quarter in nearly a decade. US Treasury yields also posted a strong recovery yesterday, signalling traders are confident in the economy’s growth. In addition, markets were also encouraged to see March’s PMI, according to the Institute for Supply Management, register 55.3%, an increase of 1.1 percentage points from the February reading of 54.2%.
From a technical standpoint, weekly flows are seen testing the top edge of a black of resistance coming in at 26248-25834. A clean sweep beyond here could see the index knocking on the door of the all-time high 26939. A closer reading of price action on the daily timeframe directs the spotlight towards supply pencilled in at 26536-26200. Note this area has capped upside on a number of occasions as it is glued to the top edge of the weekly resistance mentioned above at 26248-25834.
Lower down on the curve, the H4 candles are seen testing the 26237 Feb 25 high after conquering Quasimodo resistance at 26149 (now acting support) to the upside in recent trading. Assuming we brush aside 26237, the next troublesome area on the H4 timeframe falls in around 26234, a resistance level (not seen on the screen).
Areas of consideration:
A retest of the recently broken resistance on the H4 timeframe at 26149 as support could be seen today. This is a bit of a daredevil trade, though, according to our technical studies. Both weekly and daily timeframes show forms of resistance in motion. However, the one thing buyers do have going for them is the trend. For that reason, a retest that’s formed by way of a H4 bullish candlestick pattern, could still be worthy of attention, targeting the H4 resistance highlighted above at 26234.
Today’s data points: US Core Durable Goods Orders m/m; US Durable Goods Orders m/m.
XAU/USD (GOLD):
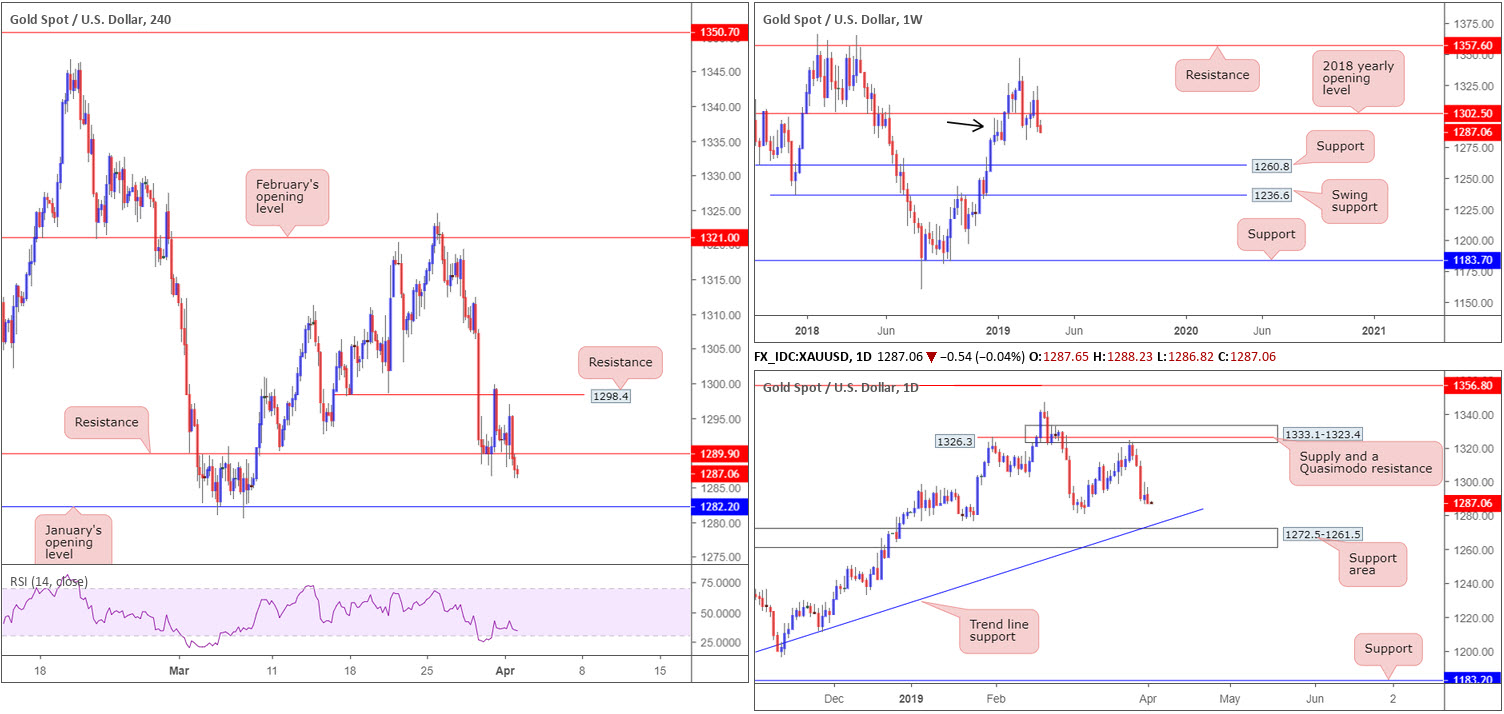
In $ terms, the price of gold deteriorated Monday, exacerbating last week’s 1.62% decline. Strong US data weighed on the yellow metal’s movement, drawing the H4 candles under support at 1289.0 (now acting resistance) and exposing January’s opening level at 1282.0 as the next viable floor on the H4 timeframe.
The broader picture reveals the metal recently snapped back beneath its 2018 yearly opening level at 1302.5, by way of a strong bearish engulfing candle. Although viewed by some as a bearish cue to potentially push lower this week, it is worth pencilling in demand (black arrow) at 1276.9-1295.8. A break south of this area has support at 1260.8 to target.
Immediate support on the daily timeframe to be aware of is the 1281.0 March 7 low, followed by a support area coming in at 1272.5-1261.5 and merging trend line support (taken from the low 1160.3).
Areas of consideration:
As the yellow metal recently re-entered the jaws of weekly demand at 1276.9-1295.8, albeit on the back of strong selling, a bounce from January’s opening level on the H4 timeframe at 1282.2 and merging support seen at the 1281.0 March 7 low (daily timeframe) could be an option today/early week. An added bonus would be H4 price chalking up a candlestick signal off 1281.0/1282.2, consequently identifying buyer intent and also serving as a base to determine entry and risk levels. In regards to an initial take-profit target, 1289.9 is a potential candidate.
The accuracy, completeness and timeliness of the information contained on this site cannot be guaranteed. IC Markets does not warranty, guarantee or make any representations, or assume any liability with regard to financial results based on the use of the information in the site.
News, views, opinions, recommendations and other information obtained from sources outside of www.icmarkets.com.au, used in this site are believed to be reliable, but we cannot guarantee their accuracy or completeness. All such information is subject to change at any time without notice. IC Markets assumes no responsibility for the content of any linked site. The fact that such links may exist does not indicate approval or endorsement of any material contained on any linked site.
IC Markets is not liable for any harm caused by the transmission, through accessing the services or information on this site, of a computer virus, or other computer code or programming device that might be used to access, delete, damage, disable, disrupt or otherwise impede in any manner, the operation of the site or of any user’s software, hardware, data or property.


