
Key risk events today:
US CB Consumer Confidence.
(Previous analysis as well as outside sources – italics).
EUR/USD:
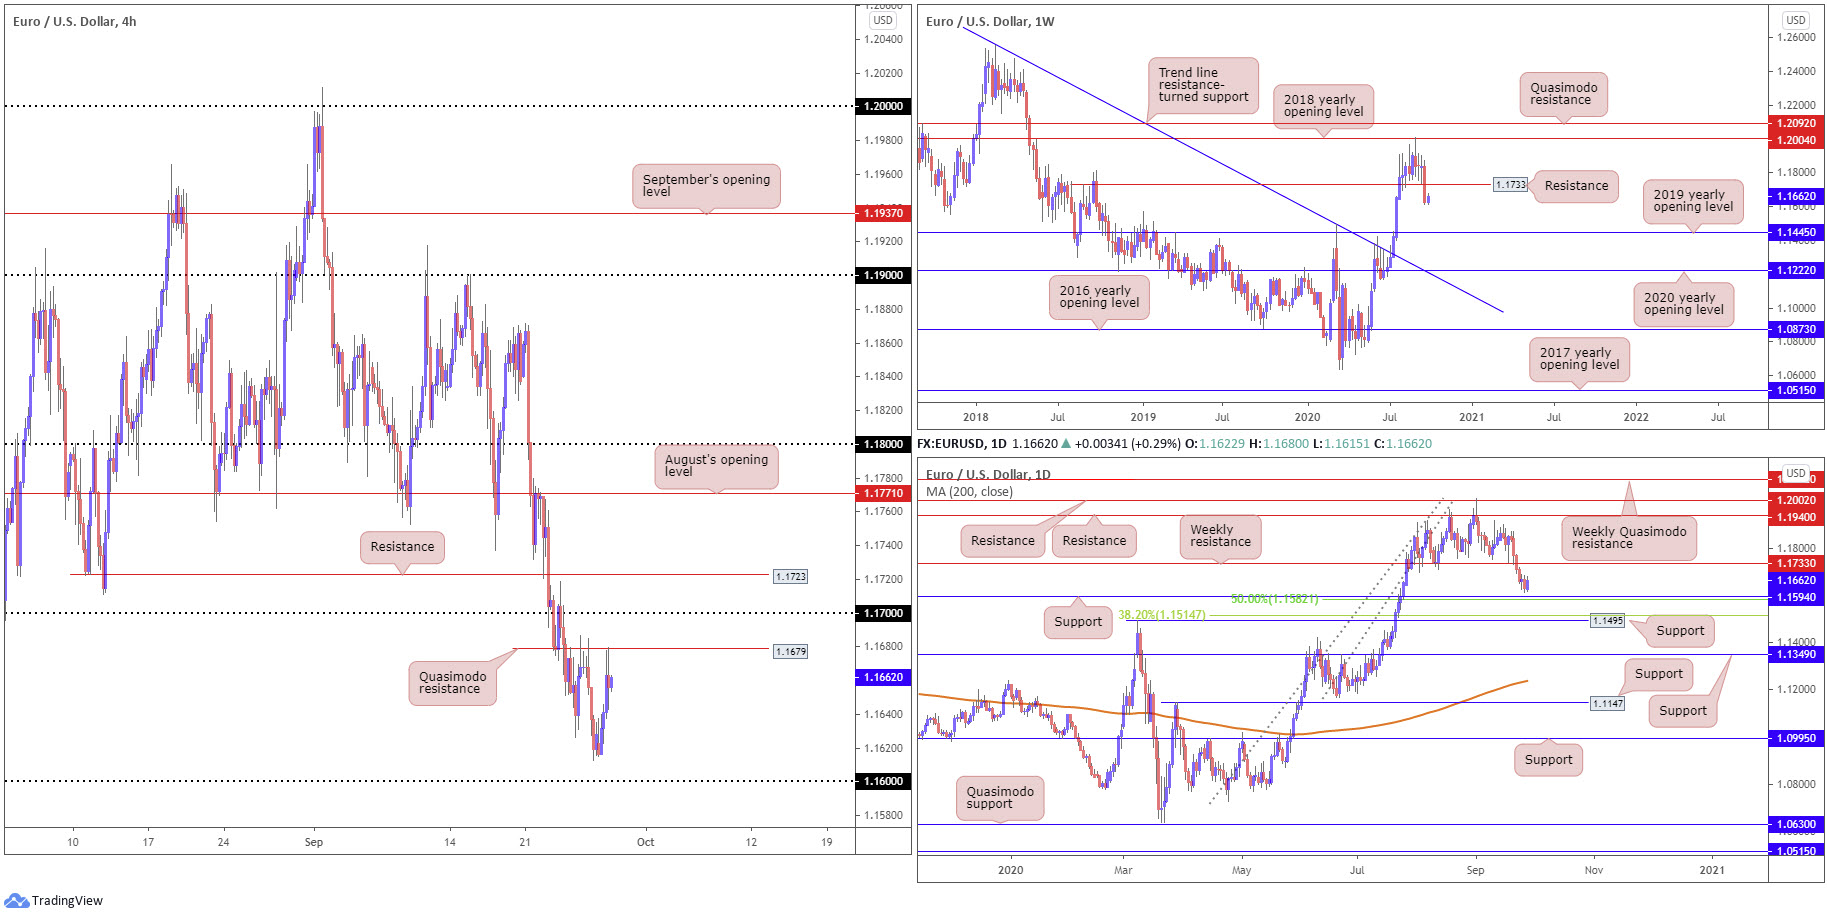
After shaking hands with daily resistance at 94.65 on the US dollar index Friday, DXY price pulled back Monday and provided EUR/USD some fresh bullish legs ahead of the 1.16 handle to test Quasimodo resistance on the H4 timeframe at 1.1679. Beyond here, traders will acknowledge the 1.17 handle and resistance plotted at 1.1723.
Down more than 200 points last week, weekly support at 1.1733, a prior Quasimodo resistance level, came under strong fire (now marked as resistance). The pair finished the week grasping session lows, shining the technical spotlight on the 2019 yearly opening level at 1.1445 as the next obvious support target. Consequently, an extension to the downside is a possibility.
The pair recently bottomed north of support at 1.1594 on the daily timeframe, coinciding with a 50.00% retracement ratio at 1.1582. Beyond the aforementioned levels, EUR/USD also faces possible support from 1.1495 (March 9 high), complemented by a 38.2% Fibonacci retracement ratio at 1.1514.
Areas of consideration:
While the weekly timeframe exhibits scope to explore lower levels, brushing aside daily support at 1.1594 (and nearby 50.00% retracement at 1.1582) could prove troublesome. As a result, bullish scenarios may surface off 1.16 on the H4, should the pair hold south of H4 Quasimodo resistance. How much of a bounce we’ll see from here, however, is difficult to judge, owing to the weekly timeframe threatening to move lower. Overthrowing 1.16, on the other hand, opens the door to possible bearish setups, targeting H4 Quasimodo support at 1.1563, followed by the 1.15 handle, a level sharing space with daily support mentioned above at 1.1495.
Another level that might be worth noting on the watchlist is H4 resistance at 1.1723, linked closely with weekly resistance at 1.1733. Also appealing here is the possibility of buy-stop liquidity above 1.17 (H4).
GBP/USD:
The British pound outperformed major counterparts Monday amidst hopes of an EU-UK compromise.
On the technical front, the upside push is not a surprise.
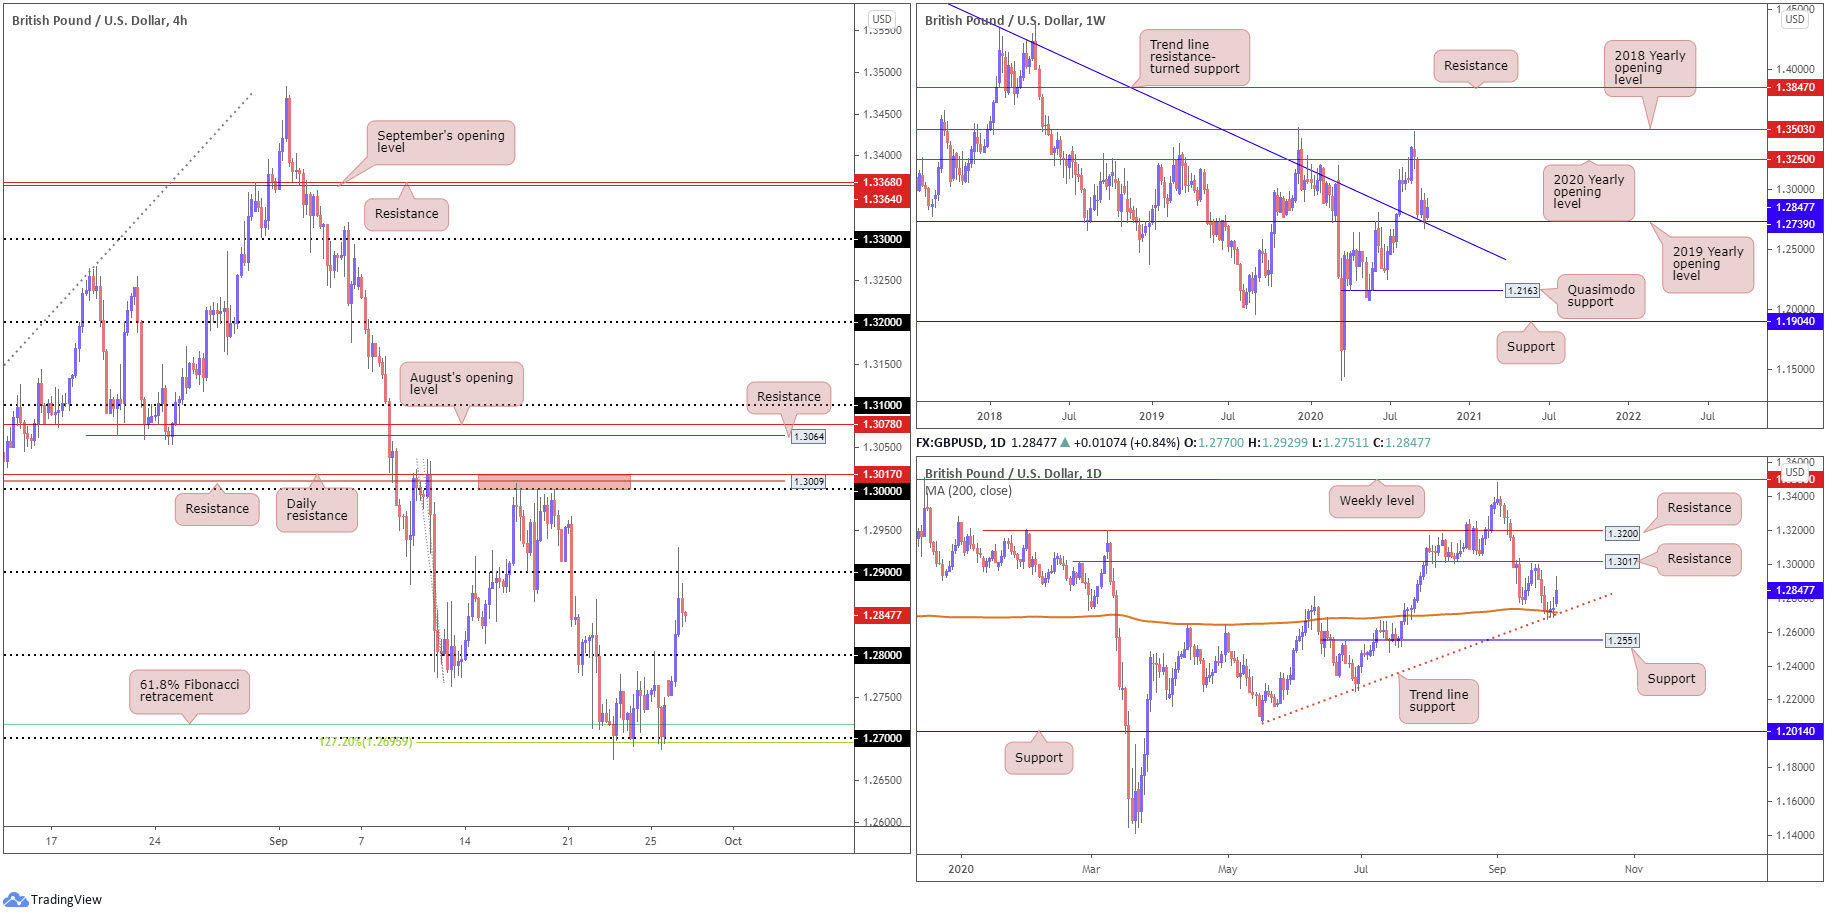
As highlighted in a number of technical briefings last week, the weekly timeframe engages with support at 1.2739, a 2019 yearly opening value. Technicians will acknowledge the level also merges with trend line resistance-turned support, extended from the high 1.5930. A rebound from here has room to advance as far north as the 2020 yearly opening value at 1.3250. Yet, crossing through 1.2739 registers a bearish setting, with the 1.2251 June 29 low targeted, closely shadowed by Quasimodo support priced in at 1.2163.
In addition to weekly support, daily price crossed swords with the 200-day SMA (orange – 1.2717) and intersecting trend line support, extended from the low 1.2075. Further buying here throws daily resistance at 1.3017 into the mix.
What was also attractive was the H4 timeframe holding off the 1.27 handle and converging 61.8% Fibonacci retracement at 1.2718, aided by a 127.2% Fibonacci extension point at 1.2695. Technical support, coupled with USD softness, saw 1.28 give way to test 1.29, and test it did, with price currently trading around 1.2840s.
Areas of consideration:
Despite the aggressive rotation from 1.29 on Monday, the river north on the higher timeframes appears ripple free until daily resistance at 1.3017, which happens to merge with the key figure 1.30 and H4 resistance at 1.3009.
Dip-buying at any retest seen at 1.28 is one possible scenario; another setup could be the pair turns higher before drawing in 1.28 and prints a H4 close above 1.29. The latter, of course, would signal breakout strategies, in favour of reaching the 1.30 neighbourhood.
AUD/USD:
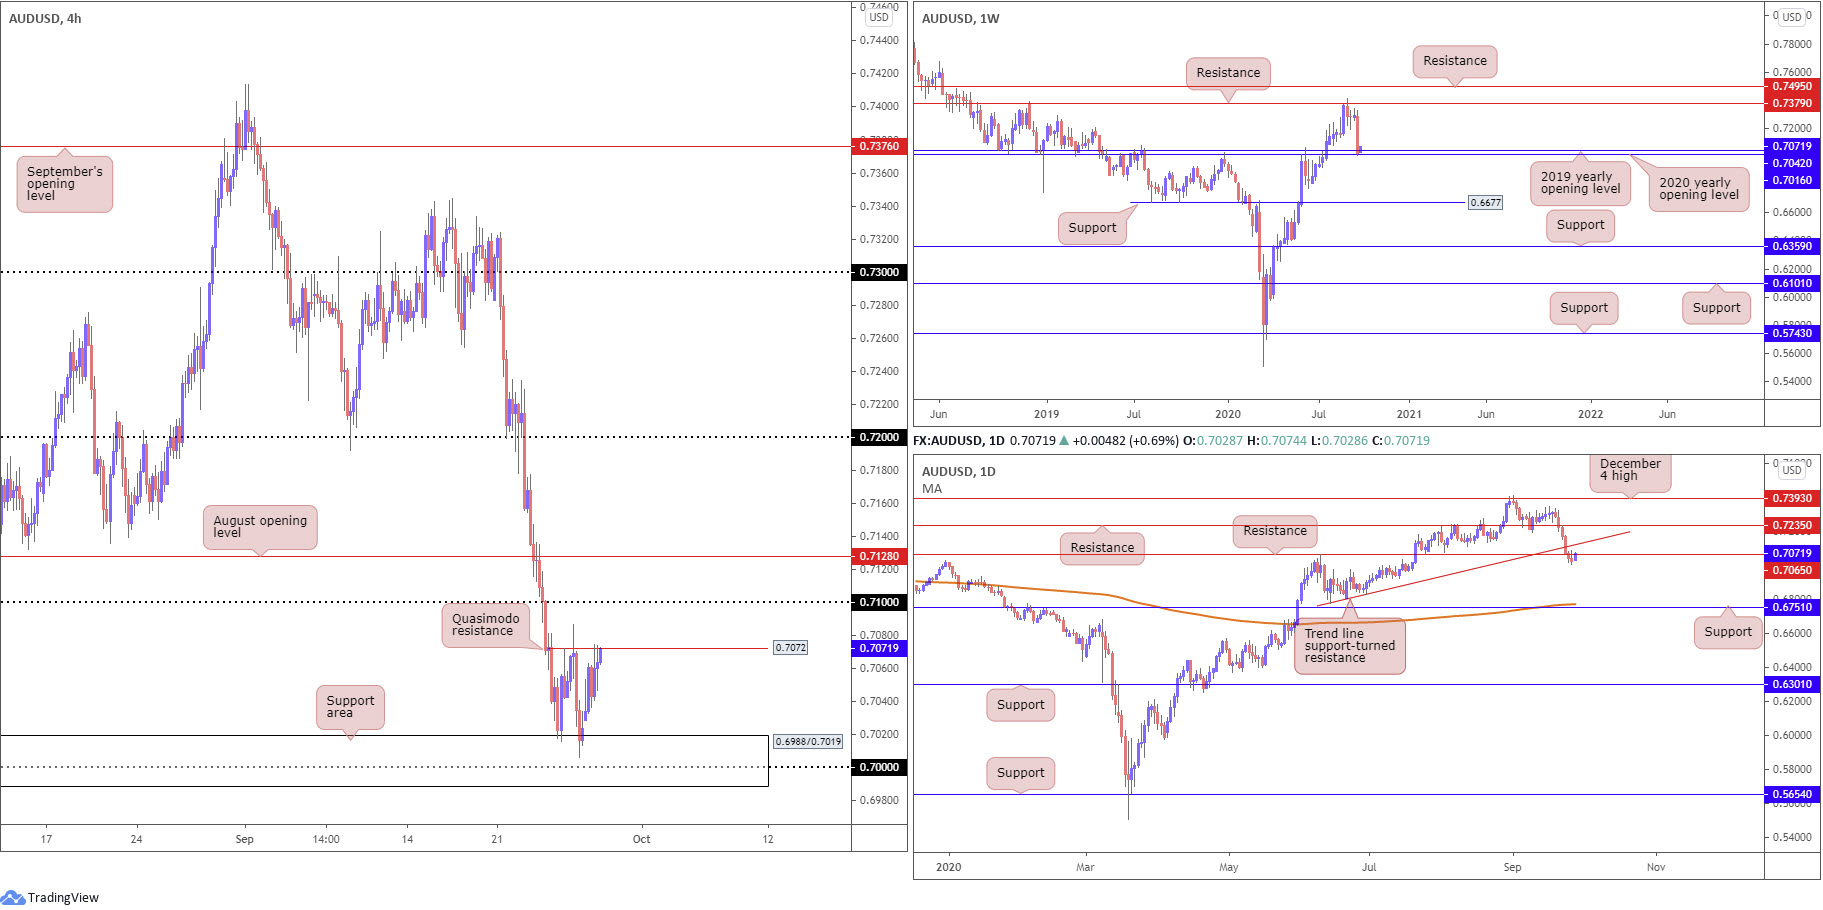
Coming in from the top this morning, the weekly timeframe shows buyers attempting to pencil in a presence from the 2020 and 2019 yearly opening values at 0.7016 and 0.7042, respectively. This follows the pair wiping out more than 250 points last week and establishing a near-full-bodied bearish candle. Should the market fail to derive some much-needed respite from 0.7016 and 0.7042, this suggests scope towards support priced in at 0.6677.
On the daily timeframe, after tumbling through trendline support, extended from the low 0.6776, and support at 0.7065, we can see Monday’s advance attempting to retake 0.7065. Should buyers fail in their attempt, the outlook on the daily timeframe reflects a bearish stance, with room to reach for support at 0.6751 and the 200-day SMA (orange – 0.6773).
The H4 support zone at 0.6988/0.7019, which holds the key figure 0.70 and the 2020 yearly opening level at 0.7016 on the weekly timeframe held firm Monday. This lifted the unit to H4 Quasimodo resistance at 0.7072, with a break exposing the 0.71 handle and then August’s opening value at 0.7128.
Areas of consideration:
In terms of trend, we’ve faced a northerly trajectory since mid-March. This, coupled with weekly support around 0.7016, places a question mark on selling and could stir a break higher for 0.71 (H4).
Consequently, buyers out of the H4 support area at 0.6988/0.7019 (a noted move to watch for in Monday’s briefing) are likely to reduce risk to breakeven at H4 Quasimodo resistance at 0.7072 and target 0.71/0.7128. Fresh intraday buying could also materialise on a break above 0.7072.
USD/JPY:
Monday was an interesting one for USD/JPY. The US dollar index unwound from resistance around 94.65, weighing on the currency pair; on the other side of the field, however, the dominant risk-on mood undermined the safe-haven Japanese yen, consequently limiting downside.
From the weekly timeframe:
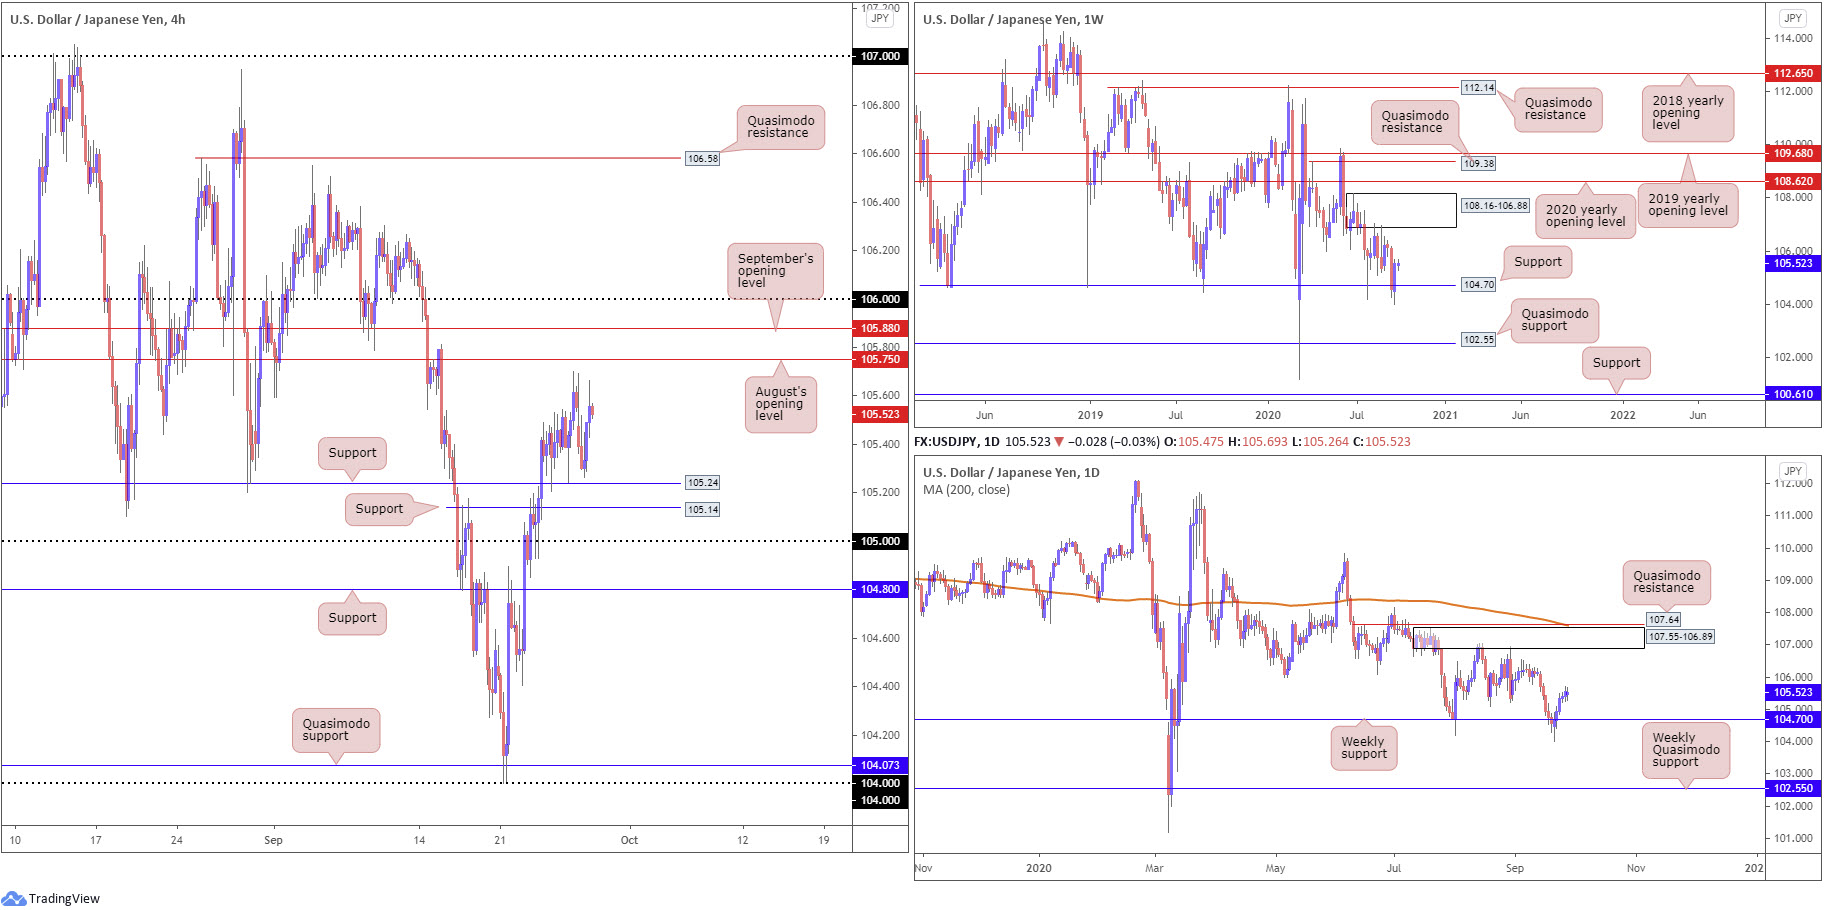
Supply at 108.16-106.88 remains prominent, capping upside since price made its way off support at 104.70 at the end of July. As evident from the weekly chart, the pair recently retested the 104.70 support. Although tumbling to lows at 104.00, the unit regained a strong footing above the aforementioned support last week, adding 100 points. While additional upside is perhaps the favoured course, Quasimodo support at 102.55 offers a feasible target beyond current support in the event we turn south.
Daily timeframe:
Supply at 107.55-106.89, an area housed within the lower boundary of weekly supply mentioned above at 108.16-106.88, has proved tough to takeover. The recovery from weekly support at 104.70 over the course of last week, fashioned by way of five consecutive daily bullish candles, highlights the possibility of readdressing the aforementioned supply. Of note, we can see the daily area also benefits from nearby Quasimodo resistance at 107.64 and the 200-day SMA (orange – 107.60).
H4 timeframe:
For those who read Monday’s technical briefing you may recall the following (italics):
Those long the 105.24 retest (a noted move to watch for in recent analysis) are likely looking for the currency pair to reach for August’s opening value at 105.75, with a break throwing September’s opening value at 105.88 and the 106 handle into the mix.
With price swinging higher from just ahead of support at 105.24 Monday, August’s opening value at 105.75 could make an appearance today.
Areas of consideration:
Weekly support at 104.70 elbowing its way back into the spotlight, together with both the weekly and daily timeframes displaying room to reach 107ish (the underside of weekly/daily supply [106.88/89), underpins the possibility of further buying materialising north of 106 (H4) this week. Above here, resistance appears limited until crossing paths with Quasimodo resistance at 106.58, with a break exposing the 107 handle (and the lower edges of higher timeframe supply).
Given the prospect of higher levels, buyers are likely to take this into consideration with respect to profit taking, with some liquidating partial profits after overcoming resistance.
USD/CAD:
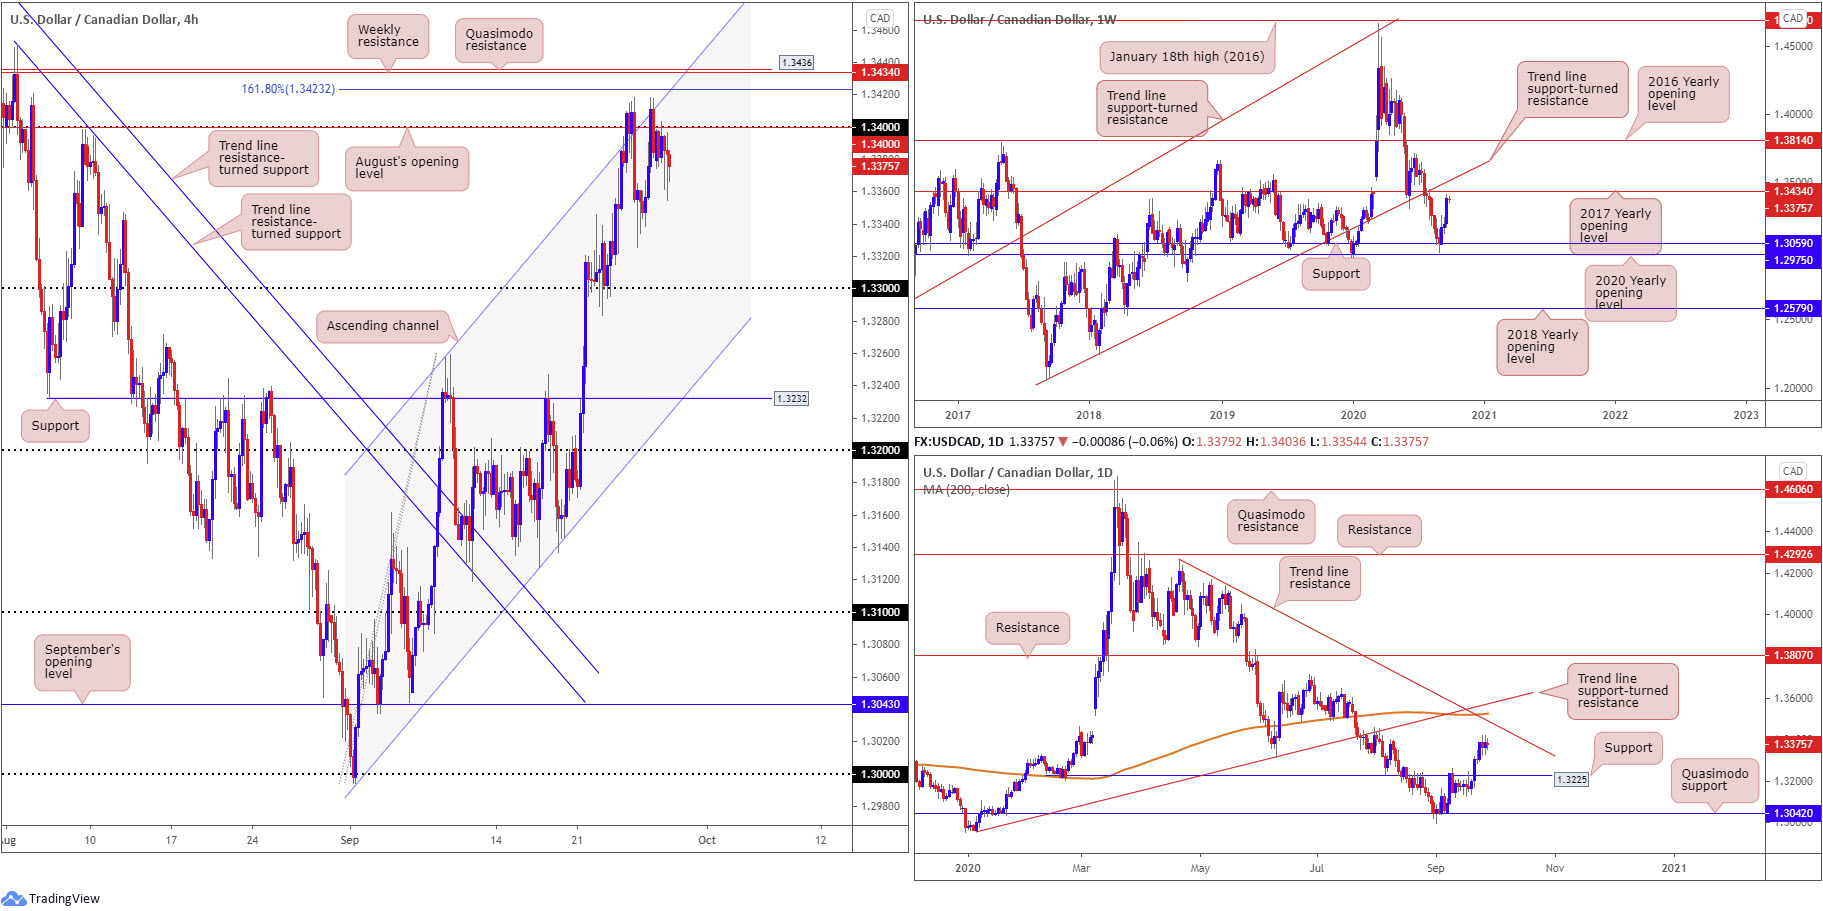
USD/CAD outperformed last week, gaining nearly 200 points. Following a retest at support from 1.3059 (pinned just north of the 2020 yearly opening value at 1.2975) at the beginning of September on the weekly timeframe, the 2017 yearly opening value at 1.3434 (resistance) is visible, therefore a pullback could arise should we challenge the aforementioned area. Brushing aside the level, however, throws trend line support-turned resistance, taken from the low 1.2061, into the mix.
On the daily timeframe, little has changed. Resistance is not expected to make an appearance until trend line resistance, etched from the high 1.4265, which happens to align closely with the 200-day SMA (orange – 1.3525). Also in close view is trend line support-turned resistance, taken from the low 1.2957. While the above hints at the possibility of follow-through buying, a pullback, perhaps caused by weekly resistance at 1.3434, to 1.3225 support is also a scenario worth monitoring.
A closer reading of price action on the H4 timeframe reveals 1.34 and August’s opening value, two levels that merge closely with channel resistance, taken from the high 1.3257, continue to hamper upside. Interestingly, directly above 1.34 lies an area of notable resistance, consisting of a 161.8% Fibonacci extension point at 1.3423, weekly resistance at 1.3434 (2017 yearly opening level) and Quasimodo resistance at 1.3436.
Areas of consideration:
Having seen technical movement offer a somewhat stationary tone on Monday, the areas of consideration remain unchanged.
The fact we’re closing in on weekly resistance at 1.3434, surrounded by a H4 Quasimodo resistance level at 1.3436 and a 161.8% H4 Fibonacci extension at 1.3423, buyers may not have the firepower to take these resistances down this week. With this in mind, a H4 close back under 1.34, off the noted resistances, is likely to stir sellers, targeting at least the 1.33 handle on the H4.
USD/CHF:
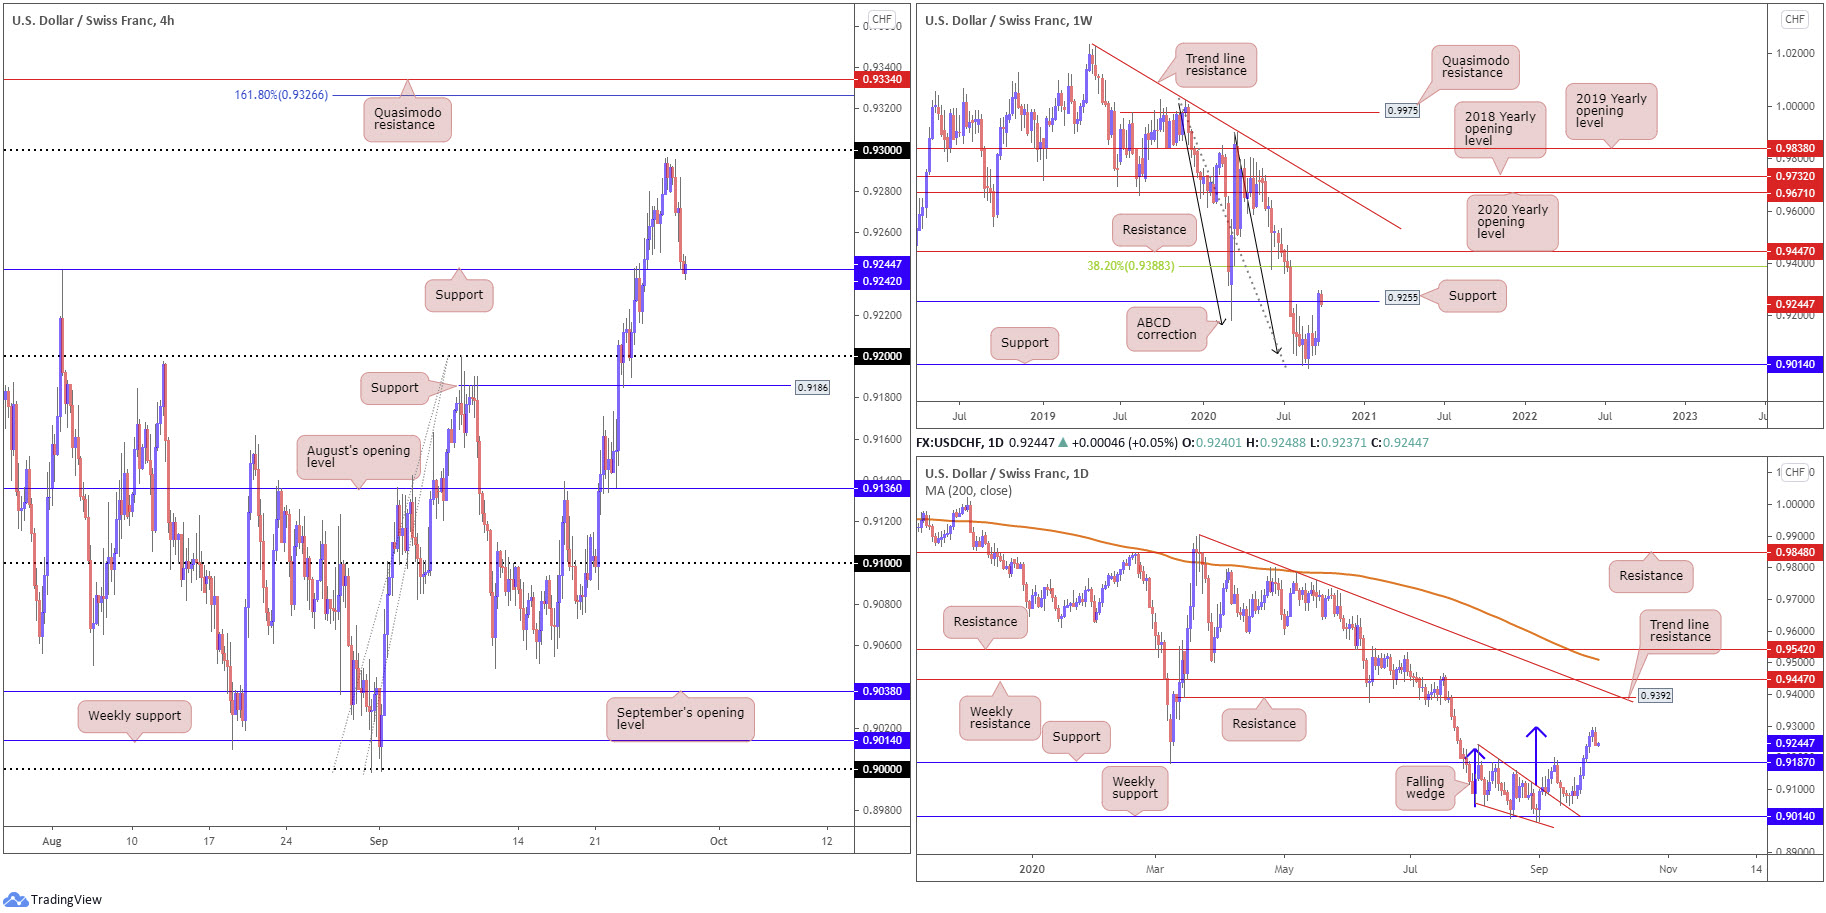
Following six consecutive bullish candles, USD/CHF failed to sustain gains Monday, leaving the 0.93 handle unchallenged on the H4 timeframe. Weighed on the back of broad USD weakness, the H4 candles are now seen crossing swords with support at 0.9242, together with weekly support priced in at 0.9255.
Technically, the rationale behind the recent downturn could be due to striking a daily falling wedge (drawn from the high 0.9241 and a low of 0.9056) take-profit target at (blue arrows) at 0.9297. Also potentially a concern for current long positions is the daily timeframe displays room to dig as far south as support coming in at 0.9187.
Areas of consideration:
Aside from daily resistance, derived from a falling wedge take-profit target, resistance is limited in this market. With that being the case, dip-buying strategies might hone in on H4 support at 0.9242 as a potentially workable location to conduct business. What’s also appealing around 0.9242 is its close relationship with weekly support above it at 0.9255.
Dow Jones Industrial Average:
US stocks rallied strongly Monday amid hopes of additional fiscal stimulus. The Dow Jones Industrial Average added 410.10 points, or 1.51%; the S&P 500 gained 53.14 points, or 1.61% and the Nasdaq traded higher by 203.96 points, or 1.87%.
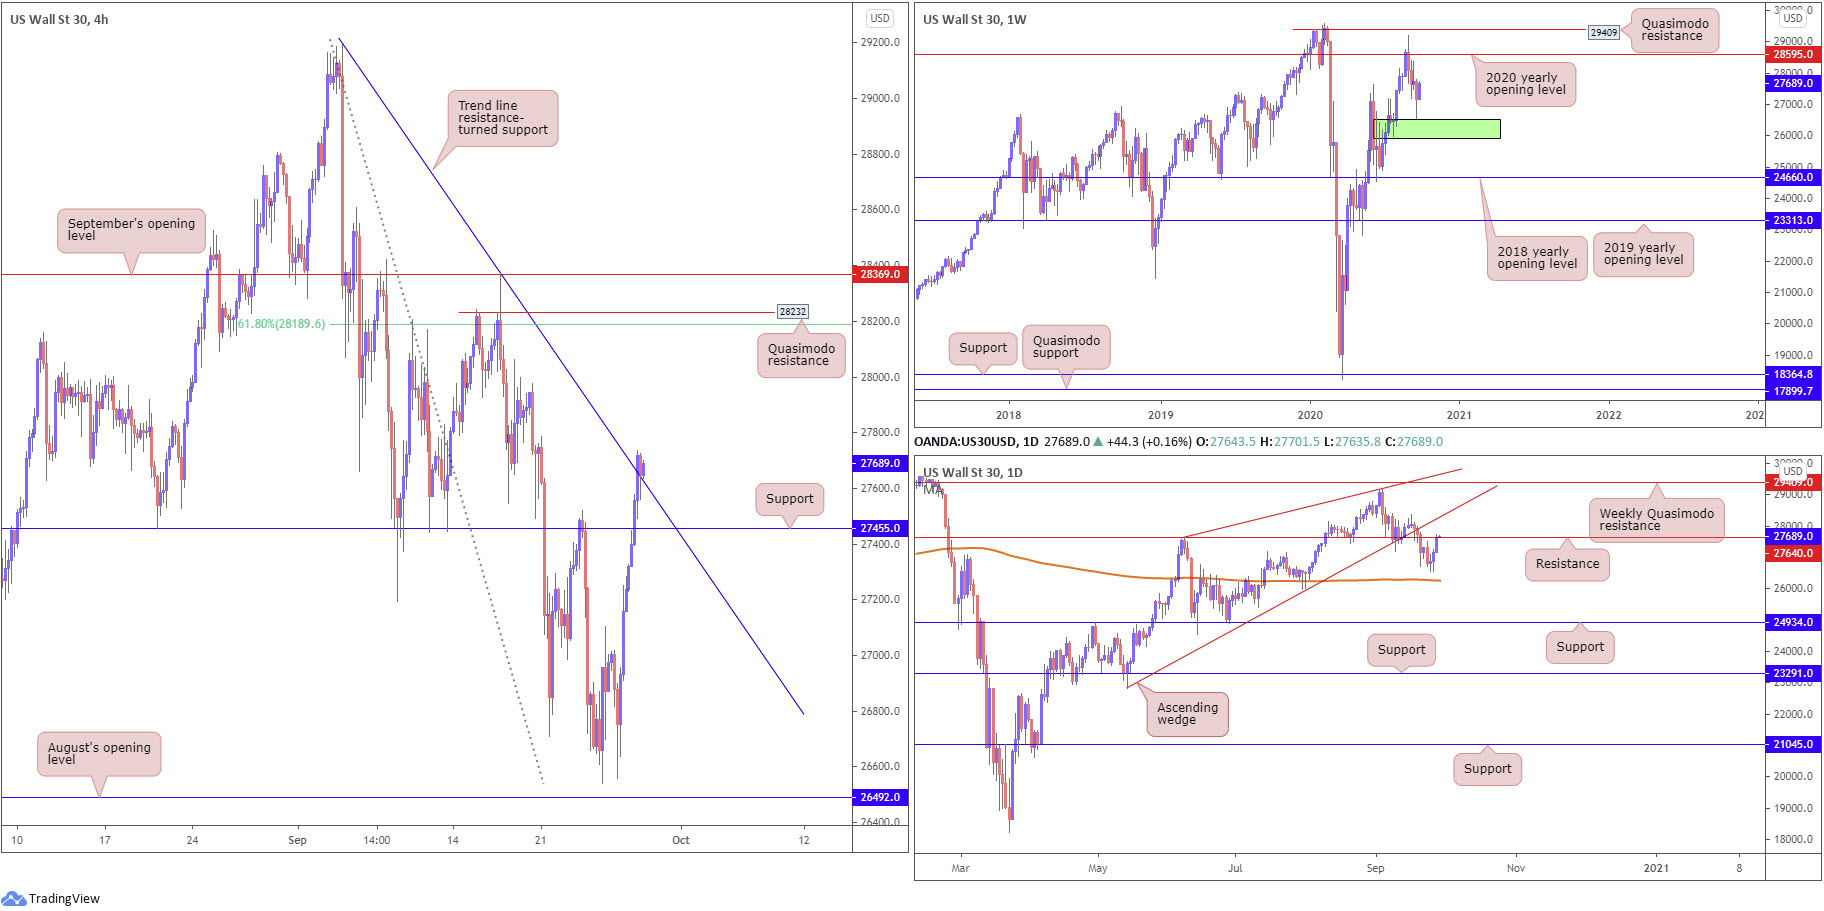
The technical landscape on the weekly timeframe reveals price recently recoiled a few pips north of demand (green) at 25916-26523. Should buyers maintain their presence, reaching for the 2020 yearly opening value at 28595, sited under Quasimodo resistance at 29409, is not out of the question.
Trading on the daily timeframe found a floor ahead of the 200-day SMA (orange – 26263) into the close last week, which was clearly enough to tempt an extension to the upside Monday. As a result of this, resistance moved into play at 27640.
With markets adopting risk-on trade Monday, H4 resistance at 27455 was taken out (now a serving support) and also, in recent hours, the trend line resistance, extended from the high 29193. Further interest to the upside today shines the headlights on a H4 Quasimodo resistance level at 28232 and 61.8% Fibonacci retracement ratio at 28189, followed by September’s opening value at 28369.
Areas of consideration:
H4 crossing above trend line resistance, by and of itself, is a signal buyers may want to take things higher. This was also given the green light from the weekly timeframe, exhibiting scope to approach the 28595 region. The problem arises when we factor in the daily timeframe: resistance at 27640.
Conservative buyers, aware of daily resistance, are likely to wait and see if H4 pencils in a bullish candlestick signal off H4 trend line support before pulling the trigger. Some traders, however, might be comfortable taking long positions at current price, knowing the weekly timeframe backs the setup.
XAU/USD (GOLD):
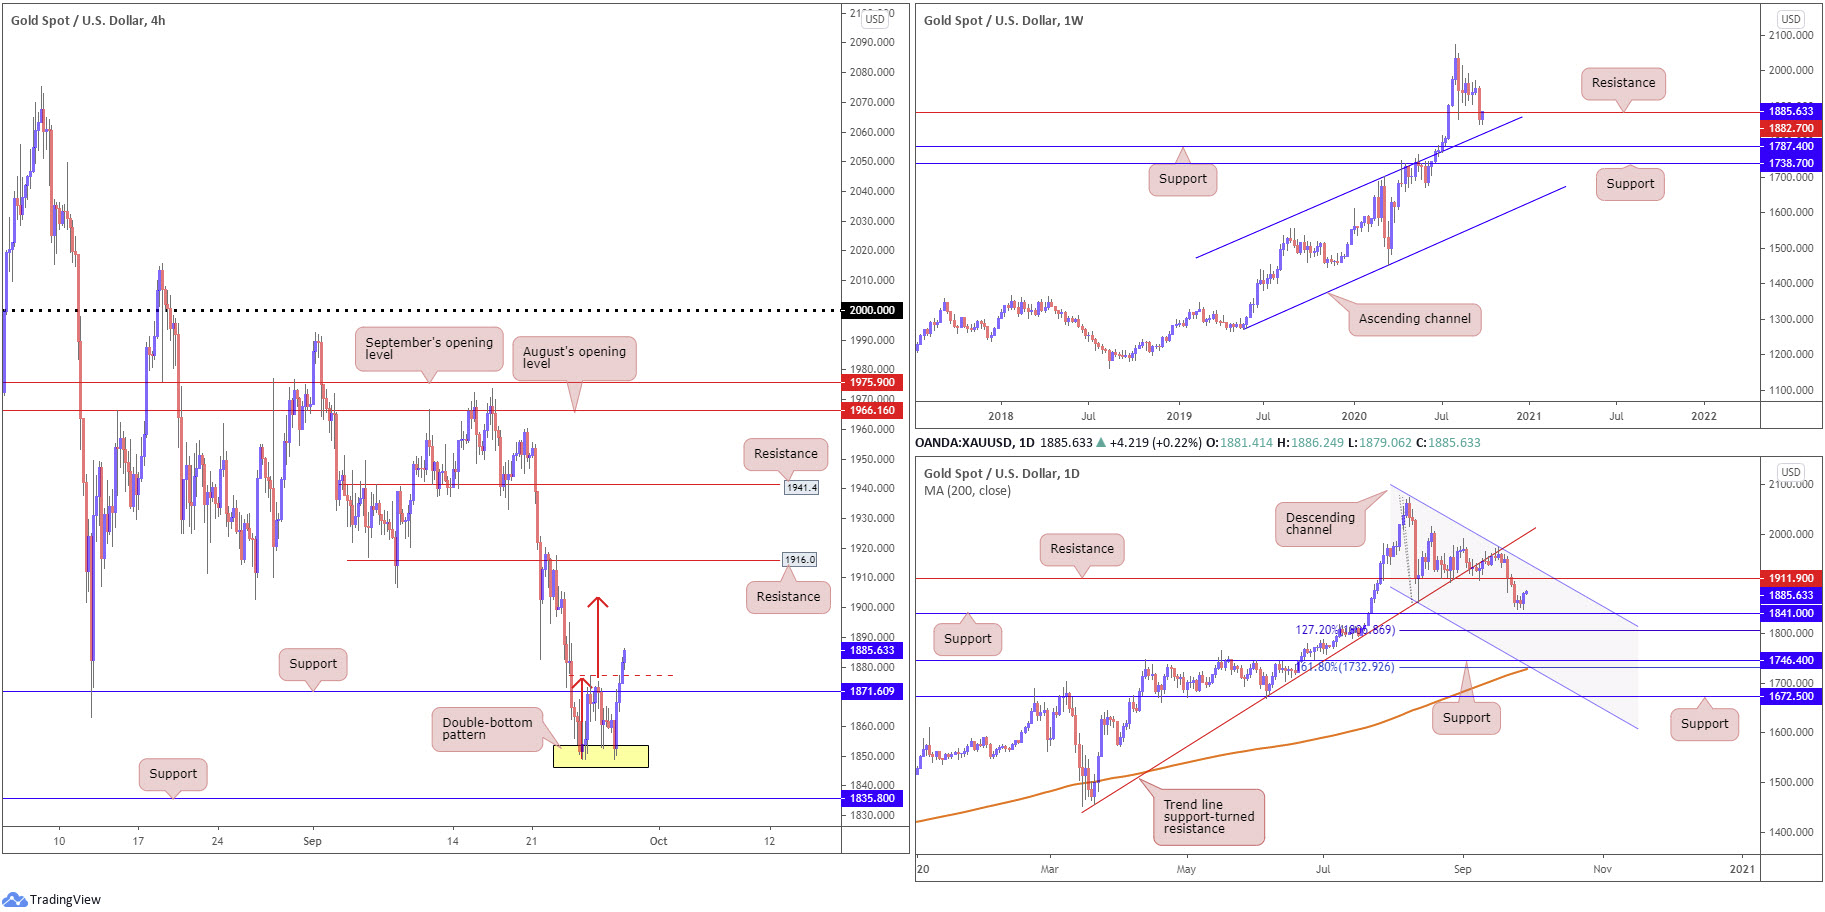
With the US dollar index ducking lower from daily resistance, spot gold adopted an offensive phase Monday, generating enough oomph to overthrow H4 resistance at $1,871 and the neckline of a double-bottom pattern (yellow – $1,849) at $1,877. As evident from the H4 chart, the double-bottom take-profit target sits at $1,903 (red arrows), followed by H4 resistance at $1,916.
Factoring weekly structure into our analysis, however, shows $1,882 is currently being retested as resistance, after failing to test channel resistance-turned support, etched from the high $1,703.
On the daily timeframe, room is seen for buyers to stretch their legs until shaking hands with resistance at $1,911.
Areas of consideration:
Weekly resistance at $1,882 is unlikely to carry enough fuel to hamper upside, according to technical studies. The yellow metal has been trading decisively higher since 2016, a double-bottom pattern is seen on the H4 timeframe and daily price displays room to approach resistance at $1,911. Therefore, buyers may continue pushing for the double-bottom take-profit target at $1,903 today, with the possibility of also bringing in daily resistance at $1,911 and also H4 resistance from $1,916.
The accuracy, completeness and timeliness of the information contained on this site cannot be guaranteed. IC Markets does not warranty, guarantee or make any representations, or assume any liability regarding financial results based on the use of the information in the site.
News, views, opinions, recommendations and other information obtained from sources outside of www.icmarkets.com.au, used in this site are believed to be reliable, but we cannot guarantee their accuracy or completeness. All such information is subject to change at any time without notice. IC Markets assumes no responsibility for the content of any linked site.
The fact that such links may exist does not indicate approval or endorsement of any material contained on any linked site. IC Markets is not liable for any harm caused by the transmission, through accessing the services or information on this site, of a computer virus, or other computer code or programming device that might be used to access, delete, damage, disable, disrupt or otherwise impede in any manner, the operation of the site or of any user’s software, hardware, data or property.


