
Key risk events today:
Spanish Unemployment Rate; US Core Durable Goods Orders m/m; US Durable Goods Orders m/m; US CB Consumer Confidence; Richmond Manufacturing Index.
(Italics represents previous analysis and outside sources).
EUR/USD:
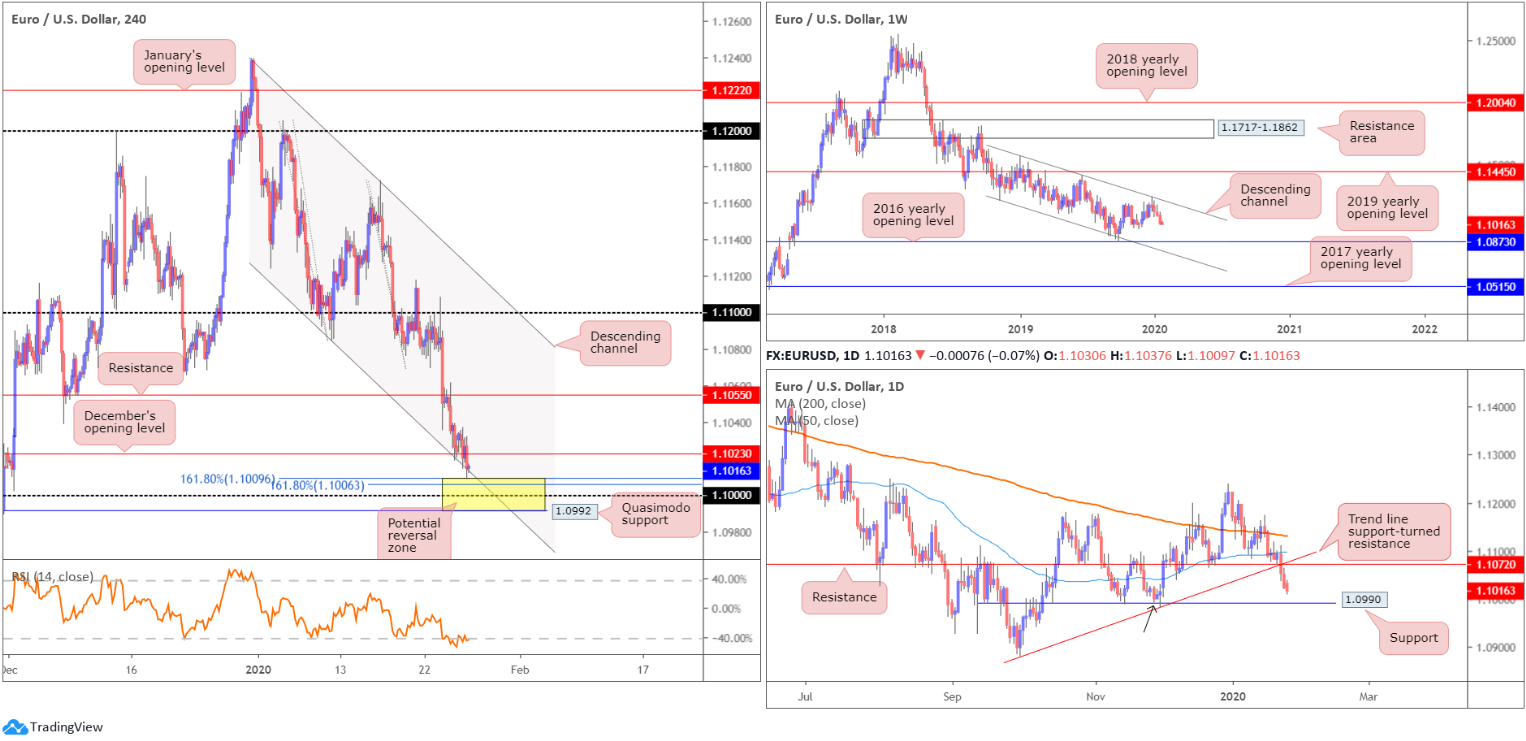
EUR/USD extended losses for a third successive session Monday, pressured by a firmer USD and German business morale deteriorating in January. According to the Institute for Economic Research, the IFO Business Climate Index fell from 96.3 points in December to 95.9 points in January. This was due to companies’ more pessimistic outlook for the coming months. In contrast, the indicator of the current situation rose slightly. The German economy is starting the year in a cautious mood.
Traders who read Monday’s technical briefing may recall the following pieces on H4:
Support, in the form of December’s opening level at 1.1023, entered the fold in the closing hours, reinforced by channel support, pencilled in from the low 1.1085. South of these levels we also have an interesting area of support between 1.0992 and 1.1009 (comprised of Quasimodo support at 1.0992, the key figure 1.10, the noted channel support and two 161.8% Fibonacci extensions at 1.1006 and 1.1009 – yellow). Chart studies also show the relative strength index (RSI) testing oversold waters.
While a bounce from December’s opening level at 1.1023 could materialise today/early week, the H4 support zone beneath it at 1.0992/1.1009 is likely to pack more of a punch, in terms of an upside move. Note also daily support is seen positioned just two points south of the said H4 support area at 1.0990.
Entry at 1.1009 is an option, with a protective stop-loss order sited under 1.0990, targeting a move beyond 1.1023 to H4 resistance at 1.1055, closely followed by daily resistance at 1.1072. Advancing much beyond this level is unlikely since weekly price portends additional selling to 1.0873.
As evident from the H4 timeframe, price tested the top edge of 1.0992/1.1009 in recent hours.
Higher-timeframe structure is pretty much unchanged; here’s what Monday’s analysis had to report, beginning with the weekly timeframe:
Europe’s single currency glided to a fourth consecutive weekly loss vs. the buck in recent trade, as sellers strengthened their grip south of long-standing channel resistance, drawn from the high 1.1569. Assuming sellers remain in the driving seat this week, the 2016 yearly opening level at 1.0873 is feasible support followed by channel support, taken from the low 1.1109. Further supporting sellers is the primary trend, descending lower since topping in early 2018, at 1.2555.
Daily timeframe:
Support at 1.1072, as well as trend line support, taken from the low 1.0879, surrendered Thursday, with Friday sporting a continuation move lower. The next layer of support lies close by at 1.0990, boasting a reasonably sound history and representing a Quasimodo support at the 1.0992 November 27 low (black arrow).
Traders may also find interest in noting that the 200-day SMA (orange – 1.1131) has been drifting lower since mid-June, while the 50-day SMA (blue – 1.1096) appears to be flattening after rising from 1.1042ish.
Areas of consideration:
Well done to any traders long 1.0992/1.1009. A H4 close above December’s opening level at 1.1023 is likely on the radar for many before reducing risk. As stated above, the next resistance targets beyond here rest at H4 resistance drawn from 1.1055, closely followed by daily resistance at 1.1072.
GBP/USD:
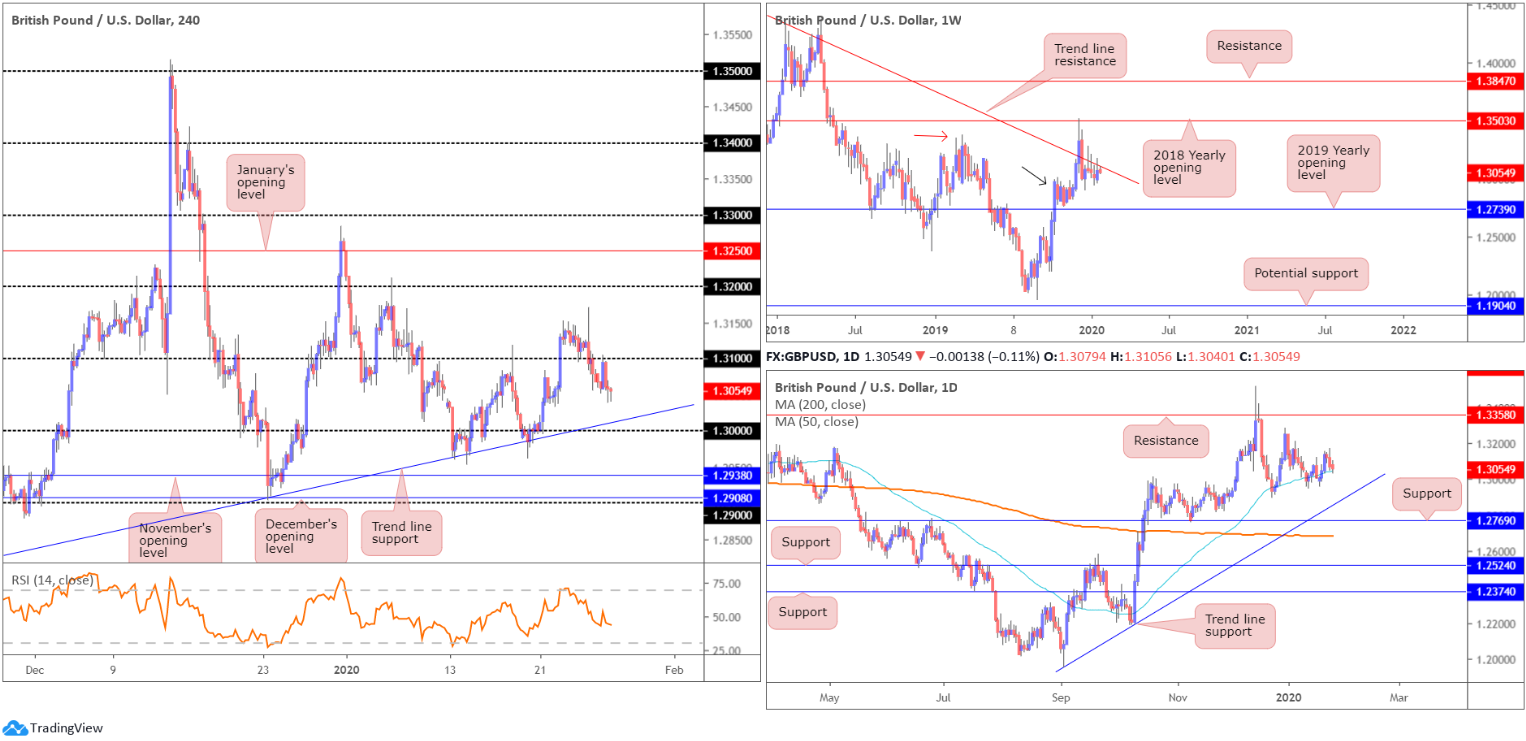
Sterling pared session highs a few points north of the 1.31 handle in early London Monday, and is, at the time of writing, challenging the lower edge of the daily range around 1.3050ish. In terms of support targets on the H4 timeframe, familiar trend line support is visible, fixed from the low 1.2768, and the key figure 1.30.
For traders who read Monday’s technical briefing you may recall the following:
A sell from the underside of 1.31 is a possibility this week, according to the charts. Whether entry is taken at the open, based on the recent retest, or traders wait and see if another retest forms, is trader subjective. The next support target is set at the 50-day SMA (blue – 1.3048 [daily timeframe]), trailed by the current H4 trend line support and then 1.30.
An ideal scenario is to be able to reduce risk to breakeven at the 50-day SMA so if we turn higher from here the worst-case scenario is a scratch trade.
Well done to any readers who managed to fade 1.31 yesterday.
Higher on the curve, GBP/USD found mild support off the 50-day SMA. Since early October 2019, the said SMA has been drifting northbound and supported price on several occasions since. A violation exposes trend line support, drawn from the low 1.1958, support at 1.2769 and the 200-day SMA (orange – 1.2688). Note this SMA is in the process of flattening after drifting south since the beginning of July. With respect to resistance on the daily timeframe, the only levels of interest right now sit at the 1.3284 December 31st high and 1.3358, which capped upside since mid-June 2019.
Weekly price, as underlined in Monday’s report, remains consolidating between long-standing trend line resistance, pencilled in from the high 1.5930, and demand around the 1.2939 region (black arrow), likely seduced by the recent break of the notable high at 1.3380 (red arrow). A break of the said trend line has the 2018 yearly opening level at 1.3503 to target, whereas a move south implies we might see a push to the 2019 yearly opening level at 1.2739, consequently tripping sell stops below the current demand zone.
Areas of consideration:
Traders short the 1.31 retest have (hopefully) reduced risk to breakeven at the test of the 50-day SMA. The take-profit targets beyond this level, underlined above, is H4 trend line support, followed by 1.30.
AUD/USD:
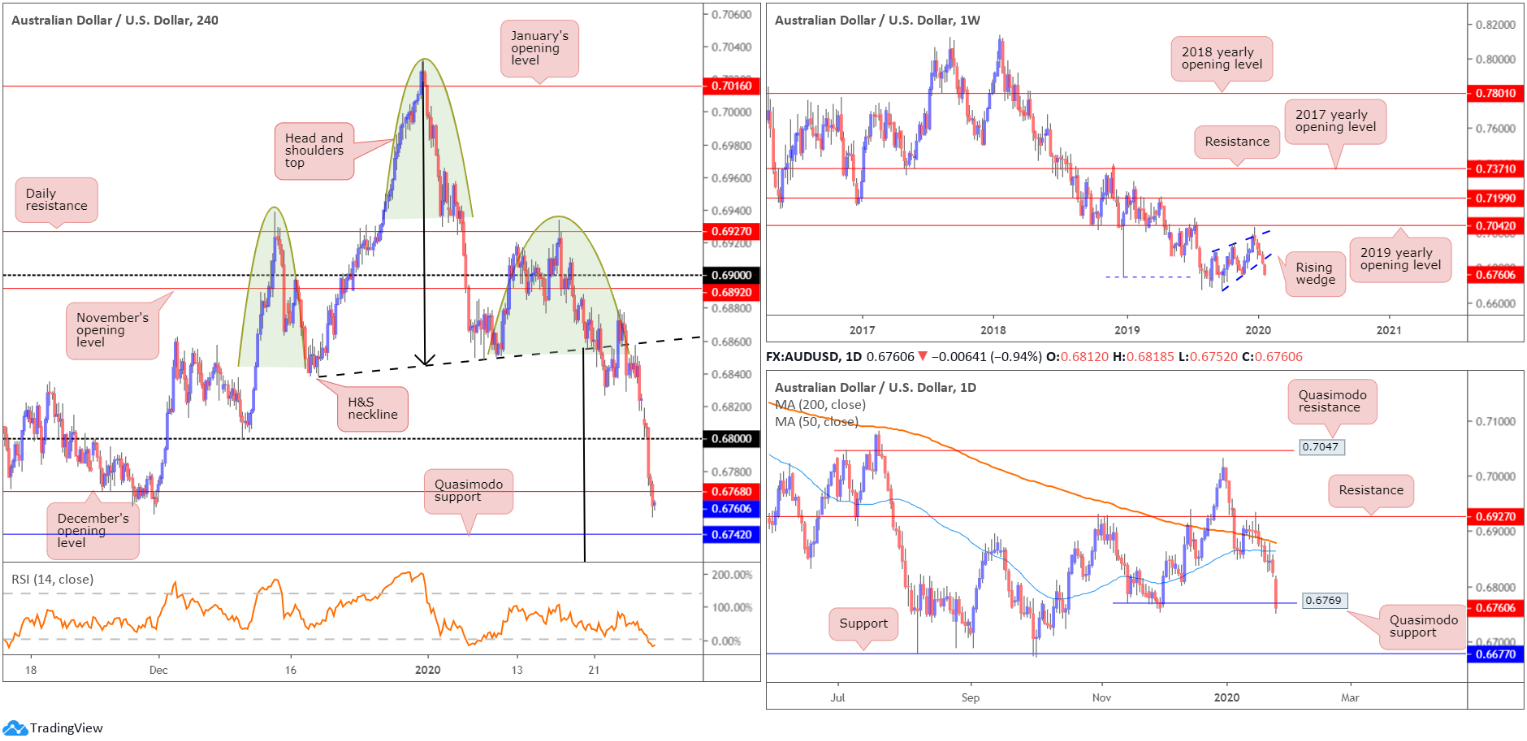
Overall risk aversion, coupled with consequences of the Coronavirus, guided AUD/USD lower Monday, erasing more than 60 points and closing towards the bottom of its 0.6818/0.6752 range.
H4 movement gave up 0.68-status and dethroned December’s opening level at 0.6768. The next port of call falls in close by at 0.6742, a Quasimodo formation, with a break exposing 0.67. Also note the relative strength index (RSI) is seen hovering a touch north of the 20.00 value.
Traders who read previous reports may also recall the following pieces (italics):
H4 price has been chalking up a potential head and shoulders top pattern since mid-December 2019 (left shoulder sports a top at 0.6938, right shoulder at 0.6933 and the head at 0.7031 – green). The neckline is drawn from the 0.6838 December 18 low and the 0.6850 January 9 low (black line).
As evident from the H4 timeframe, price closed beneath the H&S neckline last Tuesday and remained south of the line Wednesday and also closed lower on Thursday. Although an initial (structure) target can be seen at 0.68, H&S traders will be looking for much lower levels (calculation from the head to neckline added to the breakout point sees a termination point around 0.6671 – black arrows).
There will likely already be traders short this market on last Tuesday’s H4 close south of the H&S neckline. Stop-loss placement potentially falls in above the right shoulder 0.6933, above the round number 0.69 or November’s opening level at 0.6892. In addition, as evident from the H4 chart, price retested the H&S neckline on Friday and rotated lower. This was another noted entry point.
Well done to any readers short the H&S pattern.
On more of a broader perspective, the weekly timeframe, since registering a bottom in late September at 0.6670, has been carving out what appears to be a rising wedge formation, typically considered a continuation pattern. The past four weeks witnessed price decline back into the rising wedge and, thanks to recent selling, a break of the lower edge was seen yesterday. With the primary downtrend having been in full force since topping at 0.8135, in early 2018, the recent close beyond the lower edge of the noted wedge formation may trigger weighty sell stops, both from lower-timeframe traders entering long the shorter-term correction and longer-term traders’ breakout sell orders.
Price action on the daily timeframe continues to explore ground beneath both the 200-day SMA (orange – 0.6880) and the 50-day SMA (blue – 0.6864), recently pushing through Quasimodo support at 0.6769.
Areas of consideration:
Well done to any readers short the H4 H&S formation, either on Tuesday’s breakout or Friday’s neckline retest. With 0.68 and December’s opening level at 0.6768 cleared, H4 Quasimodo support at 0.6742 is next on tap. Beyond here, 0.67 is visible, with a break displaying the H&S take-profit target around 0.6670ish.
Additional selling, based on a H4 retest at 0.6768, preferably in the shape of a H4 or H1 bearish candlestick pattern (entry and risk can be defined according to this configuration), may also be an option worthy of consideration.
USD/JPY:
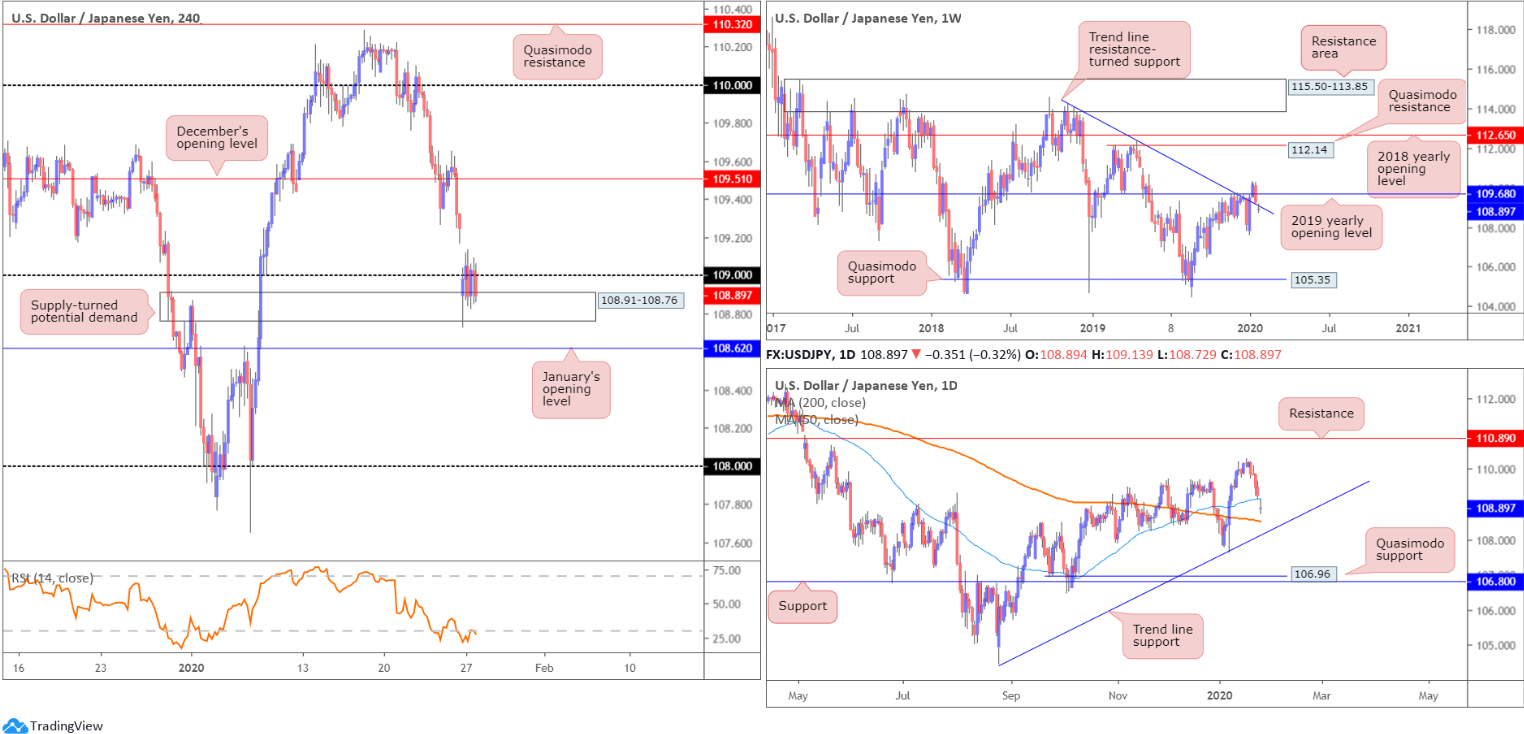
The Japanese yen, perceived as a safe haven in times of geopolitical turmoil, firmed Monday amid widespread fears of a virus outbreak. US Treasury yields fell to their lowest since last October and US equities plunged.
USD/JPY kicked off the week a few points south of 109, following a 35-point opening gap. As evident from the H4 chart, supply-turned demand at 108.91-108.76 holds ground, though is struggling to gain traction past 109, despite modest buying witnessed in the US dollar index. Below the current demand, January’s opening level at 108.62 is visible, with a break exposing a reasonably clear path to the 108 handle.
The story on the weekly timeframe has price trading marginally beneath the 2019 yearly opening level at 109.68 and, thanks to yesterday’s opening gap, now a touch beneath trend line resistance-turned support, extended from the high 114.23. Buying from here may set the long-term stage for a run to Quasimodo resistance at 112.14 and the 2018 yearly opening level at 112.65, whereas moves lower underscores the 107.65 Jan 6 low.
The recent decline on the daily timeframe brought price through the 50-day SMA (blue – 109.16). Note the said SMA crossed above the 200-day SMA (orange – 108.51) mid-December, referred to as a ‘Golden Cross’. Trend line support, drawn from the low 104.44, may enter sight this week, in the event we continue exploring lower ground, while a push higher has the 110.29 January 17 high to play for, with a break targeting resistance at 110.89.
Areas of consideration:
The H4 supply-turned demand at 108.91-108.76 is in focus this morning, confirmed by the H4 relative strength index (RSI) testing oversold territory. A decisive close above 109 out of the said zone might be enough to fill the weekend gap and try for December’s opening level at 109.51.
Entry long (buy) can be found on the close of the breakout candle above 109, with protective stop-loss orders positioned accordingly.
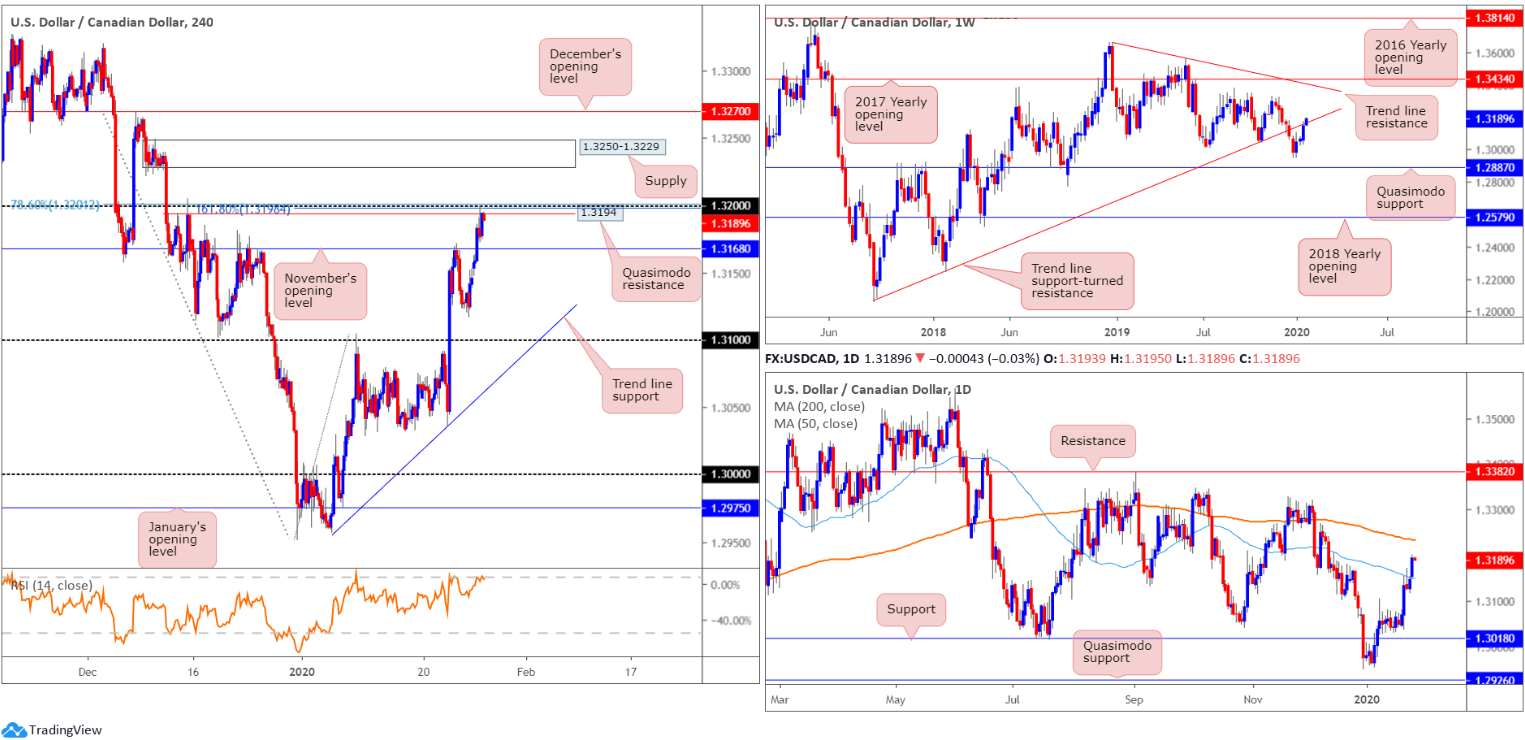
USD/CAD:
In recent sessions, USD/CAD extended Friday’s recovery, adding more than 45 points, or 0.36%. Weaker oil prices undermined the Canadian dollar and the US dollar index modestly firmed.
From the top of the technical pile this morning, weekly activity is attempting to overpower trend line support-turned resistance, extended from the low 1.2061. Continued bidding from here could reach tops around 1.3317, closely followed by trend line resistance (1.3661) and the 2017 yearly opening level at 1.3434. A rejection lower, on the other hand, may prompt a selloff to the 1.2951 December 30 low, followed by a Quasimodo formation at 1.2887. The immediate trend has faced north since bottoming in September 2017; however, this move could also be considered a deep pullback in a larger downtrend from the 1.4689 peak in early January 2016.
A closer reading of price action on the daily timeframe saw the unit cross through the 50-day SMA (blue – 1.3149). The breach unlocks the door for an approach towards the 200-day SMA (orange – 1.3233). Both SMAs currently point south.
Shorter-term flow on the H4 timeframe is fading an interesting spot of resistance around the 1.32 band. Comprised of a Quasimodo resistance level at 1.3194, the 1.32 handle, the 78.6% Fibonacci retracement at 1.3201, a 161.8% Fibonacci extension at 1.3198 and the relative strength index (RSI) testing overbought terrain, this combination is likely to force a retest at 1.3168, November’s opening level, and perhaps Quasimodo support at 1.3126.
Areas of consideration:
Entry short at current price is an option, based on H4 reflecting a reasonably confluent area of resistance around 1.32. Protective stop-loss orders can be positioned above the Quasimodo apex at 1.3204, though this is trader dependent.
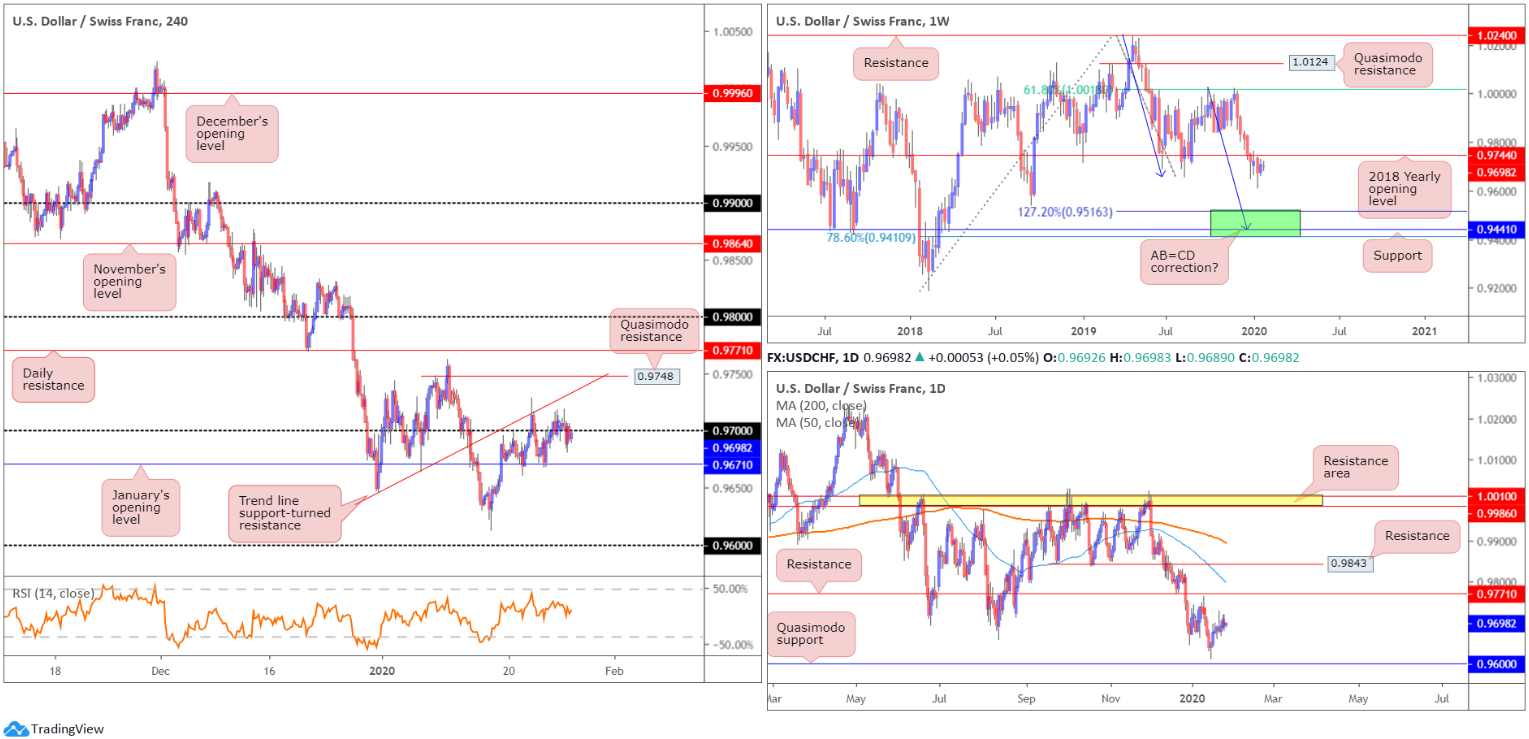
USD/CHF:
The US dollar concluded Monday a shade lower vs. the Swiss franc, tunnelling through 0.97 on the H4 and exposing January’s opening level at 0.9671. Above 0.97, the technical spotlight shines on Quasimodo resistance at 0.9748, as well as trend line support-turned resistance, extended from the low 0.9646. Beyond 0.9671, the 0.9613 January 16 low is in sight, closely followed by the 0.96 handle.
In terms of the weekly and daily timeframes, Monday’s report holds strong:
Holding south of the 2018 yearly opening level at 0.9744, last week drifted within the confines of the prior week’s range at 0.9736/0.9613. The next downside target sits within 0.9410/0.9516, comprised of a 78.6% Fibonacci retracement at 0.9410, support at 0.9441 and a 127.2% AB=CD bullish correction (black arrows]) at 0.9516 – green. Overthrowing 0.9744 this week, however, likely clears the river north back up to the 61.8% Fibonacci retracement at 1.0018, a level that’s capped upside since mid-June 2019.
Daily perspective:
According to structure on the daily timeframe, price could swipe either way this week. Resistance is positioned at 0.9771 and support, shaped in the form of a Quasimodo formation, at 0.9600. It might also interest some traders to note the 200/50-day SMAs point southbound (0.9896/0.9798), with the spread expanding since late December.
Areas of consideration:
Having noted weekly resistance plotted at 0.9744, which aligns closely with H4 Quasimodo resistance at 0.9748 and H4 trend line resistance, this area is a zone worthy of the watchlist for shorts (sells), in the event we push north of 0.97 sometime this week. However, waiting for additional H4 candlestick confirmation to form (entry and risk can be calculated based off this pattern) is still probably a good idea for traders threatened by a potential move to daily resistance at 0.9771.
The initial downside target off 0.9748/4 sits at the 0.97 level.
Should the market hold sub 0.97 and reclaim 0.9671, we could then be in for a run to the 0.96 region, which you may recall also represents daily Quasimodo support. Traders have the option of simply entering short the H4 breakout candle’s close and positioning stops accordingly, or waiting and seeing if a retest at 0.9671 occurs before pulling the trigger.
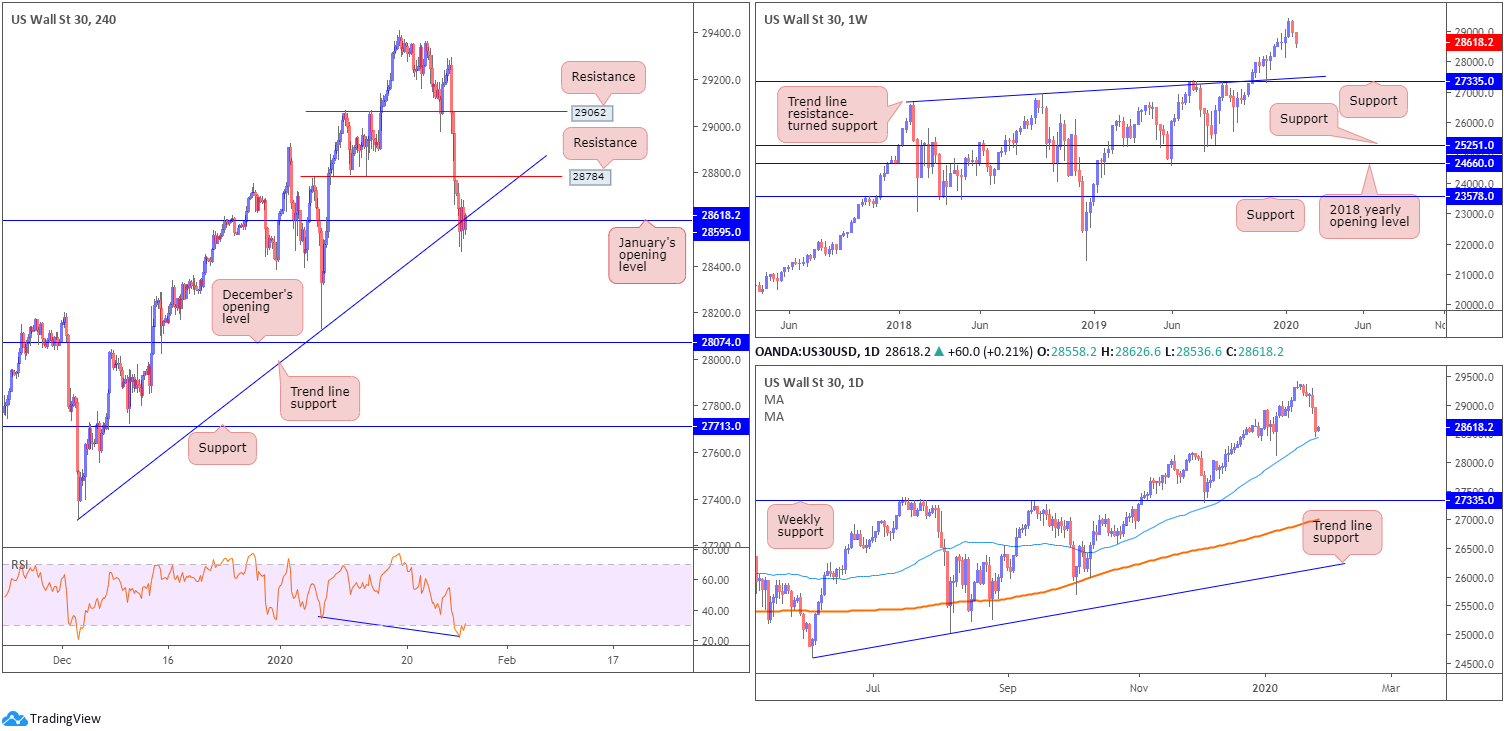
Dow Jones Industrial Average:
Major US benchmarks wrapped up sharply lower Monday, recording their worst daily losses in months. This comes amid increased concerns regarding the economic consequences of the Coronavirus. The Dow Jones Industrial Average lost 453.93 points, or 1.57%; the S&P 500 erased 51.84 points, or 1.57% and the tech-heavy Nasdaq 100 ended lower by 189.29 points, or 2.07%.
Technical research based on the H4 timeframe has the candles testing trend line support, extended from the low 27314 and January’s opening level at 28595, confirmed by the relative strength index (RSI) forming hidden bullish divergence within oversold territory (blue line). Buying from current price has resistance priced in at 28784 in view, with a break highlighting 29062 as the next potential resistance point.
Higher-timeframe action has daily price trading a touch above its 50-day SMA (blue – 28434), while weekly price exhibits scope to push as far south as trend line resistance-turned support (26670), and support coming in at 27335.
Areas of consideration:
Traders will likely be watching for buying opportunities off the current H4 trend line support today. A break of H4 resistance at 28784 will help confirm buyer intent to at least H4 resistance at 29062.
A decisive H4 close south of the said trend line support (preferably followed up with a retest), nonetheless, may trigger additional selling towards December’s opening level at 28074.
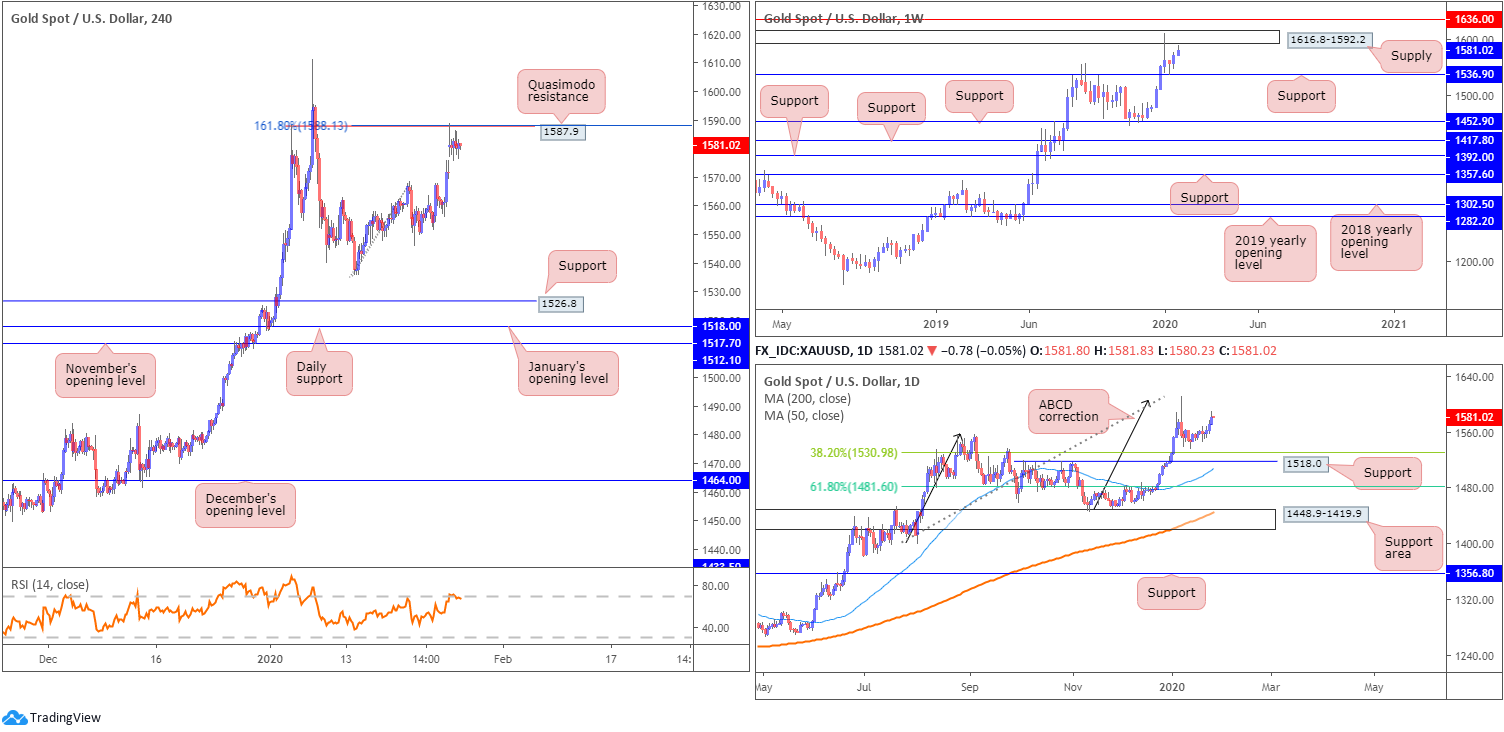
XAU/USD (GOLD):
Concerns regarding the coronavirus, along with the ongoing slump in US Treasury yields, increased demand for the safe-haven metal Monday. However, aside from the opening gap reaching highs of 1588.7, volatility was subdued as the unit latched onto H4 Quasimodo resistance at 1587.9/the 161.8% Fibonacci extension at 1588.1. It might also interest some traders to note the relative strength index (RSI) is seen testing its overbought value.
What’s interesting from a technical perspective is a few points north of the current H4 Quasimodo lies weekly supply drawn from 1616.8-1592.2.
According to the daily chart, price action turned higher just ahead of the 38.2% Fibonacci retracement at 1530.9, closely followed by 1518.0. The former offers an initial take-profit target for traders short the ABCD bearish correction (black arrows) at 1608.0.
Areas of consideration:
Given weekly supply lurks just north of the current H4 Quasimodo resistance level, further selling could be in store. However, seeing as there’s a risk of price action driving higher into the said weekly supply before turning lower, traders are urged to wait for at least additional candlestick confirmation before pulling the trigger. This helps identify seller intent and provides entry and risk levels to work with.
The accuracy, completeness and timeliness of the information contained on this site cannot be guaranteed. IC Markets does not warranty, guarantee or make any representations, or assume any liability regarding financial results based on the use of the information in the site.
News, views, opinions, recommendations and other information obtained from sources outside of www.icmarkets.com.au, used in this site are believed to be reliable, but we cannot guarantee their accuracy or completeness. All such information is subject to change at any time without notice. IC Markets assumes no responsibility for the content of any linked site.
The fact that such links may exist does not indicate approval or endorsement of any material contained on any linked site. IC Markets is not liable for any harm caused by the transmission, through accessing the services or information on this site, of a computer virus, or other computer code or programming device that might be used to access, delete, damage, disable, disrupt or otherwise impede in any manner, the operation of the site or of any user’s software, hardware, data or property.


