
Key risk events today:
US Core Durable Goods Orders m/m and Durable Goods Orders m/m; US CB Consumer Confidence.
(Previous analysis as well as outside sources – italics).
EUR/USD:
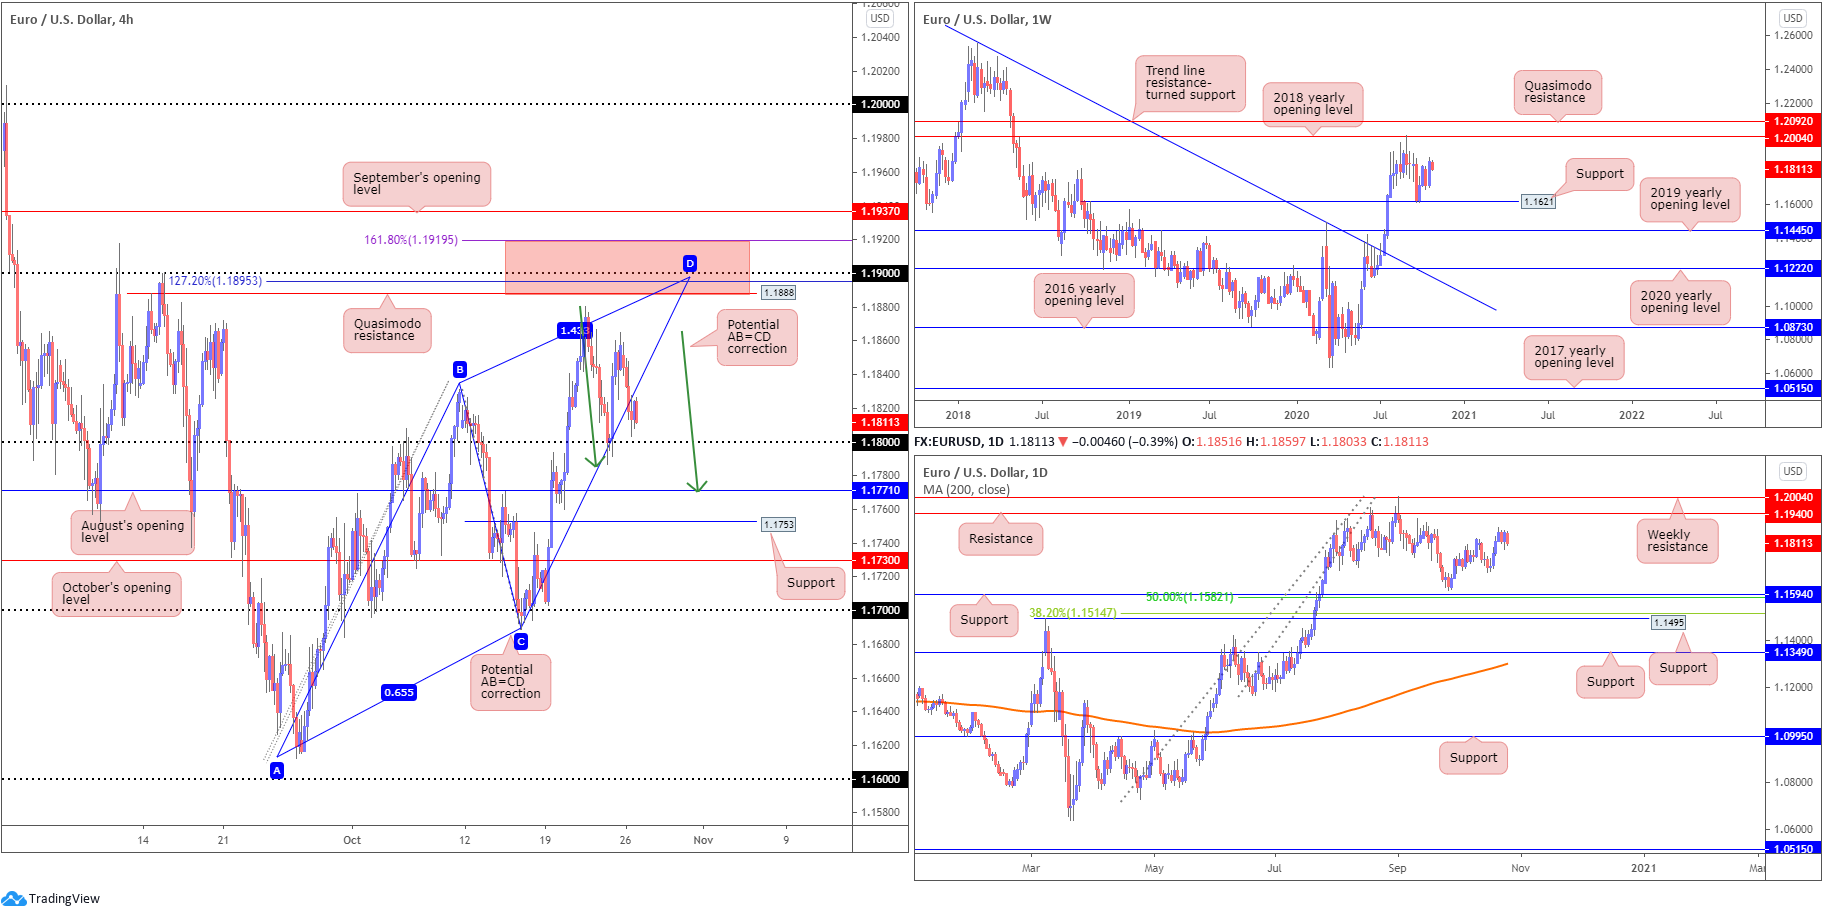
As the US dollar index latched onto a safe-haven bid from daily support at 92.62 on Monday, Europe’s shared currency rotated lower and bottomed north of the 1.18 handle on the H4 heading into London hours. Breaching the latter shines the spotlight on August’s opening value at 1.1771 and an AB=CD bullish pattern (green arrows) at 1.1769. Aside from last Wednesday’s session peak at 1.1880, H4 Quasimodo resistance at 1.1888 is considered the next upside target. What’s interesting here is the level is sited close by a 127.2% Fibonacci projection point at 1.1895, the 1.19 handle, along with an AB=CD correction point at 1.1905 and a 1.618 BC projection plotted at 1.1919.
From the weekly timeframe, we remain holding north of minor support at 1.1621, with the possibility of a run to the 2018 yearly opening value at 1.2004. Also important, we recently unseated trend line resistance (mid-July), taken from the high 1.2555.
The technical position on the daily timeframe also exhibits scope to explore higher terrain, with little seen preventing bulls from taking a run at resistance coming in from 1.1940. It is also worth acknowledging this base is sited just under weekly resistance mentioned above at 1.2004.
Areas of consideration:
- August’s opening value at 1.1771 on the H4 combines with a possible H4 AB=CD support. This, alongside nearby support at 1.1753, could welcome buying.
- The H4 zone marked red between 1.1919/1.1888 is made up of a number of technical elements, highlighting strong resistance to be aware of.
- While the H4 area underlined above offers appeal, September’s opening value also on the H4 timeframe at 1.1937, given its connection with daily resistance at 1.1940, opens up the possibility of a fakeout forming through 1.1919 before sellers make an appearance.
GBP/USD:
For those who read Monday’s technical briefing you may recall the following (italics):
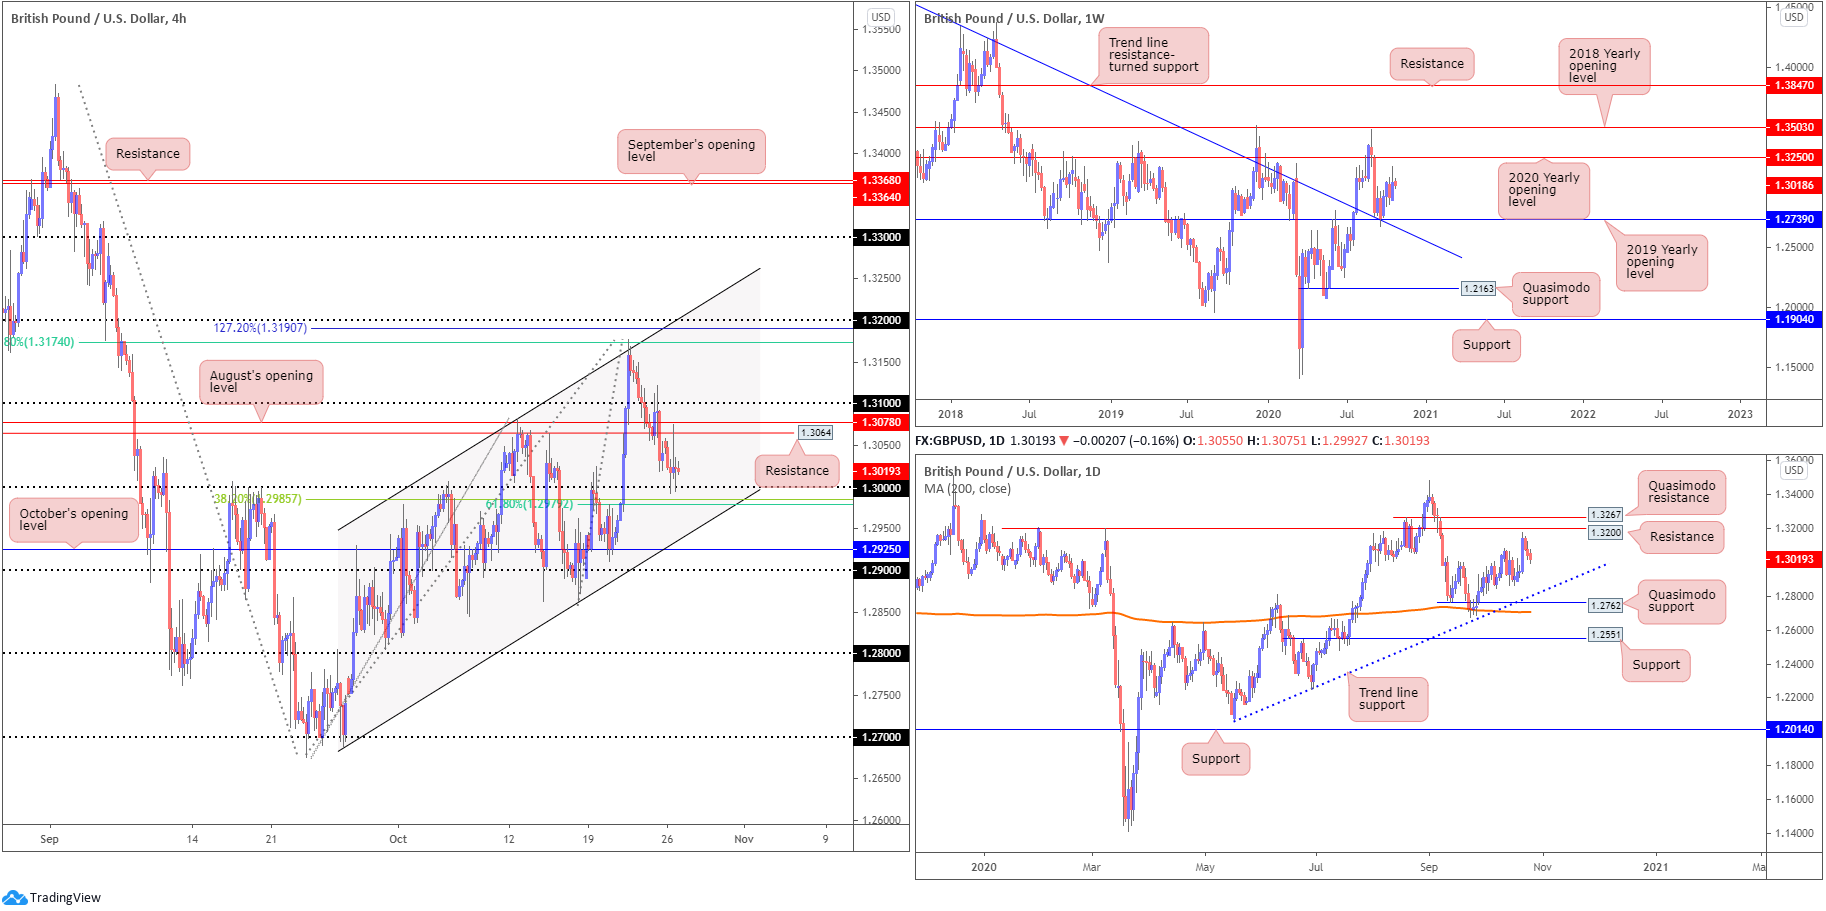
The 1.30 handle has ‘fakeout’ written all over it. The 38.2% and 61.8% Fibonacci retracements plotted beneath 1.30 around 1.2980ish offer a support to consider. A bounce from the latter this week, followed up with a H4 close back above 1.30 is likely to be interpreted as a bullish signal, targeting at least 1.3064.
While the aforementioned Fibonacci levels were left unchallenged, 1.30 entered the fight Monday and held off 1.2992 with enough energy to retest H4 resistance at 1.3064 (and come within striking distance of August’s opening value at 1.3078).
Beyond the aforementioned H4 supports, channel support, etched from the low 1.2687, is also seen as a reasonable base, together with October’s opening value placed at 1.2925 and the 1.29 handle.
Further out on the weekly timeframe, although concluding off session highs last week, GBP/USD still finished the week on a relatively solid footing. Following a bout of dip-buying off support at 1.2739 (a 2019 yearly opening value blending with trend line resistance-turned support, extended from the high 1.5930), weekly candles now target the 2020 yearly opening value at 1.3250. Should 1.2739 fail, nonetheless, the 1.2251 low (June 29) is in sight, shadowed by Quasimodo support from 1.2163. It is also worth pointing out the aforementioned trend line was engulfed in late July this year, announcing an uptrend could be on the cards.
Price action on the daily timeframe hit the brakes a touch ahead of resistance from 1.3200 last week, a level pinned just south of Quasimodo resistance at 1.3267. Diving to deeper waters shines the spotlight on trend line support, extended from the low 1.2075, with a break exposing Quasimodo support located at 1.2762 and a 200-day SMA (orange – 1.2707).
Areas of consideration:
- The 1.30 handle and nearby Fibonacci levels (38.2% and 61.8% plotted beneath 1.30 around 1.2980ish) remain support to be aware of.
- Between 1.31/1.3064 also represents potential intraday resistance today.
- H4 channel support is also likely to garner interest should we reach this far south, though whether the ascending level will be enough to stop price from reaching for October’s opening value at 1.2925 (or the 1.29 handle) is difficult to judge.
AUD/USD:
Monday exhibited limited movement, ranging between 0.7146/0.7102. Given the lacklustre performance, much of the following will echo thoughts put forward in recent analysis.
From the weekly timeframe:
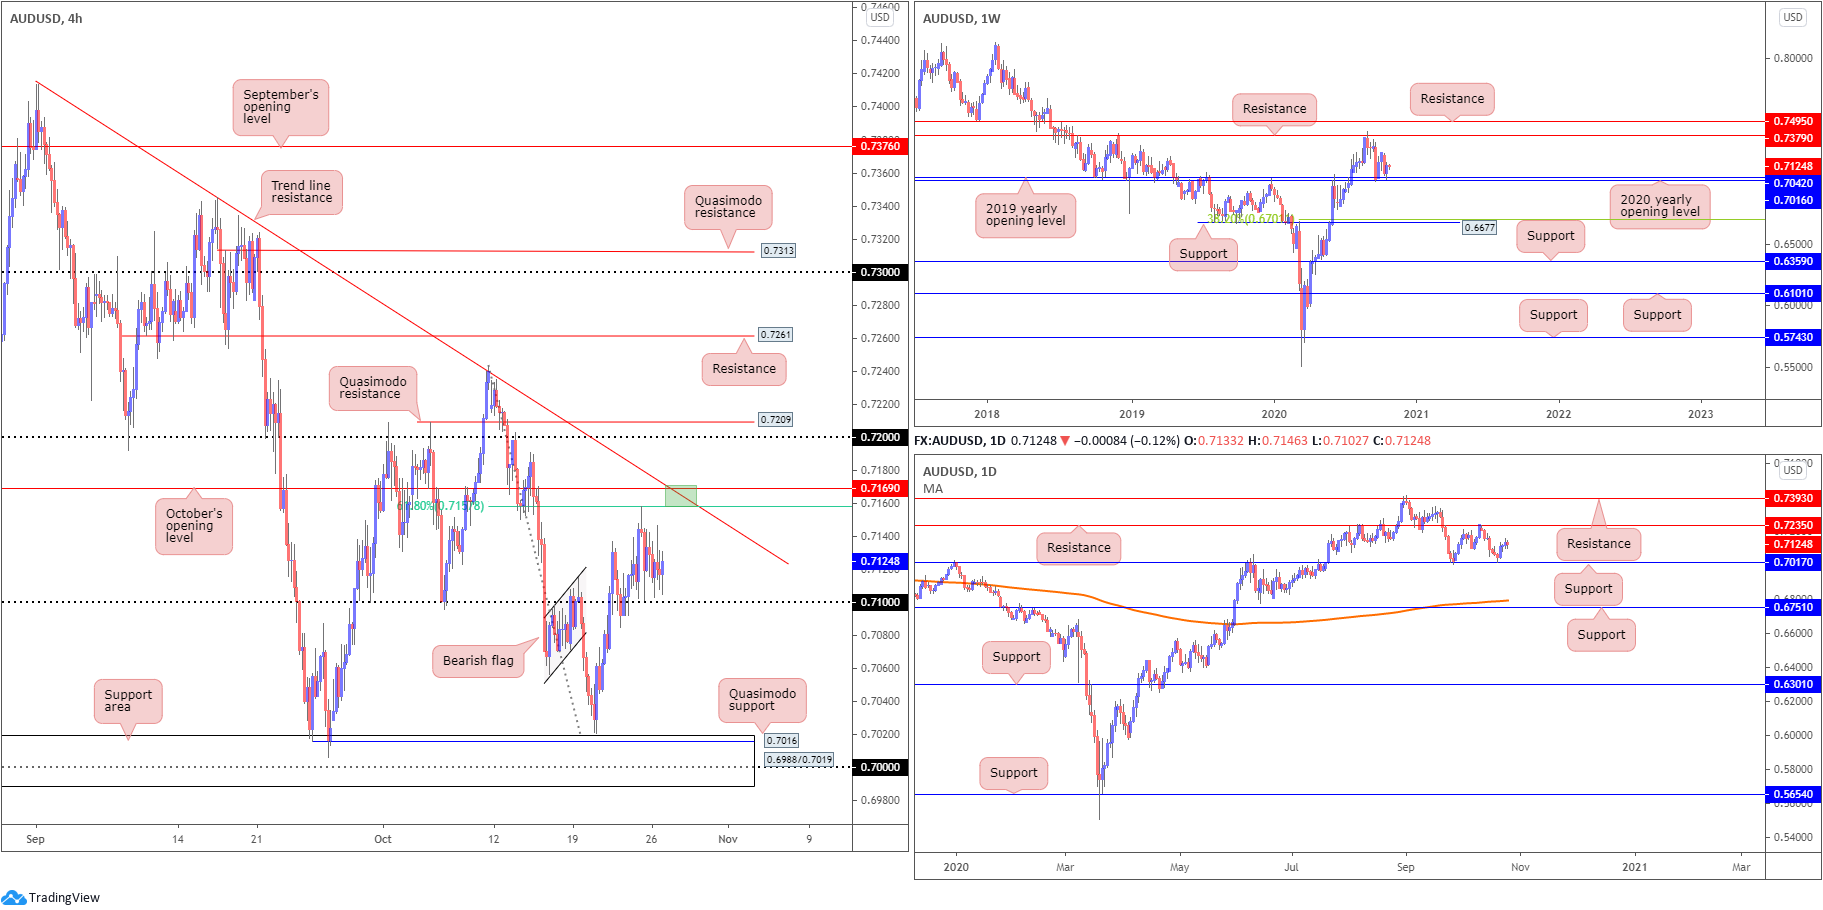
The 2020 (0.7016) and 2019 (0.7042) yearly opening values continue to be recognised as support on the weekly timeframe. Resistance at 0.7379 lines up as the next upside hurdle should an advance materialise. It should also be pointed out that the trend in this market remains to the upside.
Failure to maintain position off 0.7016/0.7042 shifts motivation towards support plotted at 0.6677, and a corresponding 38.2% Fibonacci retracement ratio at 0.6701.
Daily timeframe:
Following last Tuesday’s hammer candle forming ahead of support priced in at 0.7017, AUD/USD rallied strongly Wednesday with Friday embracing peaks at 0.7158. This potentially sets the technical stage for another bout of buying, eyeing resistance plotted at 0.7235.
H4 timeframe:
H4 is seen hovering north of the 0.71 handle. To the upside, a 61.8% Fibonacci retracement resistance is seen at 0.7157, plotted just south of October’s opening value at 0.7169 and a trend line resistance, formed from the high 0.7413.
Clearance of 0.7169 throws the 0.72 handle into the mix as possible resistance, closely shadowed by a Quasimodo resistance level at 0.7209.
Areas of consideration:
- Owing to the overall trend in this market, producing sizeable gains since early 2020, and the weekly and daily timeframes revealing thin resistance until reaching 0.7235 (daily), 0.71 on the H4 remains a support to watch, in addition to a possible breakout scenario above October’s opening value at 0.7169.
- While north is likely to be the favoured direction, traders could still witness an intraday response from H4 trend line resistance (0.7413), due to 61.8% Fibonacci convergence and 0.7169 (green).
USD/JPY:
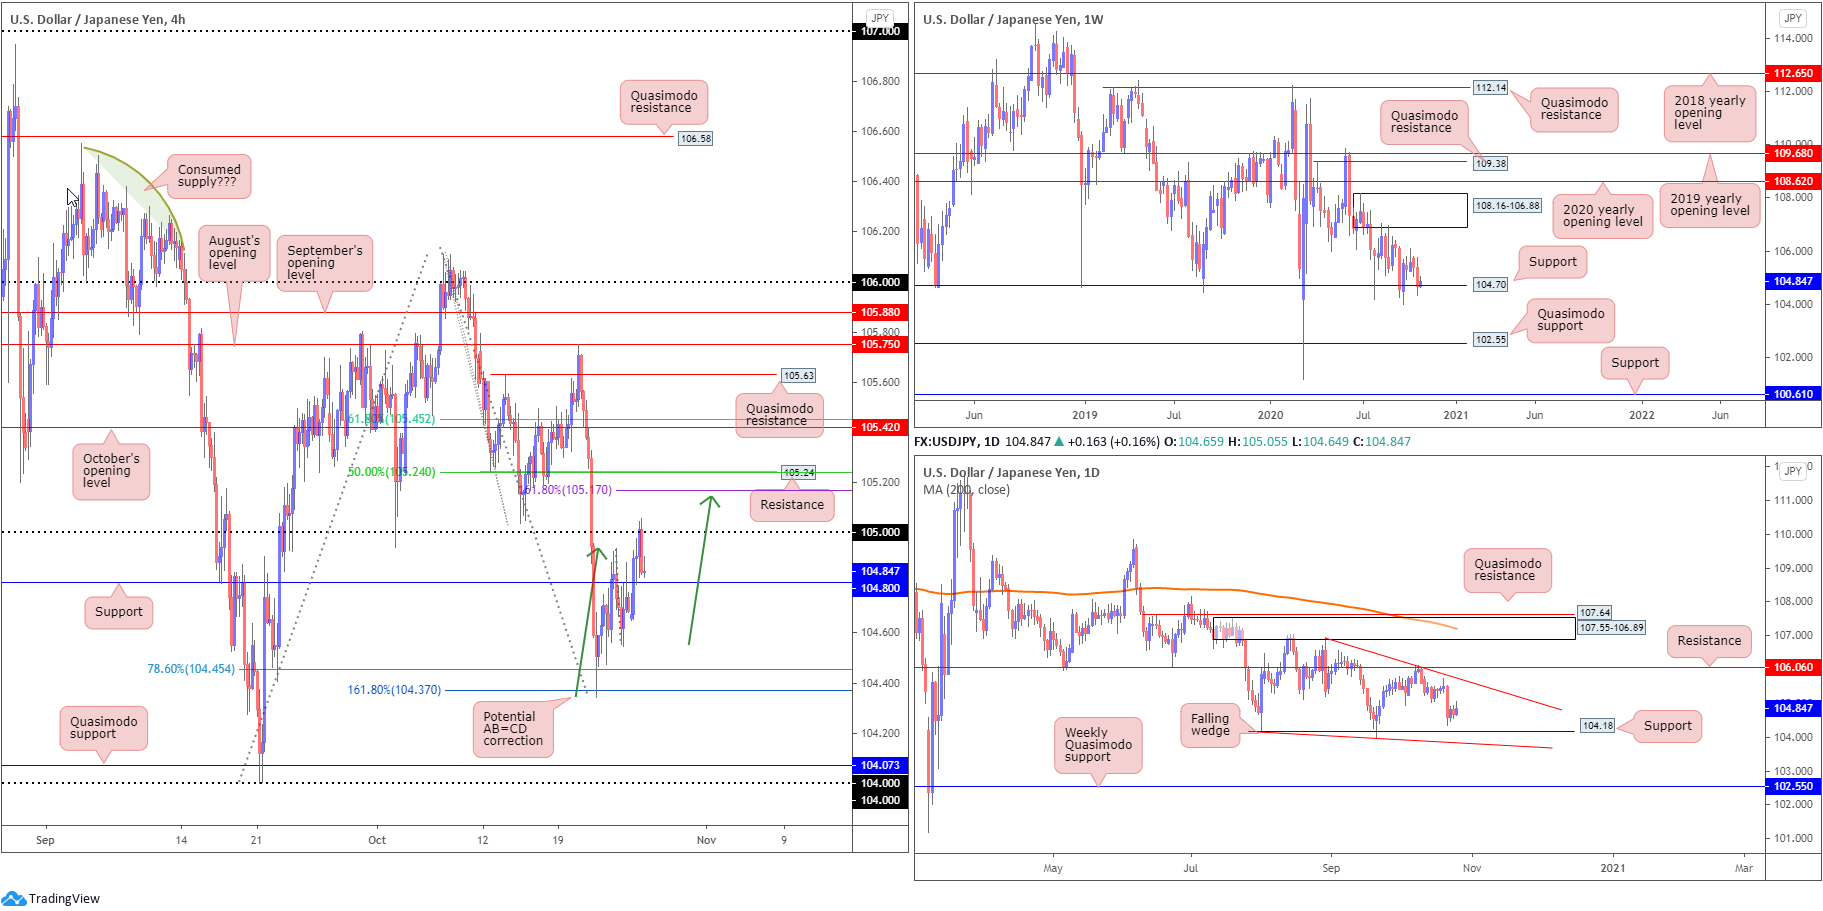
Higher timeframe flow appears to be attempting to find a floor off support at 104.70 on the weekly timeframe, follow two consecutive weeks of losses. Supply at 108.16-106.88 remains a base to watch to the upside, followed by the 2020 yearly opening value at 108.62. Quasimodo support at 102.55, on the other hand, offers a feasible target beyond current support in the event we turn south this week.
From the daily timeframe, however, price is visibly compressing between two converging descending lines taken from 104.18/106.94, establishing a falling wedge pattern. Due to the series of lower lows and lower highs since March, the current falling wedge is likely to be interpreted as a reversal signal should a breakout higher take shape. In addition to the wedge construction, support stands at 104.18 and resistance falls in around 106.06.
Following last Wednesday’s recovery from the 161.8% H4 Fibonacci projection point at 104.37 (and 78.6% Fibonacci retracement ratio at 104.45), price movement extended gains Monday and took over resistance at 104.80 to shake hands with 105. As you can see, recent flow rejected the round number, threatening to retest 104.80 as support. Above 105, traders are urged to pencil in resistances at 105.24 (connecting with a possible AB=CD bearish formation [green arrows] at 105.15 and 1.618 BC projection at 105.17) and October’s opening value at 105.42 (together with a 61.8% Fibonacci retracement ratio at 105.45).
Areas of consideration:
- The break of H4 resistance at 104.80, and H4 now holding just north of 104.80 as a support, could encourage an intraday bullish theme today, targeting H4 resistances 105, 105.24, 105.42.
- H4 resistance at 105.24 and 105.42 are also interesting levels with respect to confluence; the former joins with a 50.0% retracement and nearby AB=CD resistance, while the latter boasts a connection with a 61.8% Fibonacci retracement at 105.45.
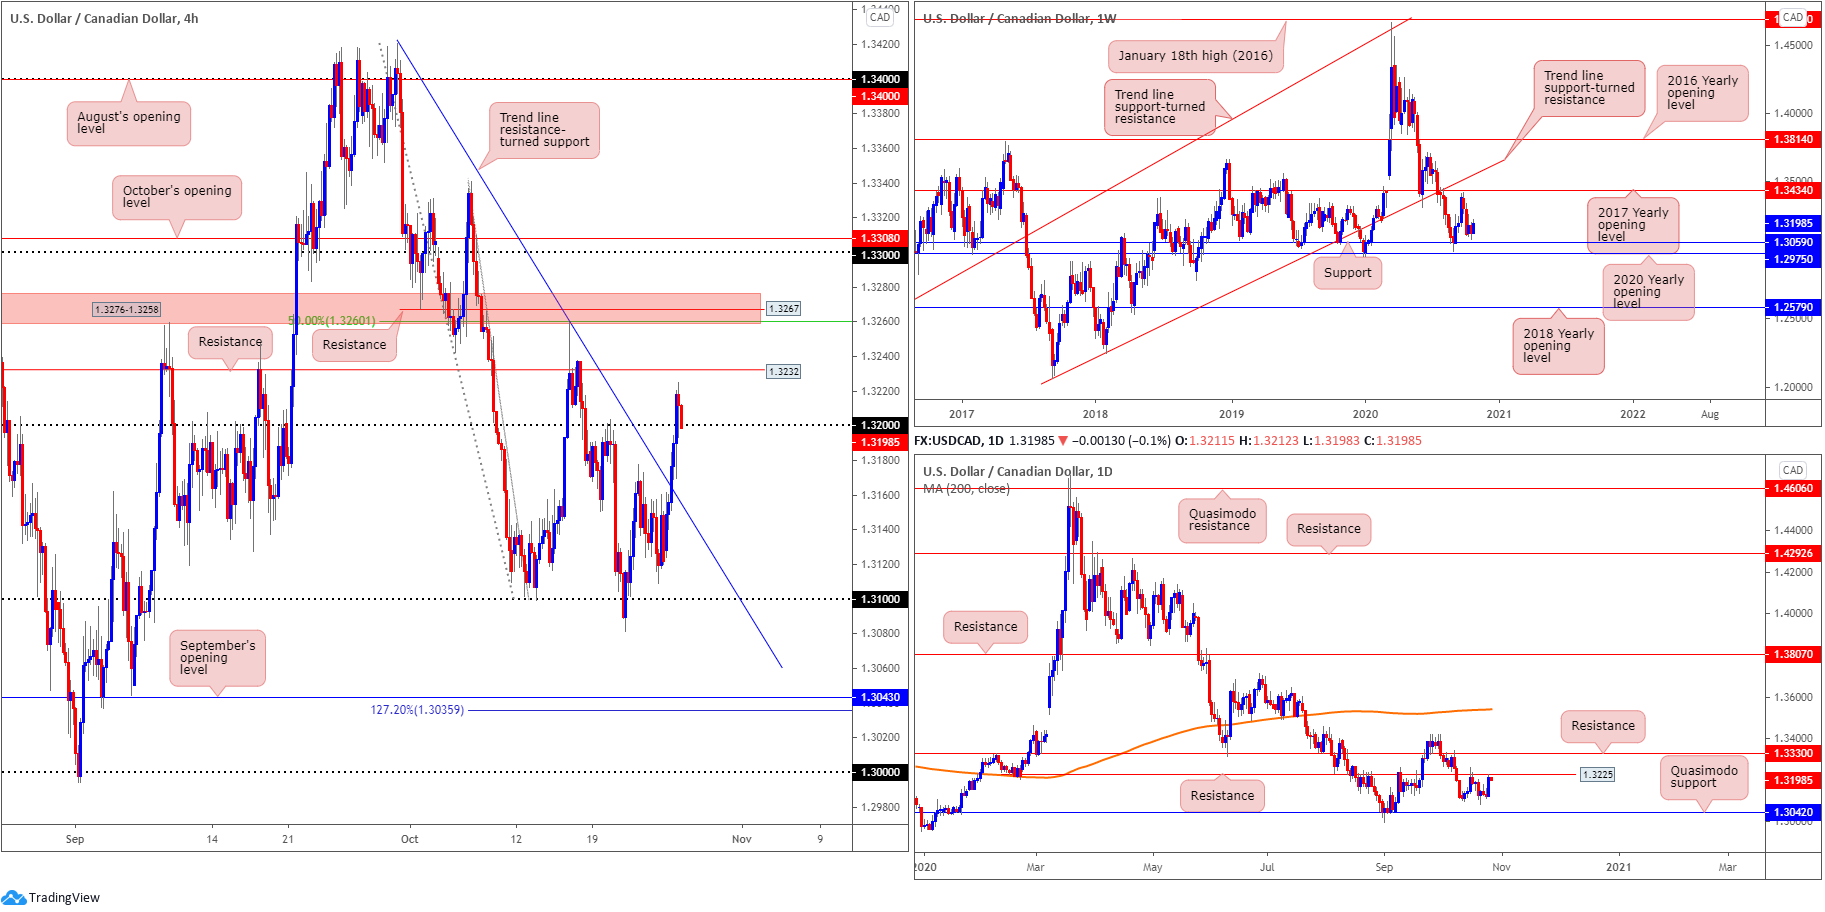
USD/CAD:
Crude oil fell sharply on Monday, losing nearly 3% and weighing on the Canadian dollar. This – coupled with the US dollar index chalking up a reasonably comfortable gain – manoeuvred USD/CAD nearly 0.7% higher.
H4 candles mustered enough strength to overthrow trend line resistance, extended from the high 1.3420, as well as the 1.32 level, which, as you can see, is currently being retested as support. Resistance is seen close by at 1.3232, yet overlooking this barrier potentially throws resistance into the mix at 1.3267 (encased within a resistance zone between 1.3276-1.3258 and merges with a 50.0% retracement ratio at 1.3260).
Despite shedding more than 2% south of the 2017 yearly opening value at 1.3434, longer-term activity on the weekly timeframe recently established a floor ahead of support at 1.3059 (arranged above the 2020 yearly opening value at 1.2975).
After failing to cross swords with Quasimodo support at 1.3042 on the daily timeframe, resistance at 1.3225 pushed its way back into the spotlight yesterday, a base that converges closely with H4 resistance at 1.3232. Moves above 1.3225 could lead candle action to resistance at 1.3330.
Areas of consideration:
- With the higher timeframes showing daily price testing resistance at 1.3225, set just south of H4 resistance at 1.3232, a break under 1.32 could play out and activate a bearish scenario. Should bulls maintain some grip, however, a push higher to engage sellers around the H4 resistance area at 1.3276-1.3258 may be seen.
The accuracy, completeness and timeliness of the information contained on this site cannot be guaranteed. IC Markets does not warranty, guarantee or make any representations, or assume any liability regarding financial results based on the use of the information in the site.
News, views, opinions, recommendations and other information obtained from sources outside of www.icmarkets.com.au, used in this site are believed to be reliable, but we cannot guarantee their accuracy or completeness. All such information is subject to change at any time without notice. IC Markets assumes no responsibility for the content of any linked site.
The fact that such links may exist does not indicate approval or endorsement of any material contained on any linked site. IC Markets is not liable for any harm caused by the transmission, through accessing the services or information on this site, of a computer virus, or other computer code or programming device that might be used to access, delete, damage, disable, disrupt or otherwise impede in any manner, the operation of the site or of any user’s software, hardware, data or property


