DXY:
The DXY (US Dollar Index) chart indicates a bearish momentum, suggesting the potential for further downward movement. There is a possibility of a bearish continuation towards the 1st support level at 102.27, which is supported by the presence of pullback support, as well as the 61.80% Fibonacci Retracement and 100% Fibonacci Projection, indicating Fibonacci confluence. Additionally, the 2nd support level at 101.69 acts as an overlap support, further reinforcing its significance.
On the upside, the 1st resistance level at 102.70 represents an overlap resistance, potentially impeding upward price advancement. Similarly, the 2nd resistance level at 103.03 serves as another overlap resistance, further emphasising its importance.

EUR/USD:
The EUR/USD chart indicates a bullish momentum, suggesting the potential for further upward movement. There is a possibility of a bullish continuation towards the 1st resistance level at 1.1000, which is characterized as a swing high resistance. Additionally, the 2nd resistance level at 1.1079 acts as a multi-swing high resistance, further reinforcing its significance.
On the downside, the 1st support level at 1.0910 provides potential support as a pullback support, while the 2nd support level at 1.0844 acts as an overlap support, adding to its importance.
Furthermore, there is an intermediate resistance level at 1.0950, serving as a pullback resistance and coinciding with the 61.80% Fibonacci Retracement.

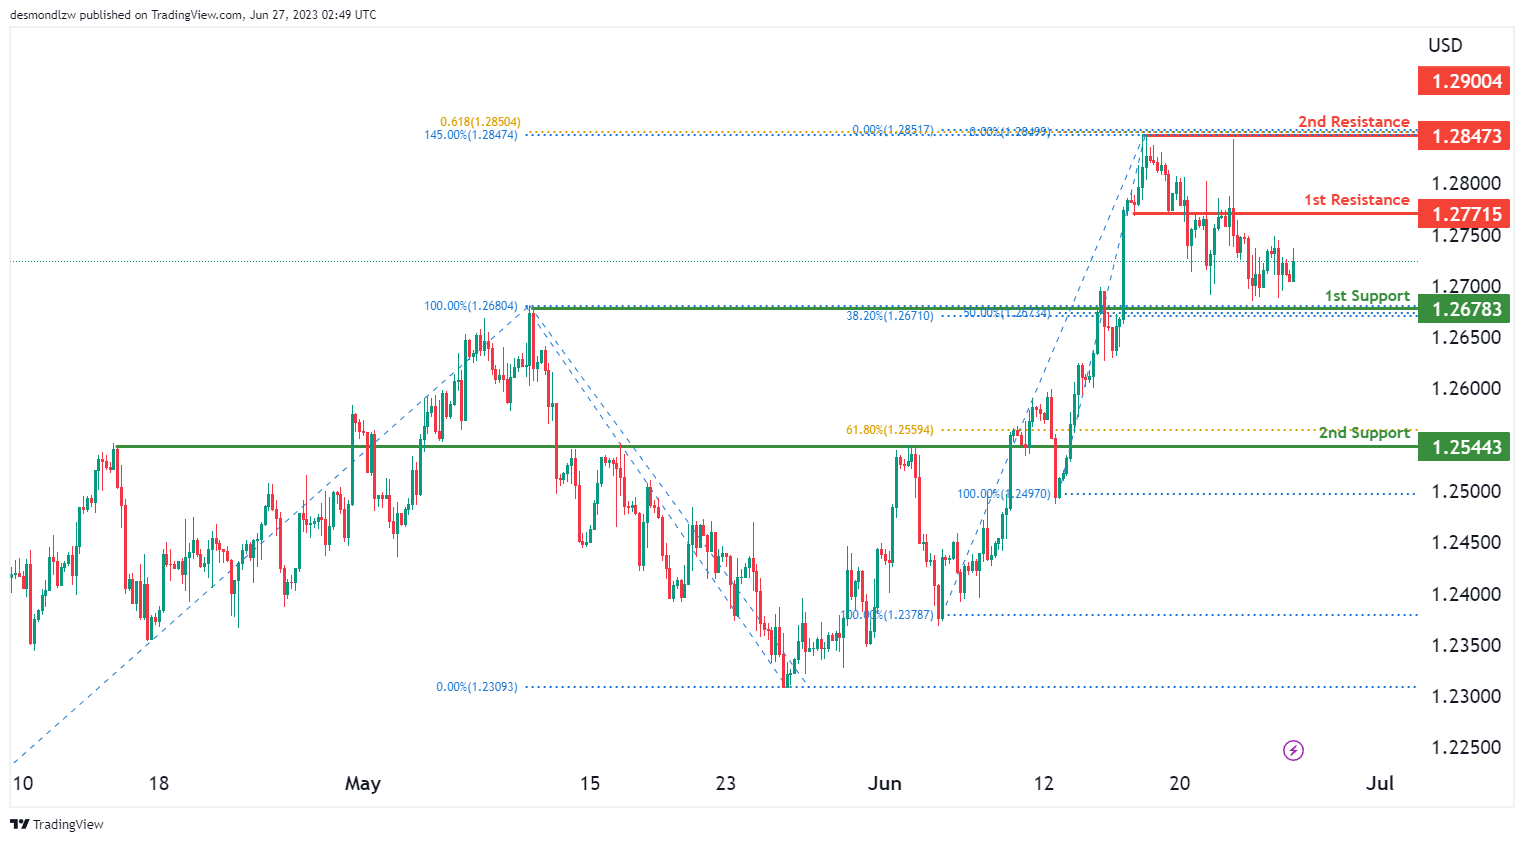
GBP/USD:
The GBP/USD chart currently exhibits a neutral momentum, indicating a lack of clear direction in the market. As a result, there is a possibility for price to fluctuate between the 1st resistance level at 1.2771 and the 1st support level at 1.2678.
The 1st support level at 1.2678 is considered significant as it represents an overlap support, further reinforced by the presence of the 38.20% and 50% Fibonacci Retracement, suggesting a Fibonacci confluence. Additionally, the 2nd support level at 1.2544 acts as a pullback support, adding to the potential strength of the support zone.
On the upside, the 1st resistance level at 1.2771 serves as a pullback resistance, potentially impeding further upward price movement. Furthermore, the 2nd resistance level at 1.2847 acts as a swing high resistance, supported by the presence of the 145.00% Fibonacci Extension and 61.80% Fibonacci Projection.
USD/CHF:
The USD/CHF chart currently exhibits a neutral momentum, indicating a lack of clear direction in the market. As a result, there is a possibility for price to fluctuate between the 1st resistance level at 0.8986 and the 1st support level at 0.8907.
The 1st support level at 0.8907 is considered a multi-swing low support, suggesting potential strength in the support zone. Additionally, the 2nd support level at 0.8861 acts as a pullback support, providing further support to the price.
On the upside, the 1st resistance level at 0.8986 represents an overlap resistance, potentially impeding further upward price movement. Furthermore, the 2nd resistance level at 0.9038 also acts as an overlap resistance, reinforcing its significance.

USD/JPY:
The USD/JPY chart currently exhibits a bullish momentum, characterised by the price movement within a bullish ascending channel, suggesting a potential for further upward movement.
There is a possibility for a bullish continuation towards the 1st resistance level at 145.01, which acts as a pullback resistance. Additionally, the 2nd support level at 143.85 serves as a swing high resistance, further reinforcing its significance in potentially impeding upward price advancement.
On the downside, the 1st support level at 142.27 represents a pullback support, providing potential strength to the support zone. Another support level, the 2nd support at 141.28, acts as an overlap support, further confirming its importance.

USD/CAD:
The USD/CAD chart currently demonstrates a bearish momentum, characterized by the price movement within a bearish descending channel, suggesting a potential for further downward movement.
There is a possibility of a short-term rise towards the 1st resistance level at 1.3177, which acts as an overlap resistance. However, it is anticipated that the price may reverse off this resistance level and subsequently drop towards the 1st support level at 1.3107. The confluence of the 127.20% Fibonacci Extension and the 78.60% Fibonacci Projection reinforces the significance of this support level.
Additionally, the 2nd support level at 1.3058 serves as a pullback support, further contributing to its importance in potentially providing a supportive zone. On the upside, the 2nd resistance level at 1.3239 acts as another overlap resistance, emphasizing its significance in hindering further upward price advancement.

AUD/USD:
The AUD/USD chart currently shows a bearish momentum, indicating a potential for continued downward movement in the market.
There is a possibility of a bearish continuation towards the 1st support level at 0.6635. This support level is significant as it represents a pullback support and is further reinforced by the presence of the 61.80% Fibonacci Retracement and the 78.60% Fibonacci Projection, indicating Fibonacci confluence. Additionally, the 2nd support level at 0.6579 acts as an overlap support, further emphasizing its importance in potentially providing a supportive zone.
On the upside, the 1st resistance level at 0.6795 represents an overlap resistance, potentially impeding upward price advancement. Furthermore, the 2nd resistance level at 0.6884 serves as a multi-swing high resistance, further reinforcing its significance in hindering further upward movement.

NZD/USD
The NZD/USD chart currently shows a neutral momentum, suggesting a lack of clear direction in the market. The price could potentially fluctuate between the 1st resistance level at 0.6206 and the 1st support level at 0.6114.
The 1st support level at 0.6114 is identified as an overlap support, providing potential strength to the support zone. Additionally, there is an intermediate support level at 0.6159, acting as another overlap support.
On the upside, the 1st resistance level at 0.6206 represents a multi-swing high resistance, potentially impeding upward price advancement. Furthermore, the 2nd resistance level at 0.6237 acts as an overlap resistance, further confirming its significance.
It is worth noting that a symmetrical triangle chart pattern is also present, indicating a period of consolidation. Breakouts above the upper trendline of the pattern could signal a bullish breakout, while breakouts below the lower trendline may indicate a bearish breakdown.

DJ30:
The DJ30 (Dow Jones 30) chart currently shows a neutral momentum, indicating a lack of clear direction in the market. The price could potentially fluctuate between the 1st resistance level at 33870.35 and the 1st support level at 33659.35.
The 1st support level at 33659.35 is identified as an overlap support and is reinforced by the presence of the 50% Fibonacci Retracement and the 78.60% Fibonacci Retracement. Additionally, the 2nd support level at 33464.05 acts as another overlap support and coincides with the 61.80% Fibonacci Retracement and the 145.00% Fibonacci Extension.
On the upside, the 1st resistance level at 33870.35 represents an overlap resistance and is further supported by the presence of the 23.60% Fibonacci Retracement. Furthermore, the 2nd resistance level at 34283.31 acts as an overlap resistance and coincides with the 61.80% Fibonacci Retracement.

GER30:
The GER30 (Germany 30) chart is currently showing a neutral momentum, suggesting a lack of clear direction in the market. The price could potentially fluctuate between the 1st resistance level at 15902.63 and the 1st support level at 15691.74.
The 1st support level at 15691.74 is identified as a multi-swing low support and is further reinforced by the presence of the 100% Fibonacci Projection. Additionally, the 2nd support level at 15496.90 acts as an overlap support, providing additional strength to the support zone.
On the upside, the 1st resistance level at 15902.63 represents an overlap resistance and is further supported by the presence of the 23.60% Fibonacci Retracement. Furthermore, the 2nd resistance level at 16072.72 acts as a pullback resistance and coincides with the 50% Fibonacci Retracement.

US500
The US500 (S&P 500) chart currently exhibits a weak bullish momentum with low confidence, suggesting a cautious market sentiment.
There is a possibility of a bullish bounce off the 1st support level at 4327.10, which is identified as an overlap support and is further reinforced by the presence of the 61.80% Fibonacci Retracement. Additionally, the 2nd support level at 4294.70 acts as another overlap support, providing further strength to the support zone.
On the upside, the 1st resistance level at 4386.20 represents an overlap resistance and may impede upward price movement. Furthermore, the 2nd resistance level at 4432.10 serves as a swing high resistance, reinforcing its significance in hindering further upward advancement.

BTC/USD:
The BTC/USD (Bitcoin) chart currently exhibits a neutral momentum, indicating a lack of clear direction in the market.
There is a possibility of price fluctuating between the 1st resistance level at 30996.00, which acts as a pullback resistance, and the 1st support level at 29826.00. The 1st support level is considered an overlap support and is further supported by the presence of the 23.60% Fibonacci Retracement. Additionally, the 2nd support level at 28441.00 acts as another overlap support and coincides with the 50% Fibonacci Retracement.
On the upside, the 2nd resistance level at 32080.00 represents a swing high resistance and is identified as the potential barrier for further upward movement.

ETH/USD:
The ETH/USD (Ethereum) chart currently shows a weak bullish momentum with low confidence, suggesting a tentative upward movement in the market.
There is a potential for a bullish continuation towards the 1st resistance level at 1933.86. This resistance level is characterized as a multi-swing high resistance, indicating its significance in potentially impeding further upward price advancement. Additionally, the 2nd resistance level at 2019.53 acts as a swing high resistance, reinforcing its role as a potential barrier for the price.
On the downside, the 1st support level at 1820.25 is identified as a pullback support, potentially providing a level of price support. Further analysis may be required to determine additional support levels.

WTI/USD:
The WTI (West Texas Intermediate) chart currently exhibits a neutral momentum, indicating a lack of clear direction in the market.
There is a potential for price to fluctuate between the 1st resistance level at 70.20 and the 1st support level at 67.24. The 1st support level is identified as a multi-swing low support, further reinforced by the presence of the 50% Fibonacci Retracement. Additionally, the 2nd support level at 65.01 acts as another multi-swing low support, indicating potential strength in the support zone. This level is further supported by the 100% Fibonacci Projection and 127.20% Fibonacci Extension.
On the upside, the 1st resistance level at 70.20 represents an overlap resistance, potentially impeding further upward price movement. Furthermore, the 2nd resistance level at 72.83 is identified as a multi-swing high resistance, reinforcing its significance in potentially hindering upward advancement.

XAU/USD (GOLD):
The XAU/USD (Gold/US Dollar) chart currently demonstrates a bearish momentum, as indicated by the price being within a bearish descending channel.
There is a potential for price to fluctuate between the 1st resistance level at 1938.90 and the 1st support level at 1913.47. The 1st support level is considered an overlap support, suggesting its significance in providing potential price stability. Additionally, the 2nd support level at 1888.61 acts as another overlap support, reinforcing its importance.
On the upside, the 1st resistance level at 1938.90 is identified as an overlap resistance, potentially impeding upward price movement. Furthermore, the 2nd resistance level at 1953.71 is also categorized as an overlap resistance, adding to its potential role in hindering price advancement.

The accuracy, completeness and timeliness of the information contained on this site cannot be guaranteed. IC Markets does not warranty, guarantee or make any representations, or assume any liability regarding financial results based on the use of the information in the site.
News, views, opinions, recommendations and other information obtained from sources outside of www.icmarkets.com, used in this site are believed to be reliable, but we cannot guarantee their accuracy or completeness. All such information is subject to change at any time without notice. IC Markets assumes no responsibility for the content of any linked site.
The fact that such links may exist does not indicate approval or endorsement of any material contained on any linked site. IC Markets is not liable for any harm caused by the transmission, through accessing the services or information on this site, of a computer virus, or other computer code or programming device that might be used to access, delete, damage, disable, disrupt or otherwise impede in any manner, the operation of the site or of any user’s software, hardware, data or property.