
Key risk events today:
RBA Deputy Gov Debelle Speaks; MPC Member Tenreyro Speaks; US CB Consumer Confidence; US Richmond Manufacturing Index.
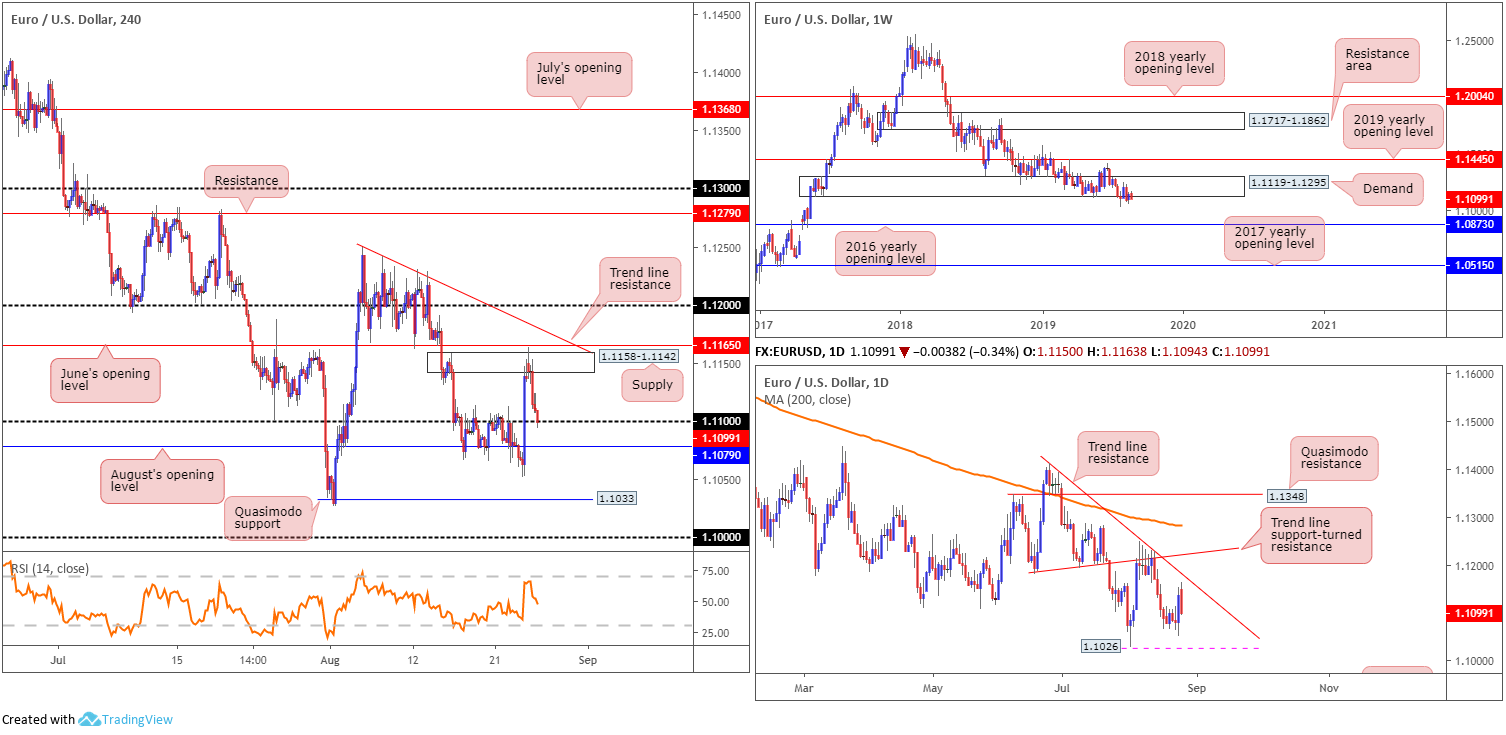
EUR/USD:
Europe’s single currency swung into negative terrain versus the US dollar Monday, wiping out a large portion of Friday’s gains. Macroeconomic data out of the US revealed new orders for manufactured goods in July increased by 2.1%, shattering market consensus at 1.4% and providing additional legs to dollar buyers.
Down more than 0.35%. the EUR/USD pair came under pressure following a whipsaw through H4 supply at 1.1158-1.1142 that came within striking distance of June’s opening level at 1.1165. Follow-through selling materialised amidst London hours yesterday, subsequently drawing the H4 candles towards the 1.11 neighbourhood, which also happens to be closely shadowed by August’s opening level at 1.1079.
For traders who read Monday’s weekly briefing you may recall the piece highlighted the following in regard to H4 structure:
A selloff from the current H4 supply on the back of Friday’s shooting star pattern is a possibility, targeting 1.11 as the initial port of call. Entry at current price is an option, with a protective stop-loss order plotted above either the H4 supply edge (1.1158), or, more conservatively, above the H4 trend line resistance (extended from the high 1.1249).
The weekly briefing also touched on higher-timeframe structure:
From the weekly timeframe:
Long-standing demand at 1.1119-1.1295 remains delicate, as sell stops continue to fill beneath its boundary. Although concluding the week in mildly firmer territory, additional downside is the favoured route on this timeframe. Continued selling could eventually see the unit knock on the 2016 yearly opening level’s door at 1.0873, which houses strong historical significance.
In addition to the above, since topping in early 2018, the long-term trend remains pointing in a southerly bearing.
The daily timeframe:
Aside from Friday’s ascent, closing in the shape of an engulfing candlestick formation (considered a bullish signal), the week entered a consolidative phase ranging no more than 45 points.
Neighbouring resistance on tap this week is visible by way of a trend line resistance (etched from the high 1.1412), shadowed closely by another layer of trend line resistance (prior support) extended from the low 1.1181 and then the 200-day SMA (orange – currently circulating around 1.1283). To the downside, support resides at 1.1026, the 2019 low, followed by demand (not visible on the screen) at 1.0851-1.0950.
Areas of consideration:
Well done to any of our readers who managed to jump aboard the sell from H4 supply at 1.1158-1.1142. The option of reducing risk to breakeven and liquidating a portion of the position at current price is certainly there now. Ultimately, further downside could still be upon us, having seen the lack of buyer intent around the underside of weekly demand and daily price displaying room to press as far north as 1.1026.
For those who want to press this bearish theme, a pullback/retest at 1.1079 on the H4 scale following a break lower could re-open bearish scenarios to at least H4 Quasimodo support at 1.1033. This may also be an opportunity for current sellers to pyramid their positions.
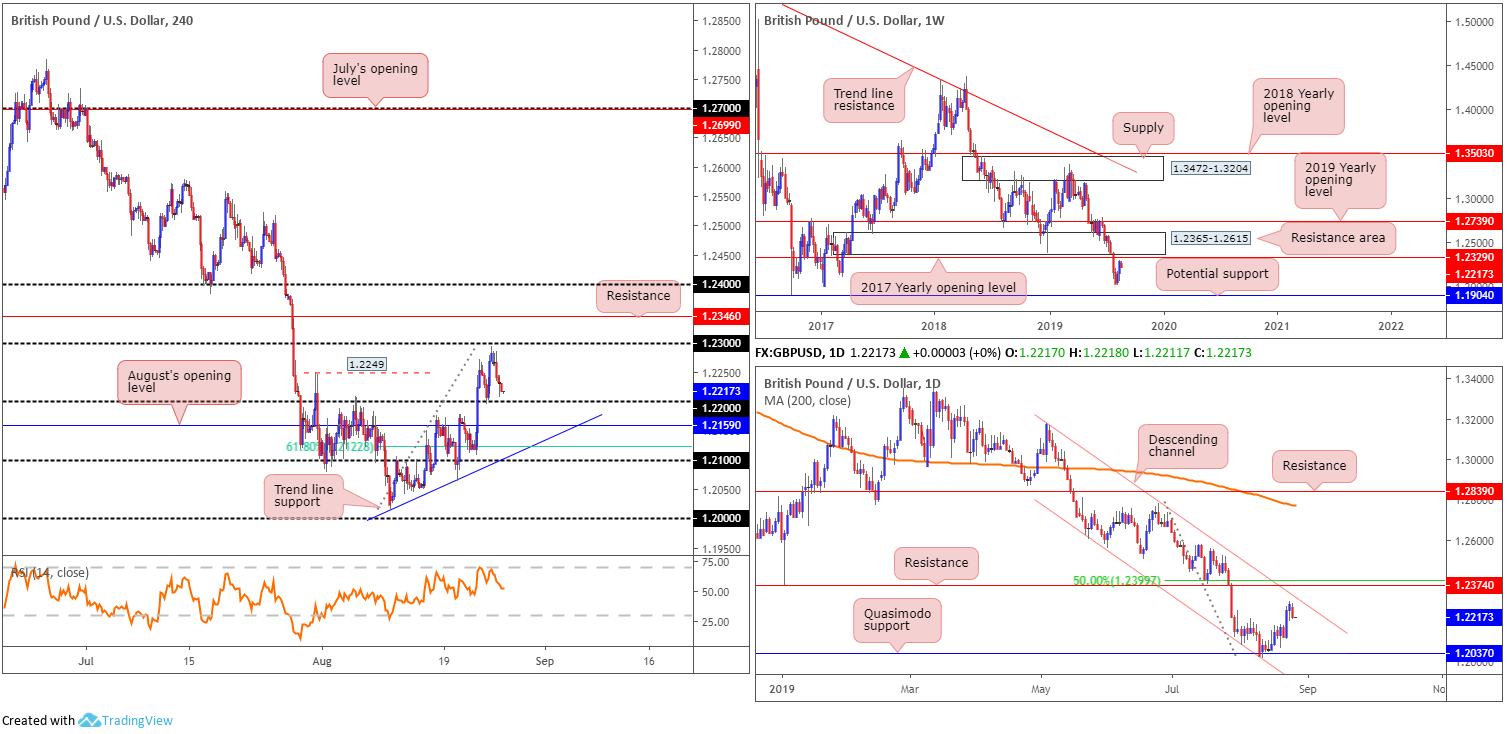
GBP/USD:
Leaving the 1.23 handle unchallenged Monday, the British pound eased against the buck and chalked up an intraday bottom just north of 1.22 into the close. Beyond 1.22, August’s opening level at 1.2159 is visible on the H4 timeframe, with trend line support etched from the low 1.2014 next in the firing range, closely trailed by 1.21. Note the 61.8% Fibonacci retracement ratio is plotted at 1.2122, too. Another interesting point worth noting is H4 chartists may be seeking opportunities to buy this market following the break of 1.2249, a notable swing high.
Higher-timeframe analysis remains unchanged from Monday’s findings:
Weekly perspective:
UK’s pound wrapped up firmer against the US dollar for a second consecutive week, adding more than 140 points. Poised to approach the 2017 yearly opening level at 1.2329 (resistance), set a couple of points south of a major resistance area at 1.2365-1.2615, further upside could be in store this week, at least until the said resistances enter the fold, at which point sellers are expected to make an appearance.
Daily perspective:
Following a shaky start off Quasimodo support at 1.2037 and its merging channel formation taken from the low 1.2605, the pair changed gears last week and explored higher ground.
Scope for additional upside this week is certainly plausible, though do remain cognisant of resistance at 1.2374, closely intersecting with channel resistance (etched from the high 1.3176) and a 50.0% retracement ratio at 1.2399.
Areas of consideration:
With higher-timeframe flow pointing in a southerly direction, entering long based on H4 structure is considered chancy, though not impossible. This is due to weekly resistance not expected to emerge until reaching 1.2329 and the daily channel resistance until around the 1.23ish region. For that reason, buying dips are unlikely to be runners, but will potentially offer enough juice to profit from before reaching the said higher-timeframe structures.
H4 support to have eyes on today fall in around 1.22, August’s opening level at 1.2159, H4 trend line support and merging 61.8% Fibonacci support at 1.2122.
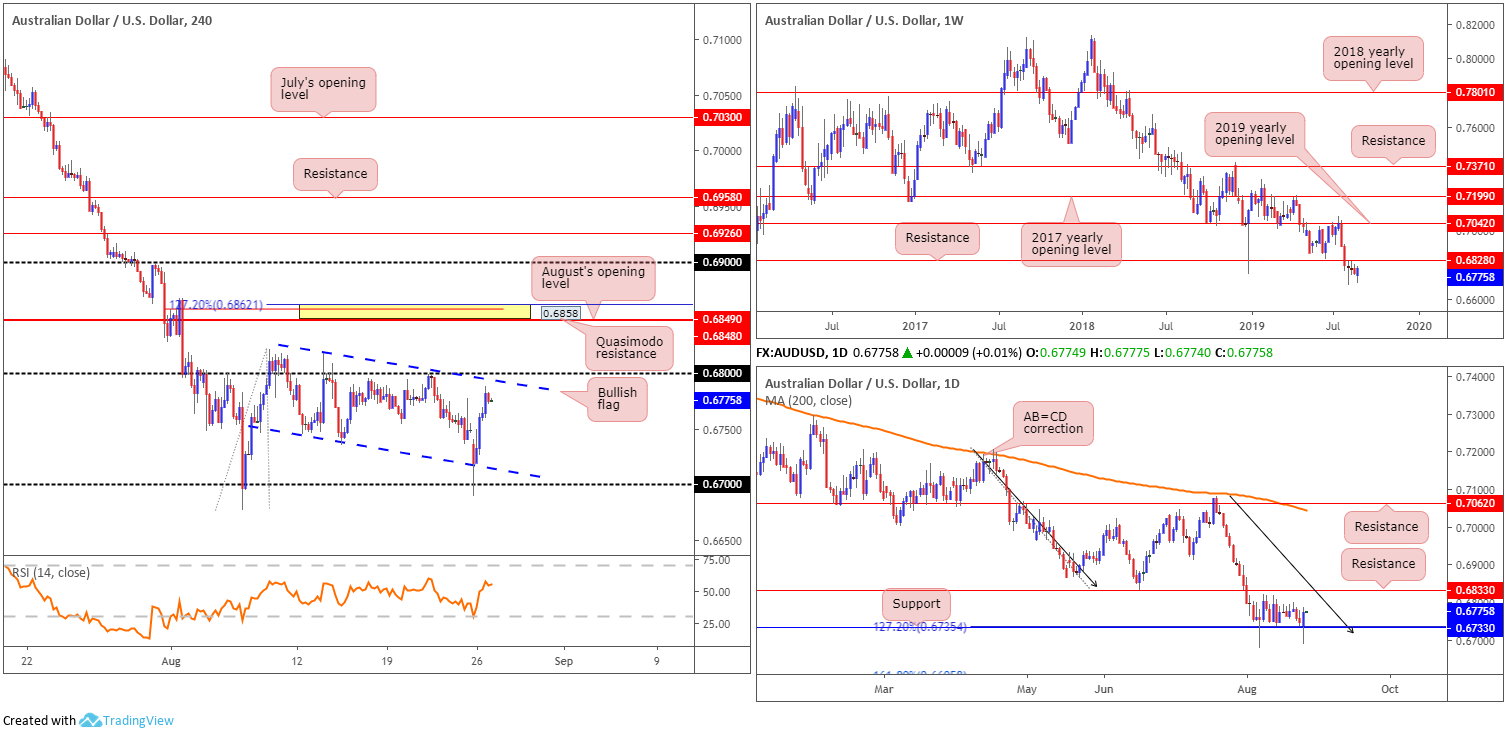
AUD/USD:
Early risk-off trade Monday was swiftly banished following US President Trump’s friendly remarks on China tariffs, consequently renewing risk appetite. The more constructive risk sentiment was built on after the G7 summit.
Early hours witnessed the H4 candles test waters sub 0.67, tripping sell stops and closing back within the bounds of a bullish flag scenario (0.6817/0.6745). Flags typically slope in the opposite direction to the underlying trend, which is clearly not the case here but may still form part of a correction move if we break higher, or even help signify early signs of a longer-term trend breakout.
Beyond the 0.68 handle, a close-fitting area of resistance (yellow) resides between a 127.2% Fibonacci ext. point at 0.6862, a Quasimodo resistance at 0.6858 and August’s opening level at 0.6848.
Higher-timeframe structure remains intact and unaltered – extracted from Monday’s weekly report:
The end of July witnessed the unit slip beneath notable weekly support at 0.6828, now a serving resistance. The following two weeks were colourless, organised as back-to-back indecision candles, with last week’s session also not really doing much to turn the dial.
The long-term downtrend, intact since the beginning of 2018, remains unbroken, with further selling likely on the cards as the next weekly support is not visible until 0.6395 on this timeframe (not seen on the screen).
Daily timeframe:
Since elbowing beneath weekly support mentioned above at 0.6828, support at 0.6733 on the daily timeframe, along with a 127.2% AB=CD (black arrows) formation at 0.6735, entered the fray and held things higher. Despite this, the pair remains deeply in bearish territory and does not appear to have the firepower to cross swords with resistance at 0.6833 (June 18 low), despite Monday’s bullish engulfing formation.
Areas of consideration:
Outlook unchanged.
Although the take-profit target for the H4 bullish flag configuration will come in higher (typically calculated based on the value of the preceding move and added to the breakout point), overlooking H4 resistance at 0.6862/0.6848 is chancy. Further to this, traders may also want to acknowledge that between 0.68 and the aforesaid H4 resistance zone, daily resistance at 0.6833 and weekly resistance at 0.6828 is in view. On account of the above, the research team feel longs above the current H4 flag formation/0.68 are challenging.
The yellow H4 area of resistance between 0.6862/0.6848 is an area worthy of consideration for shorts. Granted, while this zone is a touch above higher timeframe-resistance, a fakeout above these levels (likely flushing out greedy buy stops) to the said H4 zone is a strong possibility if we break 0.68. Entry at 0.6848 is valid, with a tight protective stop-loss order plotted above 0.6862, but if you prefer waiting for additional confirmation, a bearish candlestick pattern would suffice and help base entry and risk levels.
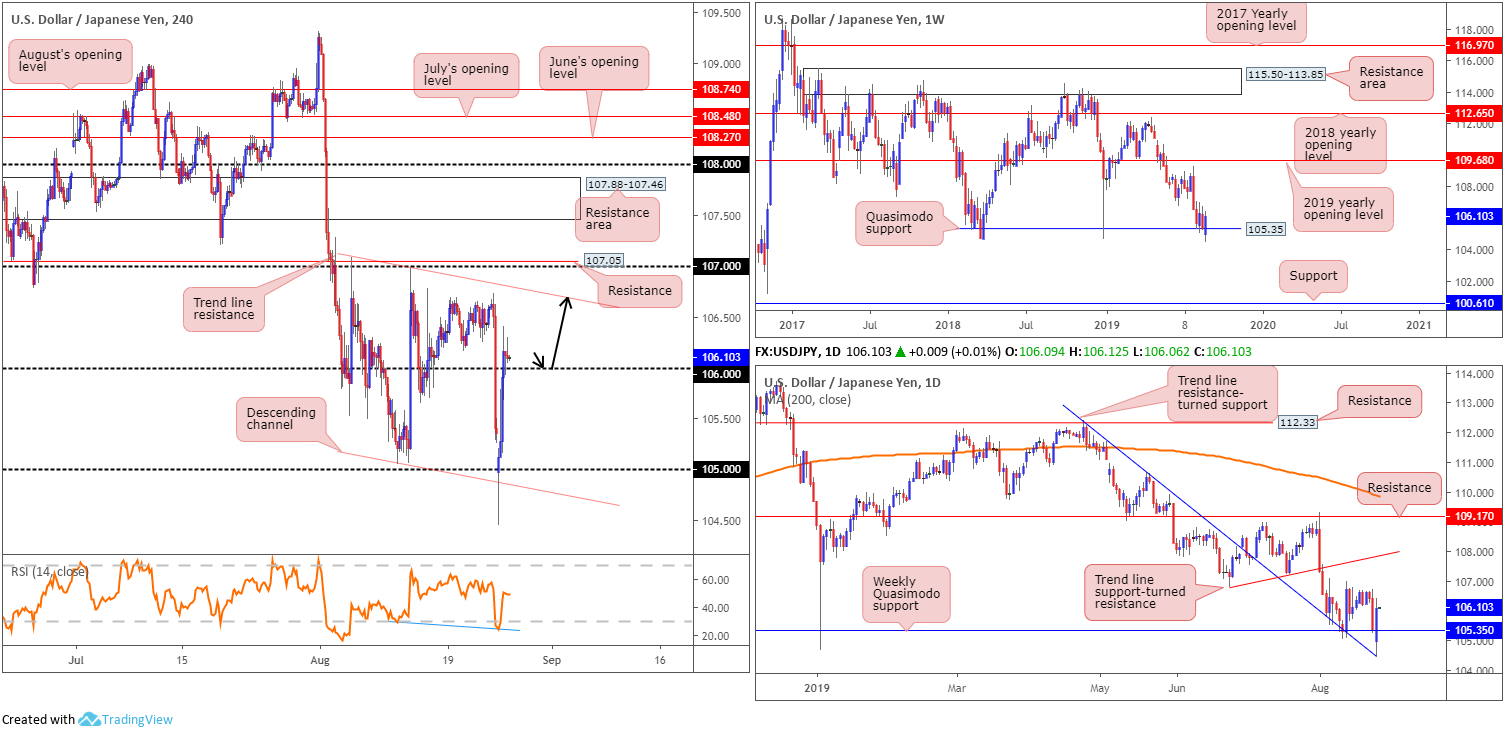
USD/JPY:
Upbeat trade-related headlines led to a swift U-turn in risk sentiment Monday, prompting aggressive short covering that clawed back most Friday’s losses. The same was evident in equity markets, which weighed on the Japanese yen’s safe-haven status.
Early trade observed the H4 candles violently whipsaw through 1.05 and channel support (extended from the low 105.05), consequently clocking lows of 104.44. The buck concluded the day in strong territory, registering 106+ status.
Those who read Monday’s weekly report you may recall the research team highlighted the following:
Although countertrend, a rebound from the 105 neighbourhood on the H4 scale may materialise this week. Triggering sell stops beneath the 105.05 August 12 low along with a whipsaw through 105 to the H4 channel support meandering nearby will help provide liquidity to buy into. Therefore, an ideal scenario would be for H4 price to fakeout beneath 105 in the shape of a bullish candlestick formation. This way, not only have you identified buyer intent, you can also base entry and risk levels on the said candlestick structure.
Well done to any of our readers who managed to catch the move north yesterday. Incredibly attractive risk/reward trade.
On a wider perspective, as highlighted in Monday’s weekly report, we have weekly flow defending Quasimodo support at 105.35 – a level that proved its worth by holding the unit higher at the beginning of the year. Outside of this base, limited support is evident until 100.61, whereas a push north has the 2019 yearly opening level at 109.68 to target.
Beyond the weekly Quasimodo support, daily traders likely have a trend line resistance-turned support (pencilled in from the high 112.40) on the radar, which entered the mix yesterday and held ground.
Areas of consideration:
Having noted H4 price settling above 106 this morning, a retest of this level may open the door for additional bullish scenarios today. A retest motion at 106, preferably by way of a H4 bullish candlestick signal (entry and risk can be adjusted according to this structure), could lead to a move towards trend line resistance (extended from the high 107.09), closely shadowed by the 107 handle and H4 resistance drawn from 107.05.
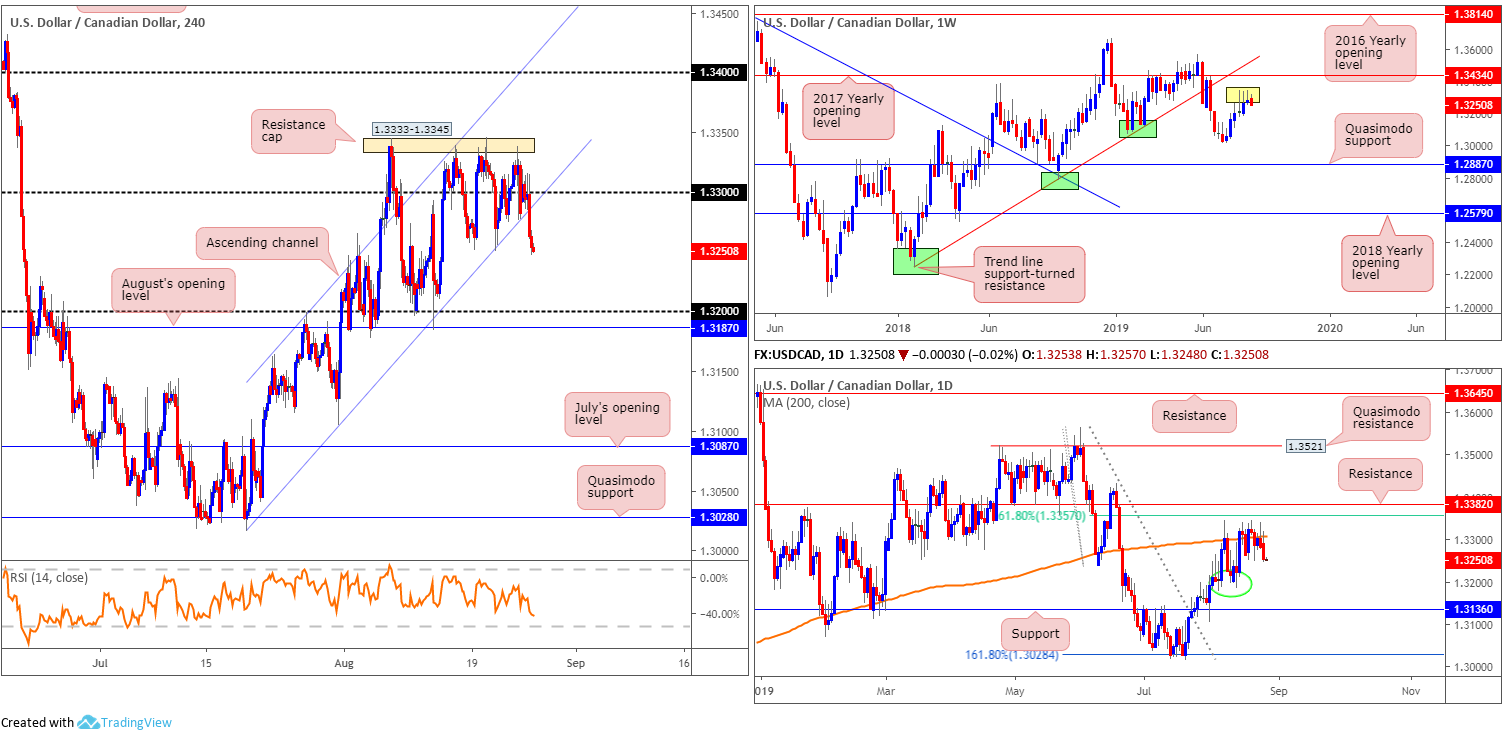
USD/CAD:
Despite the US dollar index staging a healthy recovery which reclaimed most of Friday’s losses, the USD/CAD wrapped up Monday shedding more than 0.20%.
Most notable from a technical perspective, H4 flow overthrew channel support (taken from the low 1.3015 and potentially set the stage for a run to 1.32 and August’s opening level at 1.3187. Before reaching this far south, though, a pullback to 1.33 may occur.
In addition to the above, higher-timeframe movement has the daily candles rejecting the underside of the 200-day SMA (currently circulating around 1.3307). While downside has local support concentrated around 1.3190 (green circle), the more prominent support falls in a touch lower at 1.3136. In terms of weekly price action, longer-term direction has been lethargic, shaped in the form of back-to-back selling wicks (yellow). Although considered a sign of healthy rejection, the unit still exhibits scope to approach the 2017 yearly opening level at 1.3434, closely shaded by trend line support-turned resistance pencilled in from the low 1.2247.
Should we turn lower and leave the said resistances unchallenged, though, traders’ focus will likely be on the 1.3016 July 15 low, followed by Quasimodo support at 1.2887.
Areas of consideration:
Based on the chart studies presented above, sellers appear to have the upper hand at the moment. For those interested in this bearish theme, a short at current price is an idea, with a protective stop-loss order plotted above 1.33 and an initial take-profit target at 1.32. For those who prefer a retest, selling at the underside of 1.33, assuming we reach this far north, is also an option. The latter also improves risk/reward.
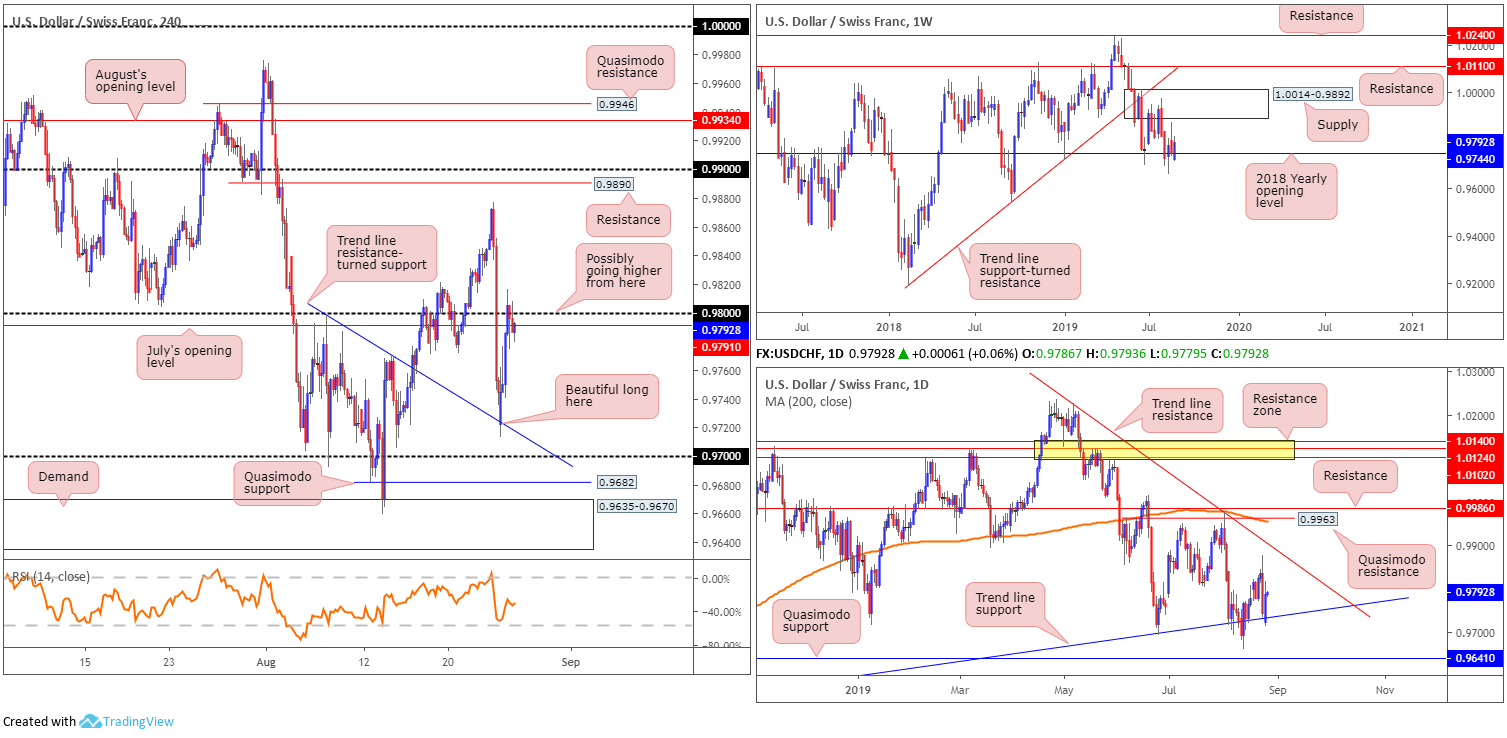
USD/CHF:
Amid an improvement in risk sentiment between the US and China, in which leaders spoke about reigniting negotiations again, demand for the safe-haven Swiss franc diminished Monday, sending the USD/CHF 0.43% higher.
Included within Monday’s weekly briefing was a potential long opportunity off trend line resistance-turned support on the H4 timeframe (0.9797). Although the reaction failed to pencil in a bullish candlestick signal – a requirement according to our chart studies – the rebound lifted the candles beyond 0.98, though struggled to sustain gains and mildly pared the move into the close.
As evident on the weekly timeframe, the 2018 yearly opening level drawn from 0.9744 remains supportive and may eventually encourage a run to supply plotted nearby at 1.0014-0.9892. In conjunction with weekly support at 0.9744, trend line support on the daily timeframe (taken from the low 0.9542) entered the fray. Further buying from this region could lift the market to trend line resistance (extended from the high 1.0226).
Areas of consideration:
For traders who remain long this market, reducing risk to breakeven and liquidating partial profits is an option, particularly after H4 price failed to establish support above 0.98.
In the event further buying emerges, however, as the higher-timeframes suggest, a bullish scenario may occur above 0.98, targeting the daily trend line resistance highlighted above (1.0226). Conservative traders will likely want to witness a H4 close form above 0.98 followed by a retest play, preferably in the shape of a H4 bullish candlestick signal. More aggressive traders who favour trading the breakout candle, nevertheless, are likely to enter on the close of the formation and position stop-loss orders beneath the candlestick’s lower shadow.
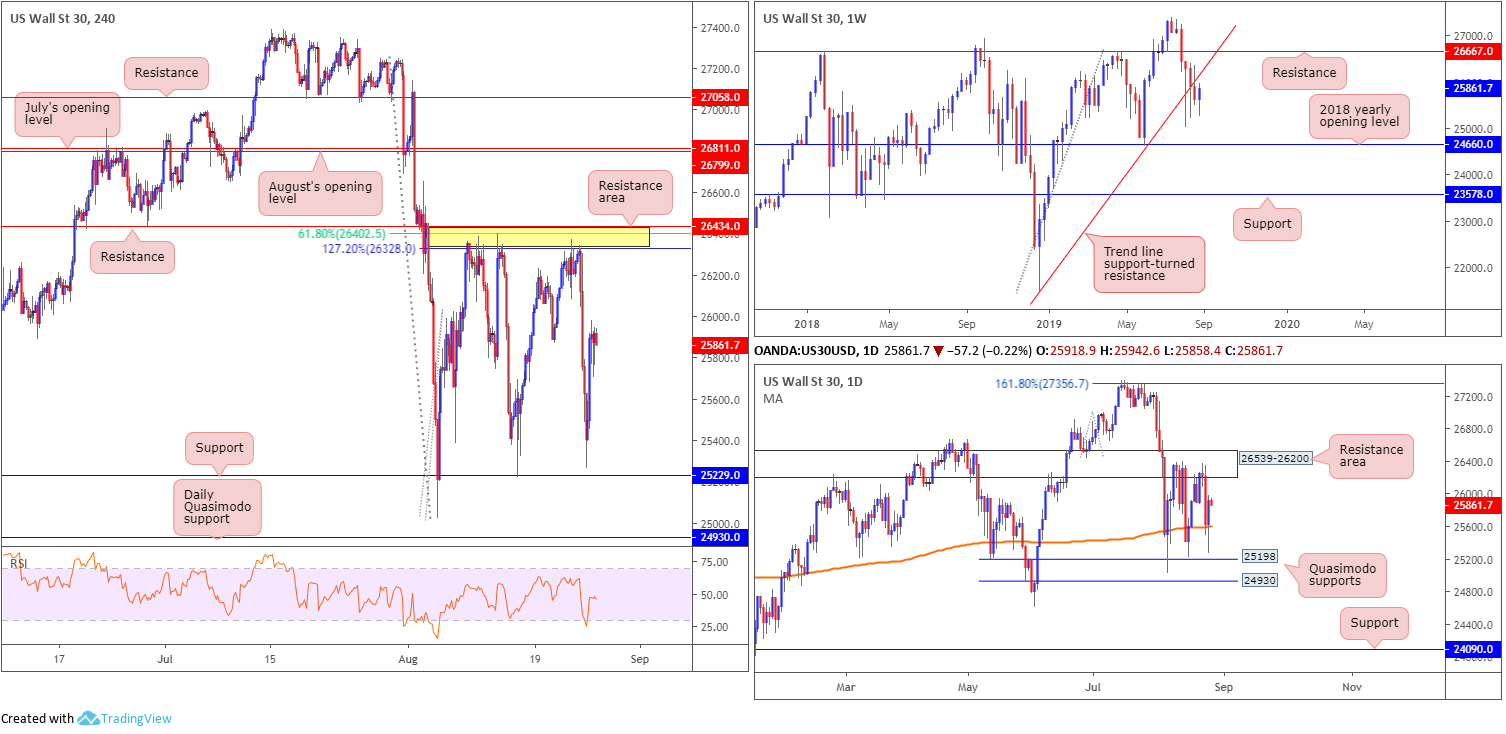
Dow Jones Industrial Average:
Hopes of reigniting trade talks between the US and China buoyed Wall Street Monday, helping stem a sharp sell-off in Asia as comments from President Donald Trump bolstered risk assets. The Dow Jones Industrial Average added 269.93 points, or 1.05%; the S&P 500 advanced 31.27 points, or 1.10% and the tech-heavy Nasdaq 100 also rallied 110.02 points, or 1.47%.
Kicking things off from the weekly timeframe this morning, price action is seen fast approaching the underside of a recently broken long-term trend line support (taken from the low 21452). A retest at this base could spark another wave of selling. Failing that, traders’ crosshairs will likely be fixed on resistance at 26667.
Since early August, the daily candles have been bounded by a Quasimodo support coming in at 25198 and a resistance area forged at 26539-26200. What’s notable from a technical perspective is the said resistance zone is sited just south of weekly resistance at 26667, and yesterday’s movement respected the 200-day SMA function (orange – 25611).
H4 flow remains capped by a familiar resistance zone at 26434/26328 (comprised of resistance at 26434, a 127.2% Fibonacci ext. point at 26328 and a 61.8% Fibonacci retracement value at 26402). This is the third time this month the index has responded from here, once more exposing support at 25229, the lower base of the current H4 range, closely followed by daily Quasimodo support at 24930. The RSI indicator, for those who follow momentum oscillators, is also currently producing positive divergence (RSI double bottom) at the oversold value.
Areas of consideration:
Longer term, the research team has eyes on the trend line support-turned resistance on the weekly timeframe. A rejection off this line could spell trouble for longs, with the next downside target on this scale coming in at the 2018 yearly opening level at 24660. What’s also interesting is the daily resistance area at 26539-26200 also bolsters the noted weekly line.
Medium term (H4), crosshairs remain on the H4 resistance area at 26434/26328 for additional reactions, owing to the zone being positioned within the limits of the daily resistance area, which as we already know has a connection to a weekly trend line resistance. Therefore, keep an eye open for a test of this zone, preferably in the form of a bearish candlestick pattern. Traders then have the option of setting entry/risk levels by the H4 or daily resistance areas, or simply on the back of the candlestick structure.
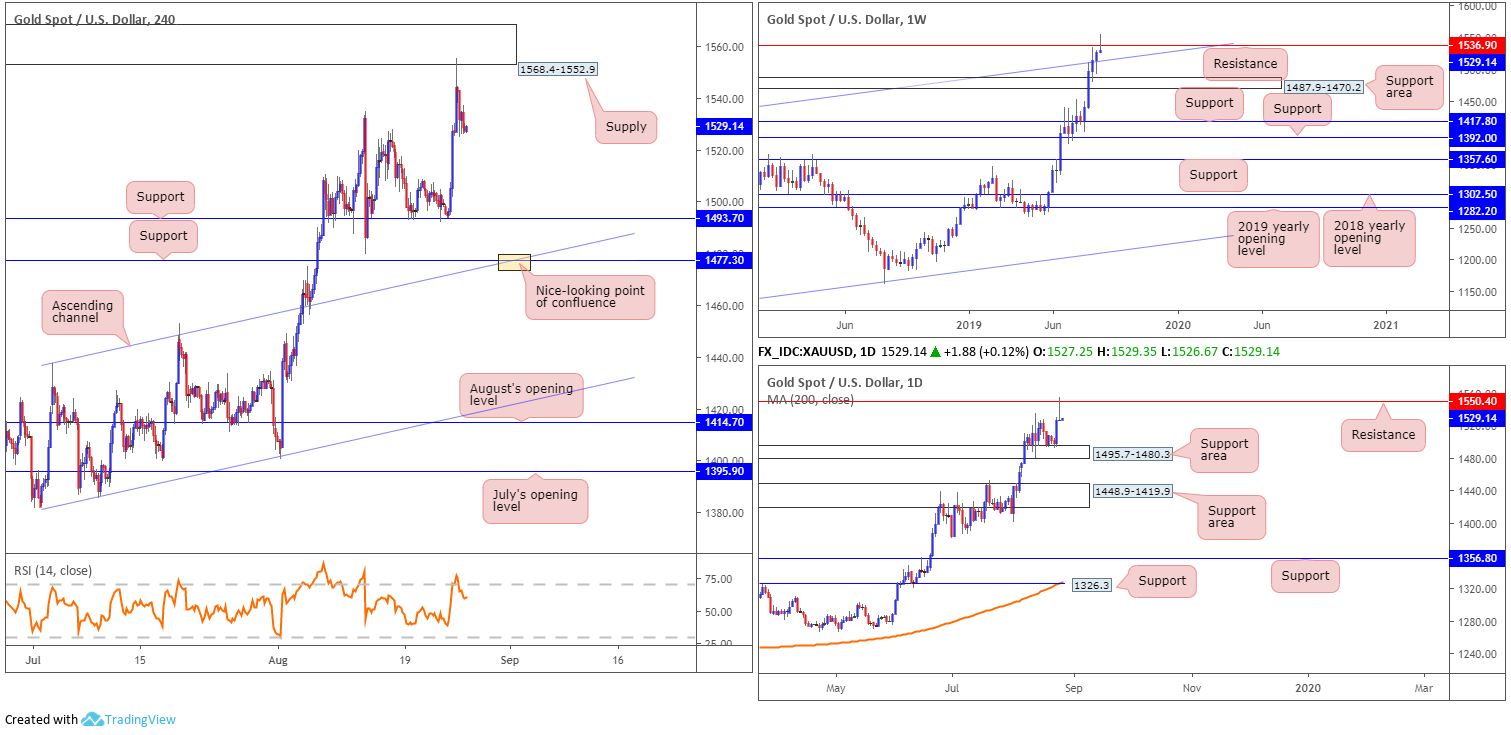
XAU/USD (GOLD):
Governed largely on the back of risk sentiment and the position of the US dollar index, bullion advanced to highs at 1555.3 Monday and challenged H4 supply coming in at 1568.4-1552.9. Further selling from this angle is probable, due to the where price action is positioned on the higher timeframes.
Weekly movement is seen challenging resistance at 1536.9, currently formed by way of a shooting star pattern. This, by and of itself, is likely to entice selling, at least until we reach channel resistance-turned support (extended from the high 1375.1). By the same token, daily price also tested resistance at 1550.4 and wrapped up Monday in the shape of a shooting star pattern. The next downside target from here can be seen at a support area drawn from 1495.7-1480.3.
Areas of consideration:
With all three timeframes exhibiting scope to explore lower ground, a sell at current price is certainly an option, targeting H4 support coming in at 1493.7, followed by another layer of support at 1477.3, which happens to merge with a channel resistance-turned support (taken from the high 1437.7). The latter zone is also considered a base for potential longs should we reach this low.
The accuracy, completeness and timeliness of the information contained on this site cannot be guaranteed. IC Markets does not warranty, guarantee or make any representations, or assume any liability regarding financial results based on the use of the information in the site.
News, views, opinions, recommendations and other information obtained from sources outside of www.icmarkets.com.au, used in this site are believed to be reliable, but we cannot guarantee their accuracy or completeness. All such information is subject to change at any time without notice. IC Markets assumes no responsibility for the content of any linked site.
The fact that such links may exist does not indicate approval or endorsement of any material contained on any linked site. IC Markets is not liable for any harm caused by the transmission, through accessing the services or information on this site, of a computer virus, or other computer code or programming device that might be used to access, delete, damage, disable, disrupt or otherwise impede in any manner, the operation of the site or of any user’s software, hardware, data or property.


