
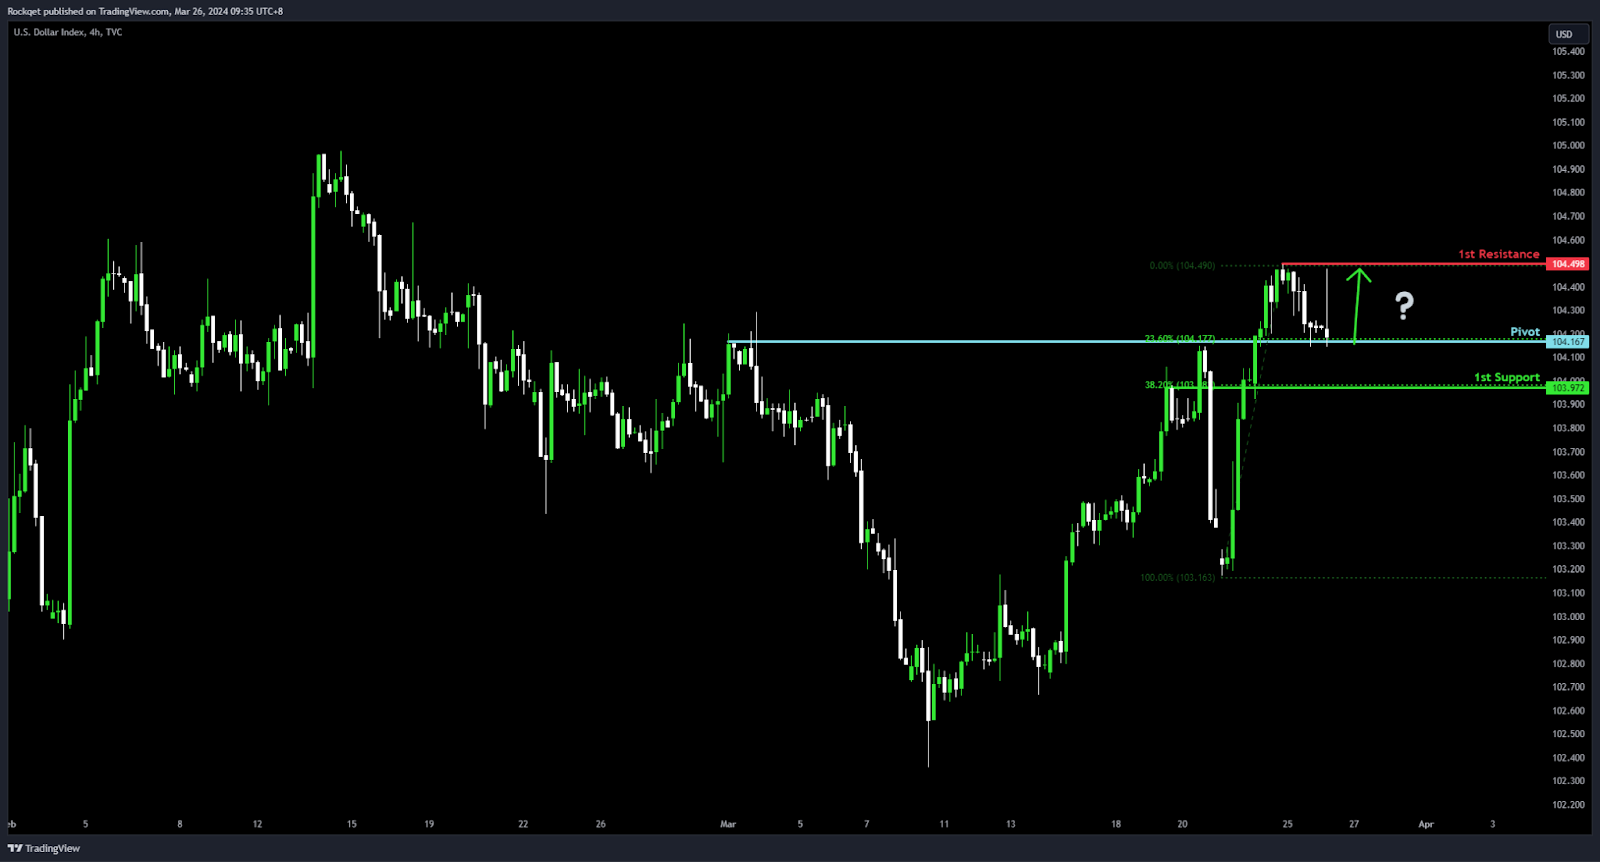
DXY:
Potential Direction: Bullish
Overall momentum of the chart: Bullish
Price could potentially make a Bullish bounce off pivot and head towards 1st resistance
Pivot: 104.16
Supporting reasons: Acts as an Overlap support and aligns with a 23.60% Fibonacci Retracement, providing a strong base for potential upward movements.
1st support: 103.92
Supporting reasons: Offers Pullback support at a 38.20% Fibonacci Retracement level, representing a key area where previous buying interest has successfully countered downward trends
1st resistance: 104.49
Supporting reasons: Serves as Multi-swing high resistance, posing a significant hurdle that needs to be overcome for the bullish momentum to continue.
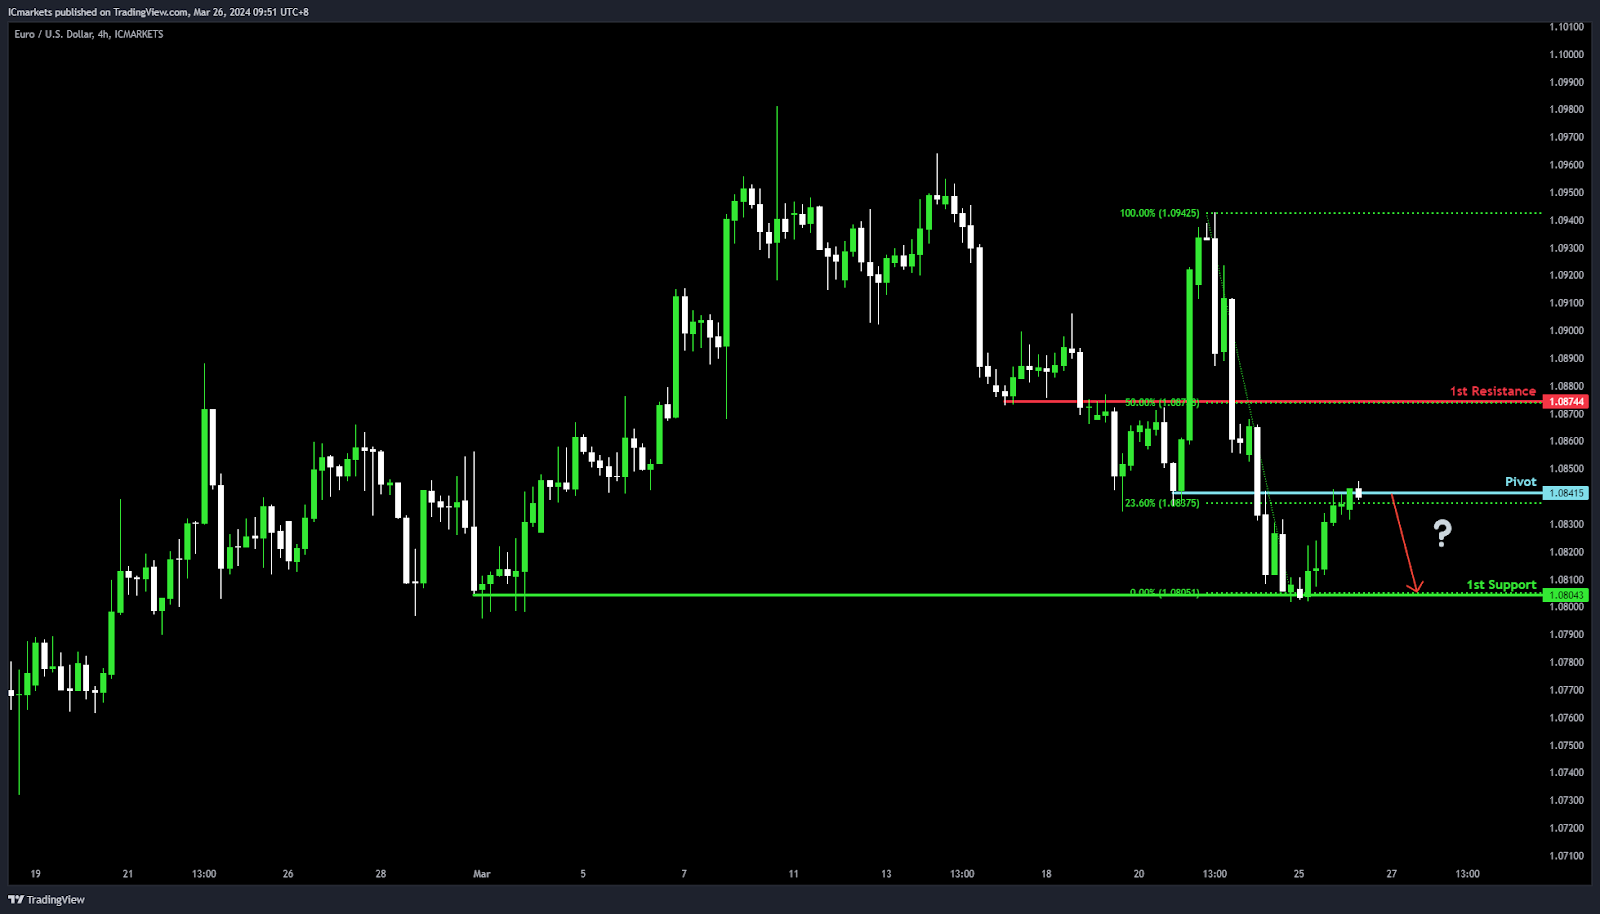
EUR/USD:
Potential Direction: Bearish
Overall momentum of the chart: Bearish
Price could potentially make a Bearish reaction off pivot and drop to 1st support
Pivot: 1.0841
Supporting reasons: Identified as an Overlap resistance, indicating a crucial level where selling pressure may intensify, pushing the price downwards as traders react to this technical barrier.
1st support: 1.0804
Supporting reasons: Acts as a Multi-swing low support, marking a significant floor where the market has previously found stability and buyers have entered, potentially halting further declines.
1st resistance: 1.0874
Supporting reasons: Serves as Pullback resistance, complemented by a 50% Fibonacci Retracement, highlighting a pivotal area where the upward movement might face resistance, making it a critical point for bearish trend continuation.
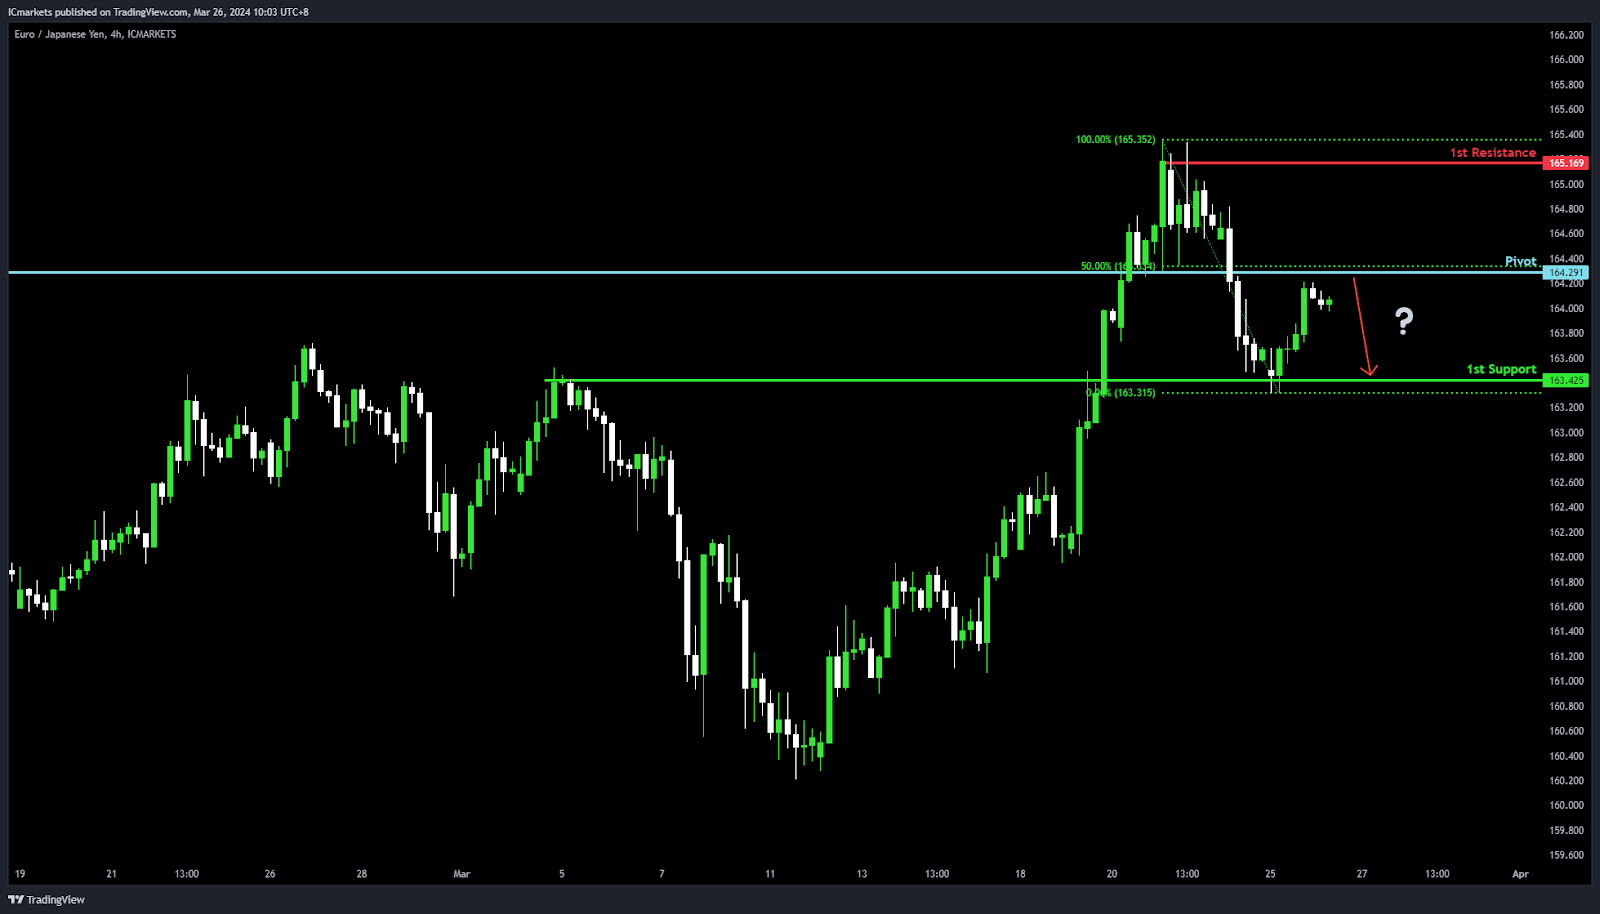
EUR/JPY:
Potential Direction: Bearish
Overall momentum of the chart: Bullish
Price could potentially make a: Bearish reaction off pivot and drop to 1st support
Pivot: 164.29
Supporting reasons: Acts as Pullback resistance and aligns with a 50% Fibonacci Retracement, marking a key point where sellers might start pushing prices down, indicating a possible shift in price direction.
1st support: 163.42
Supporting reasons: Serves as an Overlap support, a crucial area where buyers have historically stepped in, suggesting a strong base that could halt the bearish momentum.
1st resistance: 165.16
Supporting reasons: Characterized by Multi-swing high resistance, a significant barrier that has previously capped upward movements, making it a pivotal point for monitoring potential reversals or continuations of the bullish trend.
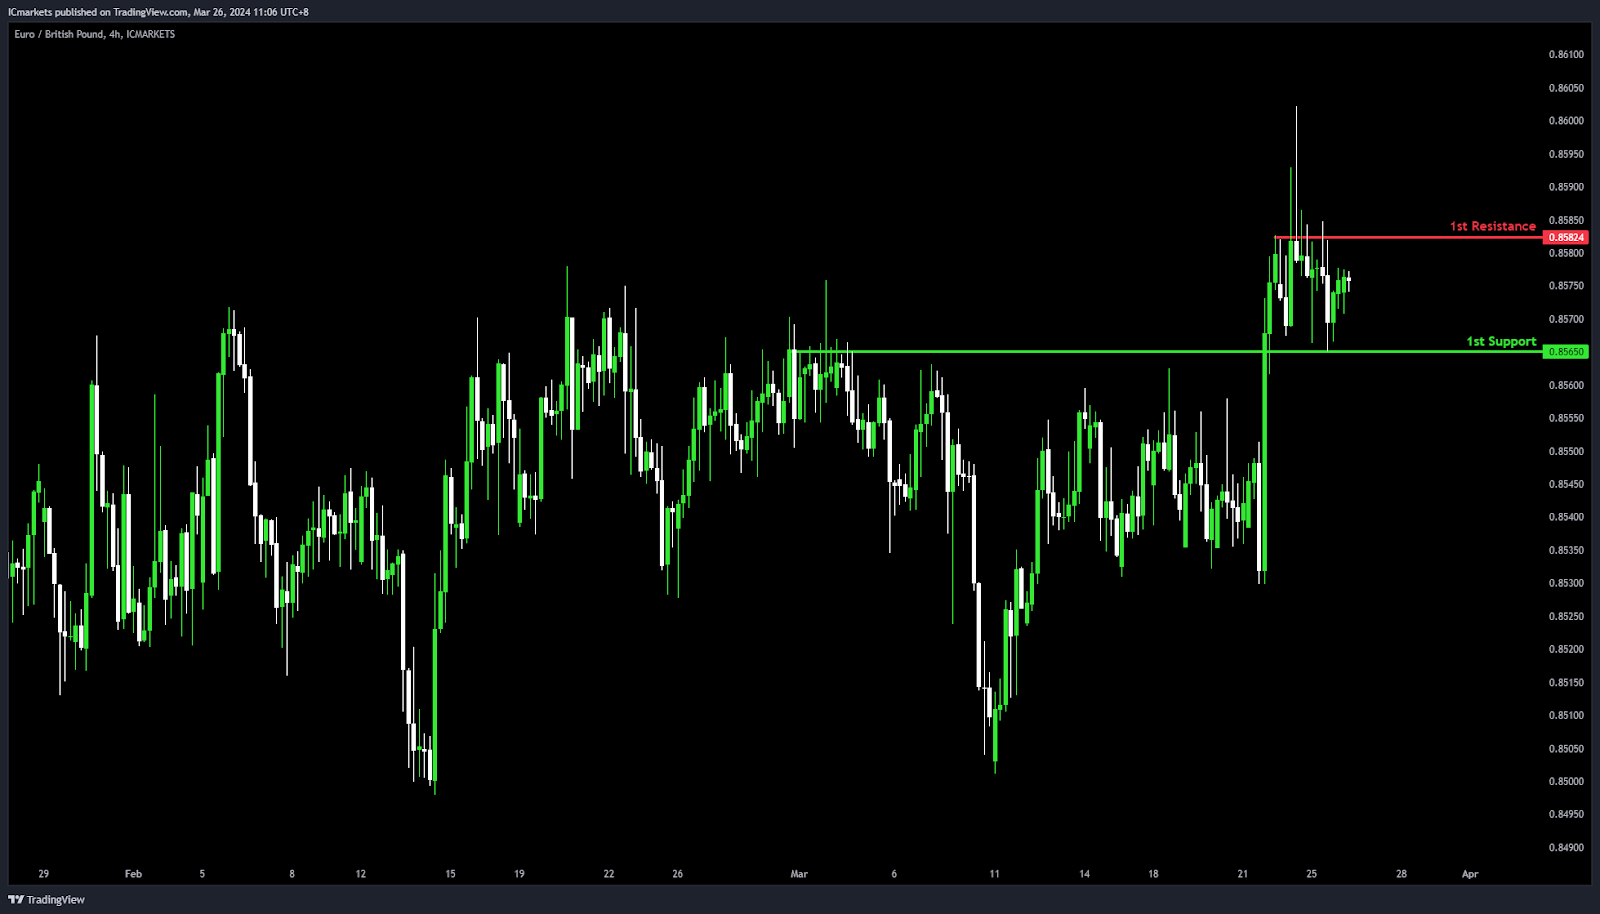
EUR/GBP:
Potential Direction: Neutral
Overall momentum of the chart: Neutral
Price could potentially make a: Fluctuation between the 1st resistance and 1st support level.
1st support: 0.8565
Supporting reasons: Acts as an Overlap support, a key level where buying interest has historically been strong enough to stop further declines and potentially initiate a bounce, indicating its role as a solid base for the price.
1st resistance: 0.8582
Supporting reasons: Characterized by Multi-swing high resistance, marking a significant ceiling that has previously limited upward movements, highlighting its importance as a potential turning point for the price, possibly capping gains and maintaining the current range.
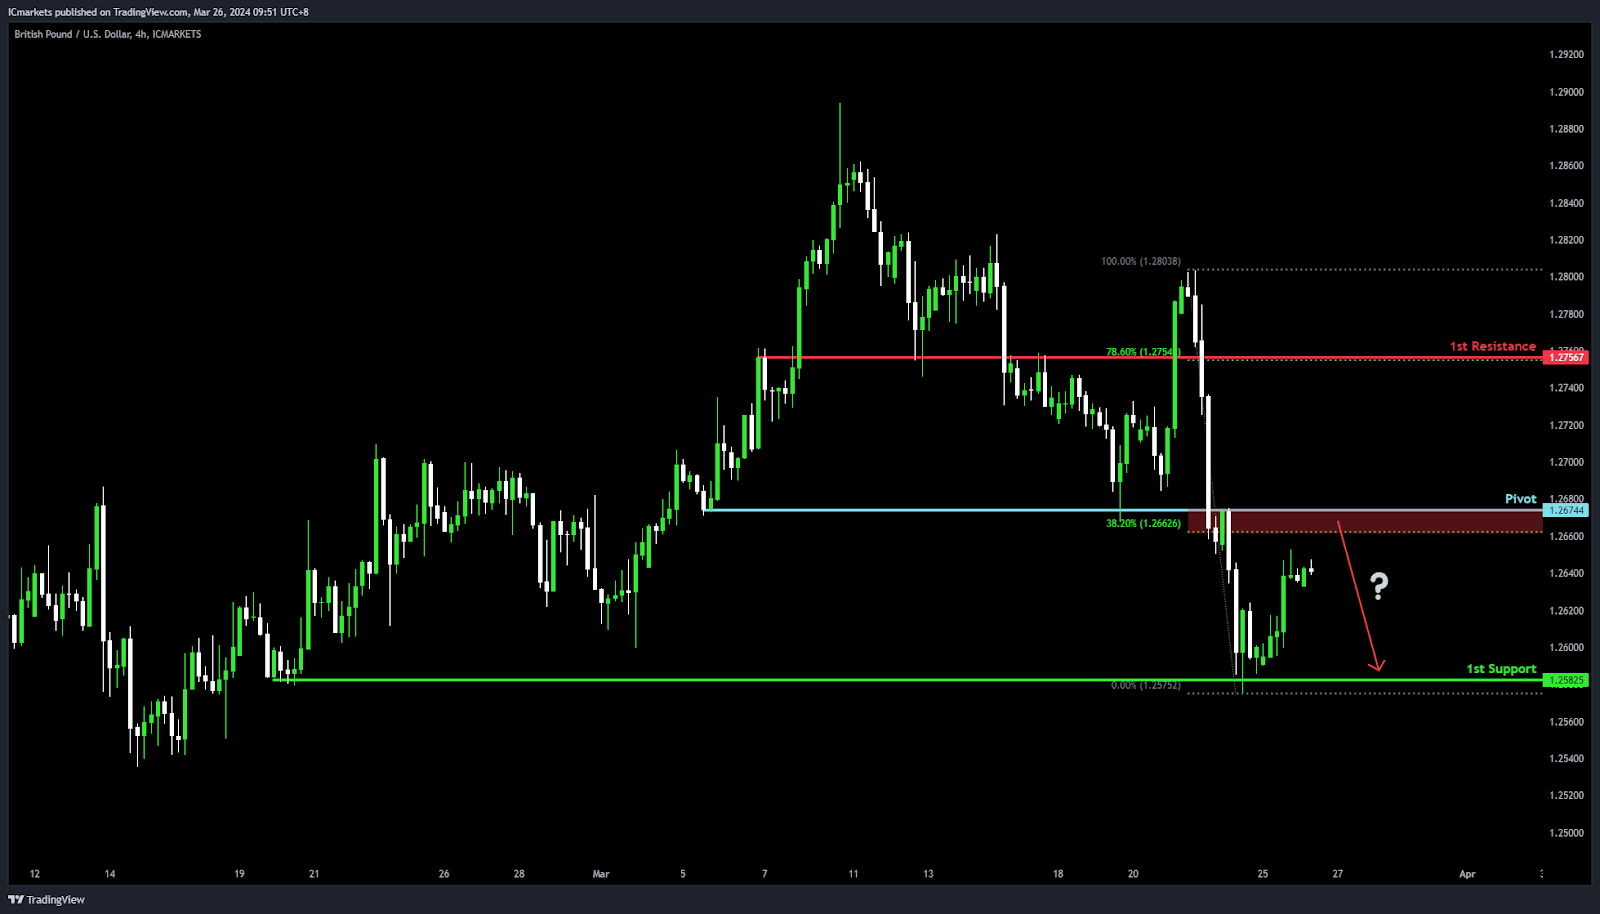
GBP/USD:
Potential Direction: Bearish
Overall momentum of the chart: Bearish
Price could potentially make a: Bearish reaction off pivot and drop to 1st support
Pivot: 1.2674
Supporting reasons: Serves as an Overlap resistance and aligns with a 38.20% Fibonacci Retracement, making it a key level where sellers could gain an upper hand, driving the price lower as it acts as a technical barrier to upward movements.
1st support: 1.2582
Supporting reasons: Identified as Multi-swing low support, this level represents a significant historical floor where buying interest has previously emerged to stall further declines, suggesting it could once again provide a basis for a potential rebound or slow down the bearish momentum.
1st resistance: 1.2756
Supporting reasons: Functions as Pullback resistance, reinforced by a 78.60% Fibonacci Retracement. This delineates a critical threshold that, if unbroken, could cement the bearish outlook.
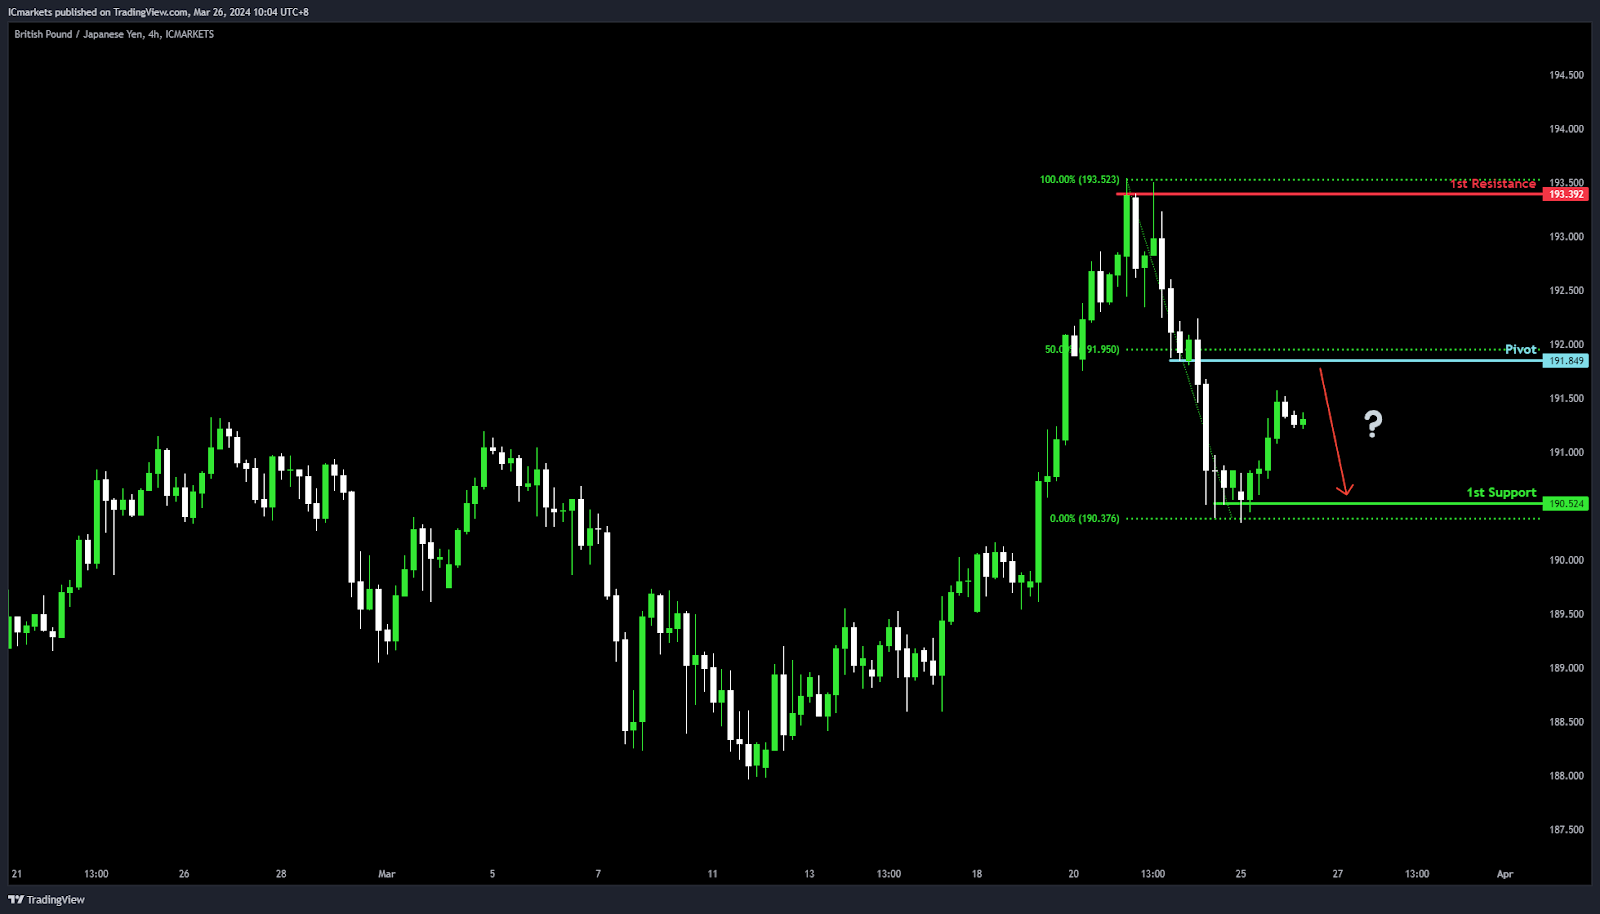
GBP/JPY:
Potential Direction: Bearish
Overall momentum of the chart: Bullish
Price could potentially make a: Bearish reaction off pivot and drop to 1st support
Pivot: 191.84
Supporting reasons: Acts as Pullback resistance with a 50% Fibonacci Retracement, marking a key level where sellers might start pushing prices down, showing it’s an important spot for possible changes in how the price moves.
1st support: 190.52
Supporting reasons: Serves as Multi-swing low support, a strong area that could stop the price from falling further, indicating it’s a crucial base for potentially halting the bearish momentum.
1st resistance: 193.39
Supporting reasons: Known as Multi-swing high resistance, a level that has previously stopped the price from climbing higher, marking it as a significant barrier for price movements.
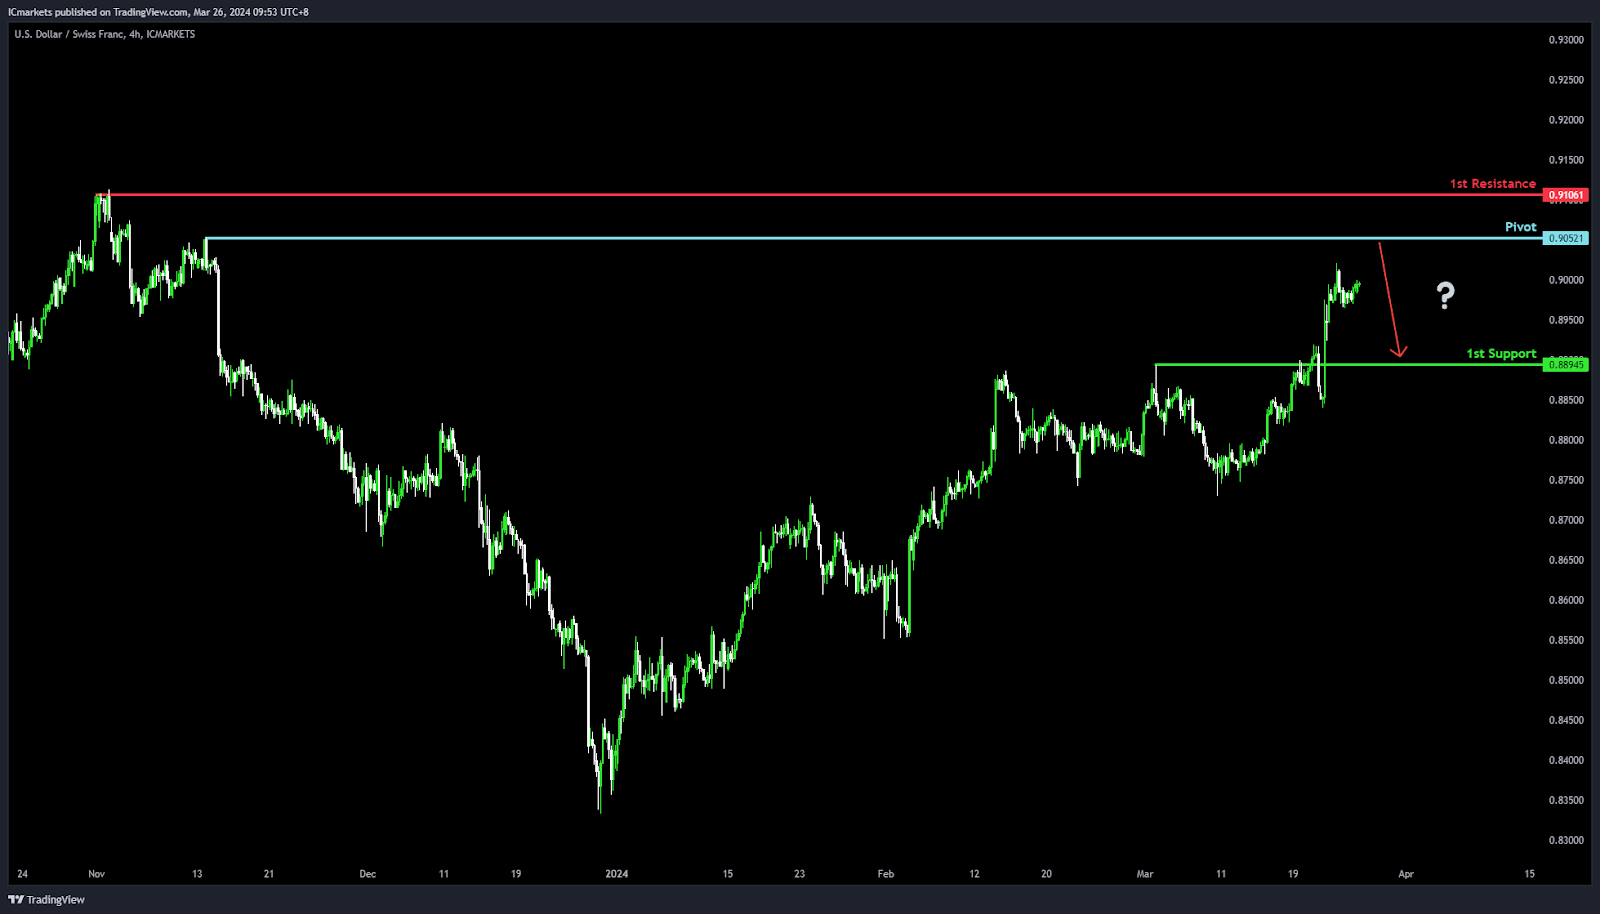
USD/CHF:
Potential Direction Bearish
Overall momentum of the chart Bullish
Price could potentially make a bearish reaction off pivot and drop to 1st support
Pivot 0.9052
Supporting reasons: Swing high resistance, marking a significant level where the price has previously encountered resistance, potentially triggering a reversal or halt in upward momentum
1st support 0.8894
Supporting reasons: Pullback support, indicating a level where the market has found support in the past, offering a potential area for price stabilization or a rebound after a decline
1st Resistance 0.9106
Supporting reasons: Multi-swing high resistance, highlighting a critical barrier that has capped previous attempts to push higher, making it a pivotal point for monitoring potential bearish reversals or continuation of the bullish trend
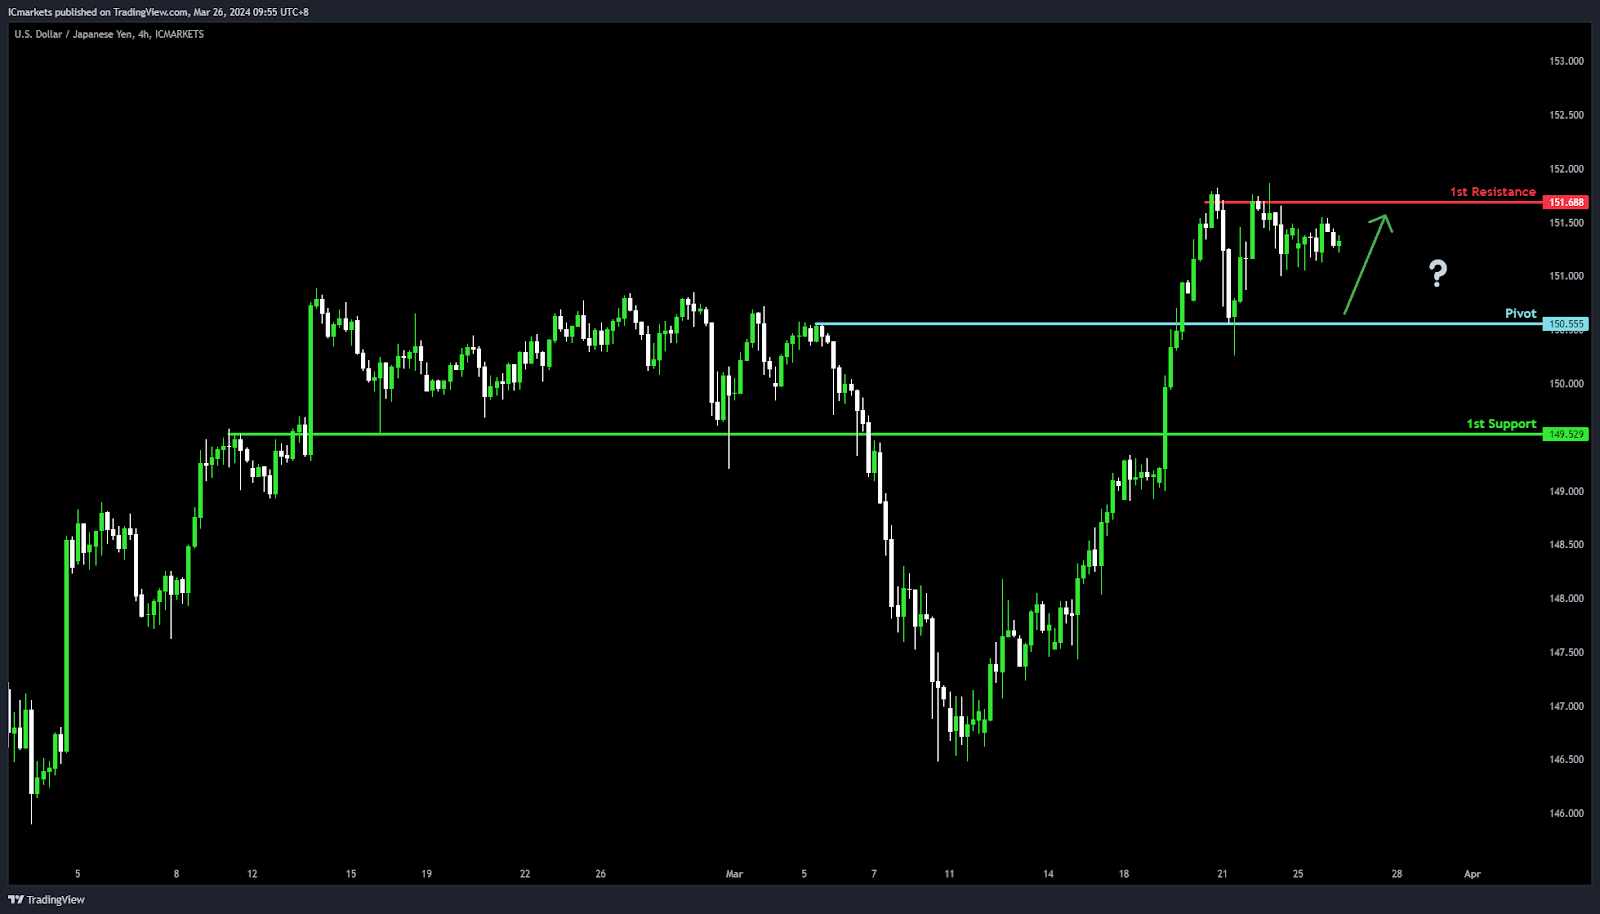
USD/JPY:
Potential Direction: Bullish
Overall momentum of the chart: Bullish
Price could potentially make a bullish bounce-off pivot and head toward 1st resistance
Pivot: 150.55
Supporting reasons: An Overlap support, indicating a level where buying interest is typically strong, suggesting a solid foundation for a potential upward move
1st support: 149.52
Supporting reasons: Pullback support, represents a key area where the market has historically found buyers ready to step in, highlighting its importance for sustaining bullish momentum
1st resistance: 151.68
Supporting reasons: Multi-swing high resistance, marking a significant barrier that has previously capped upward movements, making it a critical point for bulls to overcome for a continued bullish
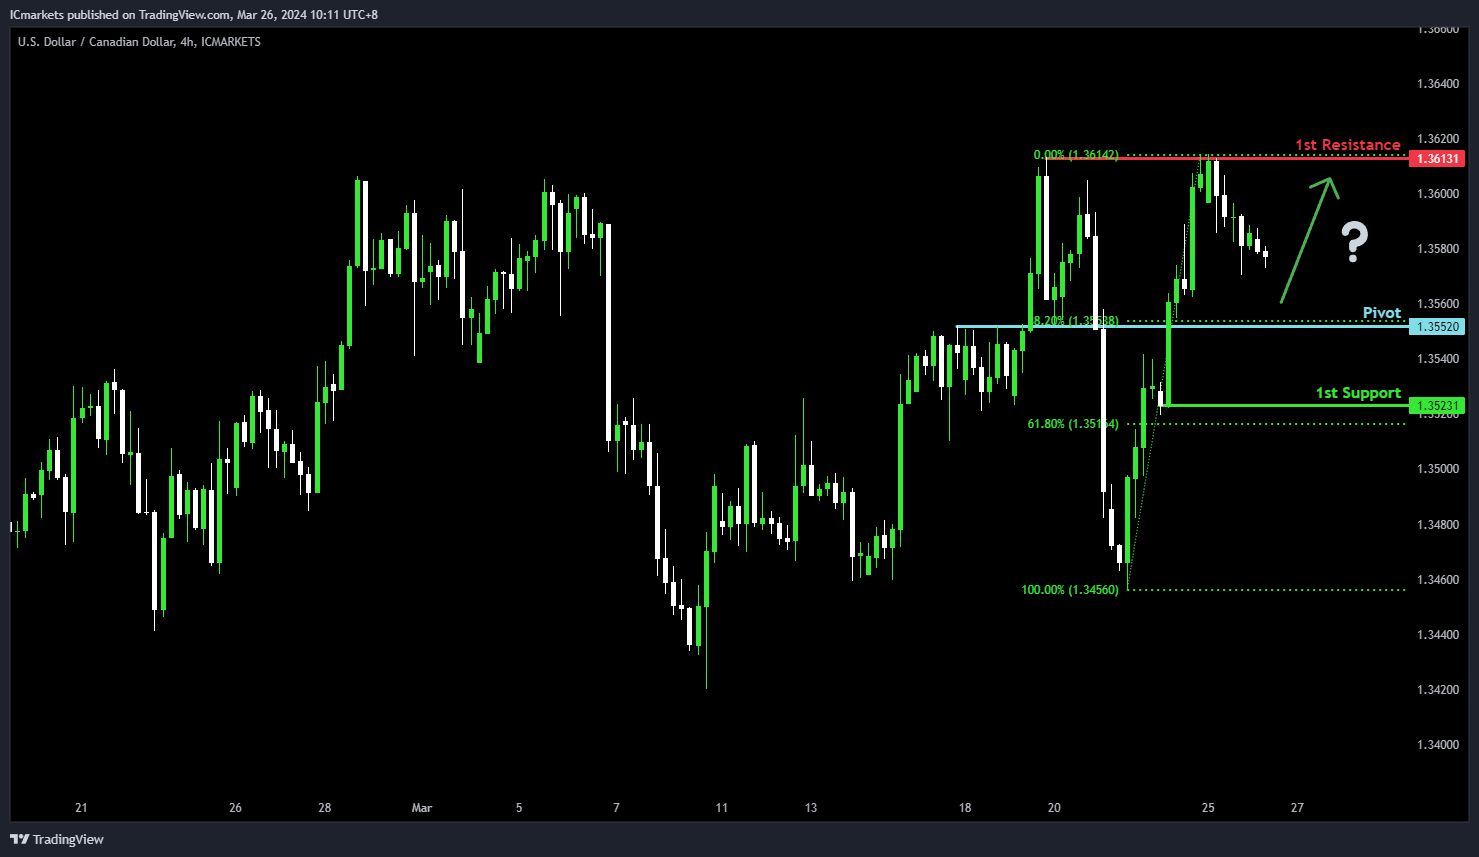
USD/CAD:
Potential Direction: Medium Bearish
Overall momentum of the chart: Bullish
Price could potentially fall towards the pivot and make a bullish bounce to rise towards the 1st resistance.
Pivot: 1.3552
Supporting reasons: This level acts as an overlap support that aligns close to a 38.20% Fibonacci retracement, potentially initiating a bullish reversal if the level holds as support.
1st Support: 1.3523
Supporting reasons: This level acts as a pullback support that aligns close to a 61.80% Fibonacci retracement, indicating a level where price has found strong support in the past.
1st Resistance: 1.3613
Supporting reasons: This level is identified as a multi-swing-high resistance, aligning with a 78.60% Fibonacci retracement, marking it as a critical threshold for bullish momentum to overcome; resistance at this level could cap further upside movements.
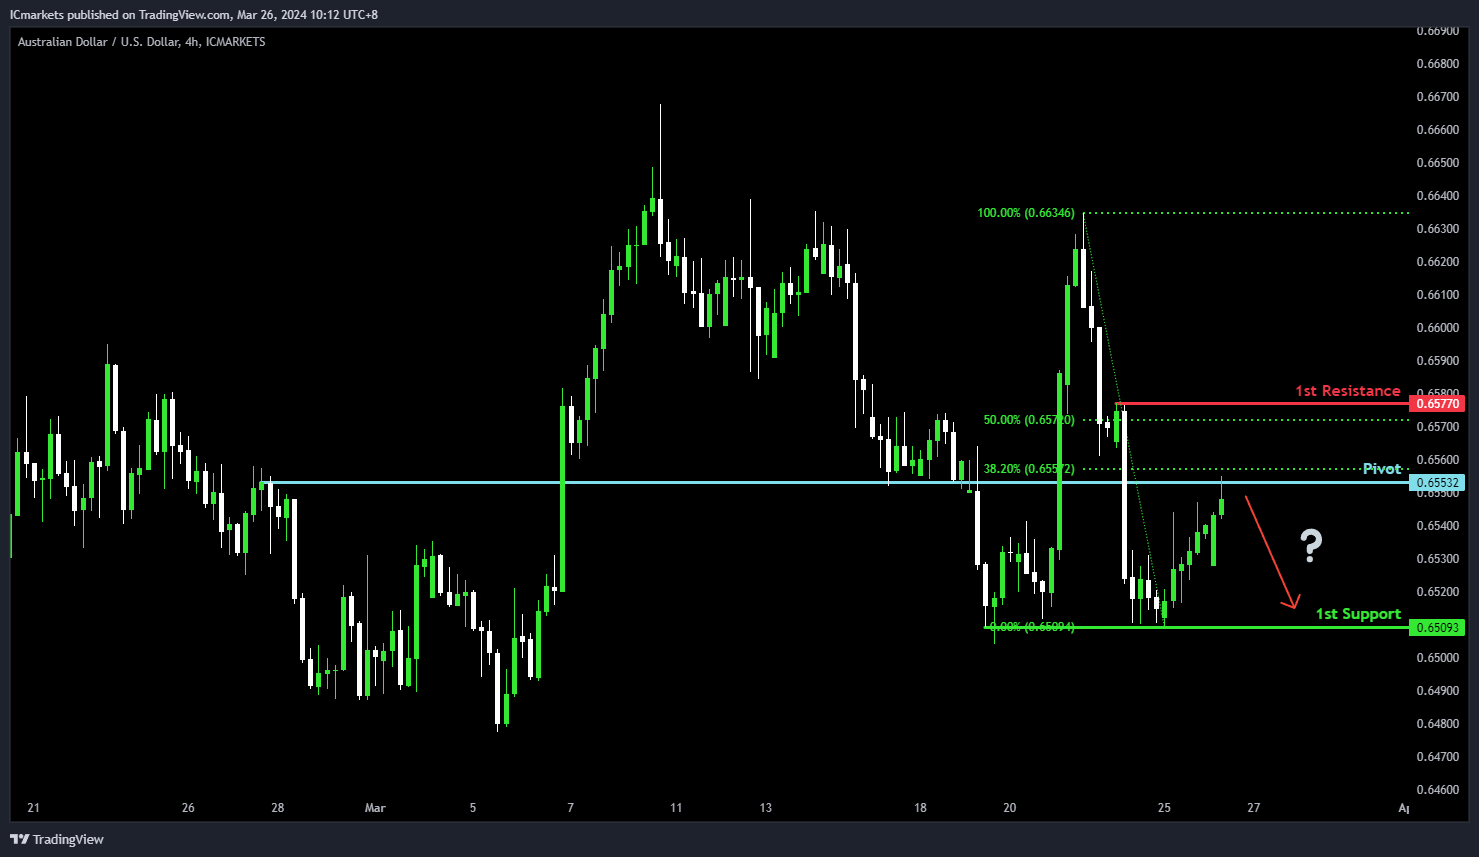
AUD/USD:
Potential Direction: Medium Bullish
Overall momentum of the chart: Bearish
Price could potentially rise toward the pivot to make a bearish reaction and then drop towards the 1st support.
Pivot: 0.6553
Supporting reasons: This level acts as an overlap resistance that aligns close to the 38.20% Fibonacci retracement, potentially initiating a bearish reversal if the level holds as resistance.
1st Support: 0.6509
Supporting reasons: This level acts as a pullback support, indicating a level where price has found strong support in the past.
1st Resistance: 0.6577
Supporting reasons: This level is identified as a pullback resistance that aligns close to a 50.0% Fibonacci retracement, marking it as a critical threshold for bullish momentum to overcome; resistance at this level could cap further upside movements.
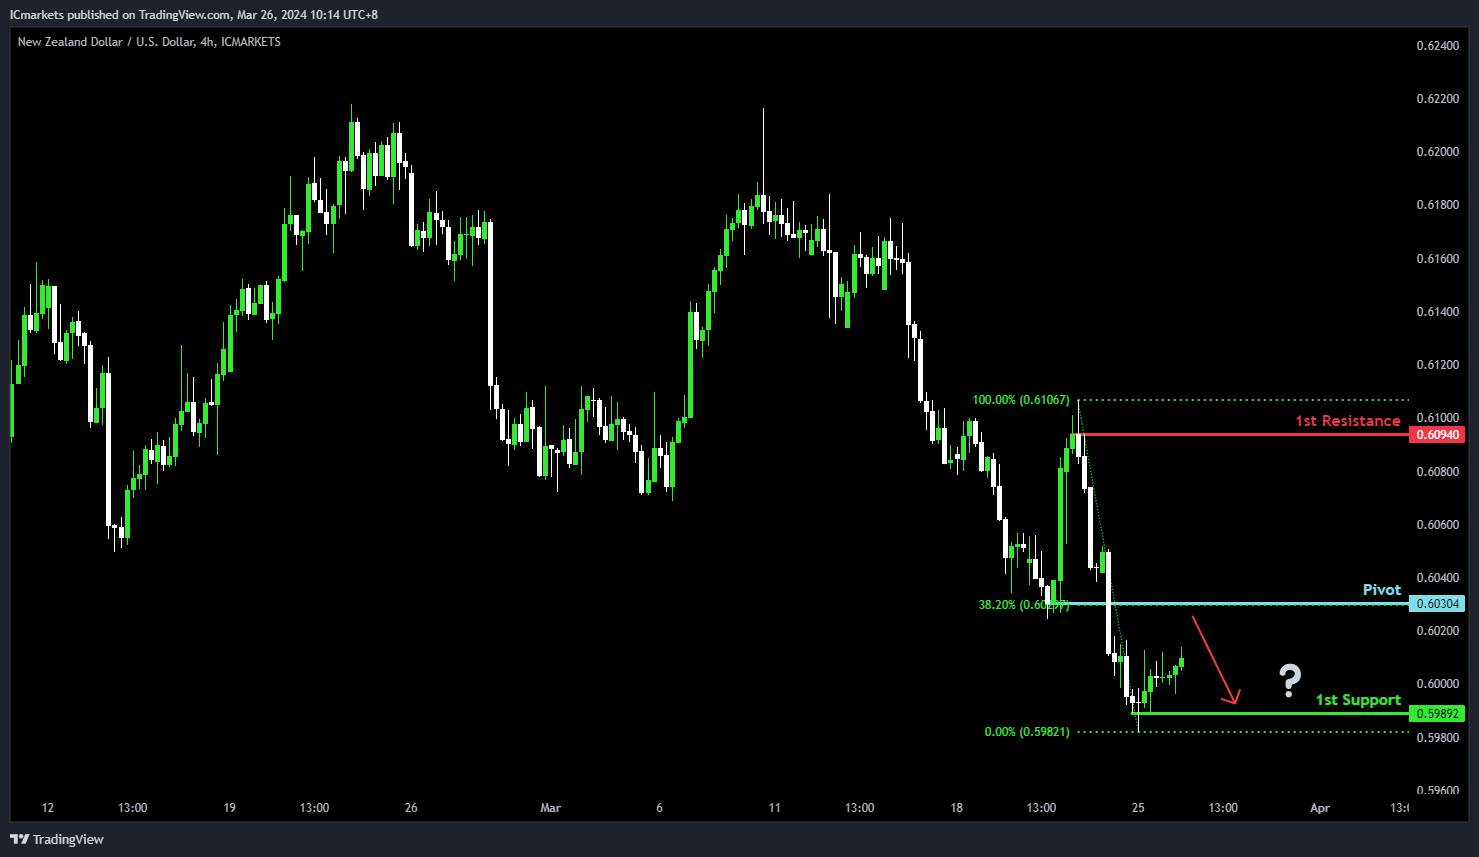
NZD/USD
Potential Direction: Weak Bullish
Overall momentum of the chart: Bearish
Price could potentially rise toward the pivot to make a bearish reaction and then drop towards the 1st support.
Pivot: 0.6030
Supporting reasons: This level acts as a pullback resistance that aligns with the 38.20% Fibonacci retracement, potentially initiating a bearish reversal if the level holds as resistance.
1st Support: 0.5989
Supporting reasons: This level acts as a pullback support, indicating a level where price has found strong support in the past.
1st Resistance: 0.6094
Supporting reasons: This level is identified as a pullback resistance, marking it as a critical threshold for bullish momentum to overcome; resistance at this level could cap further upside movements.
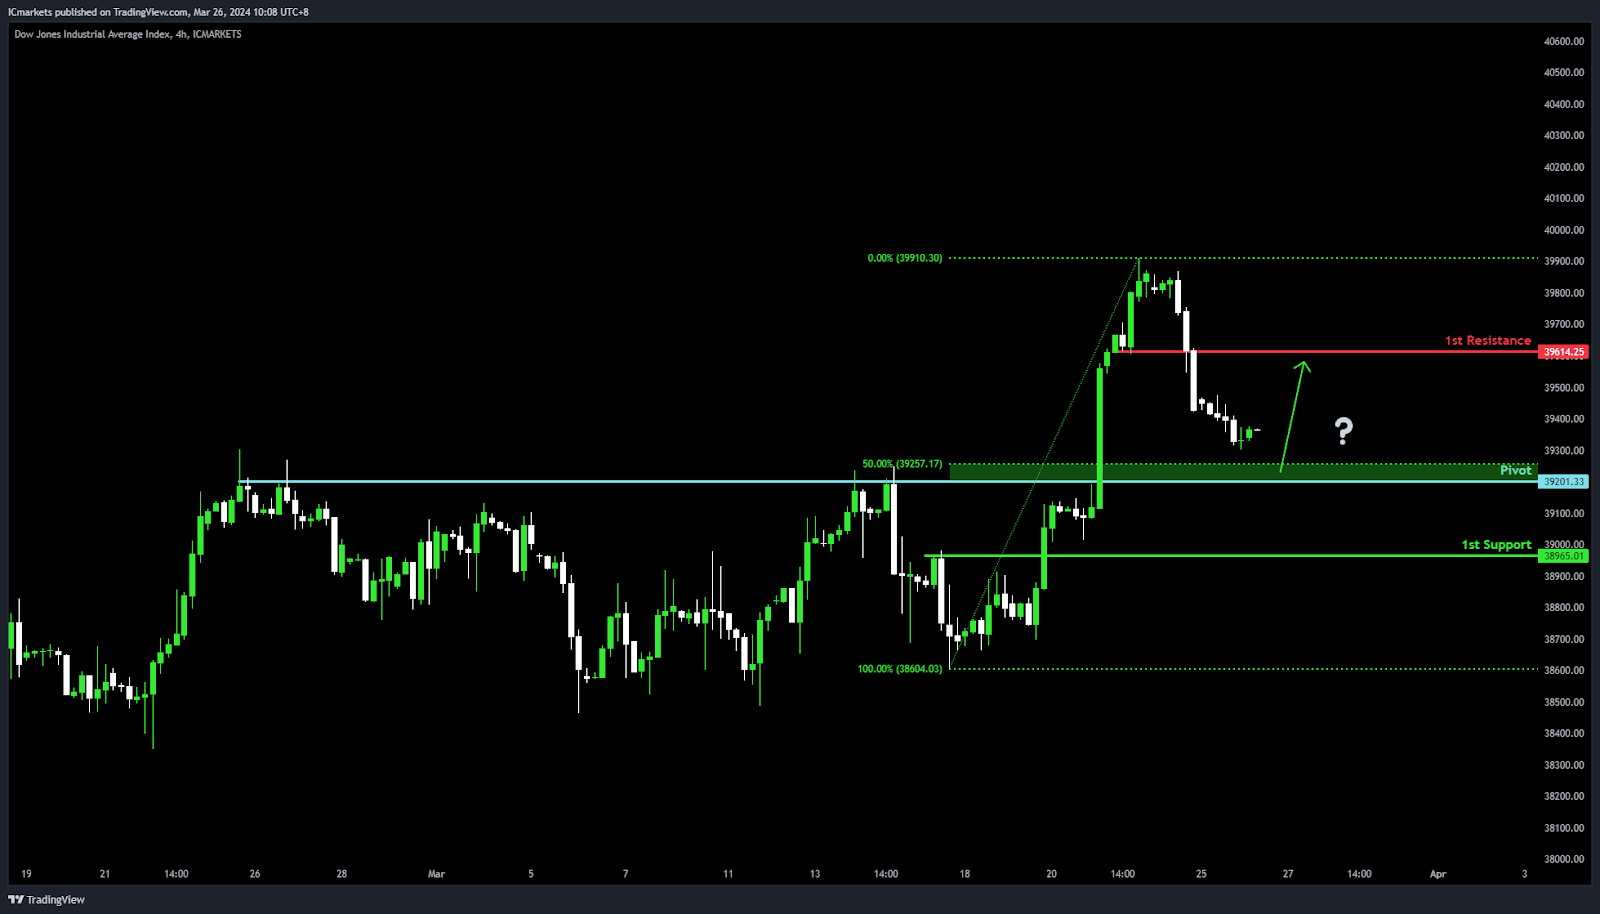
DJ30:
Potential Direction: Weak Bullish
Overall momentum of the chart: Bullish
Price could potentially make a bullish reaction off the pivot and rise towards the 1st resistance
Pivot: 39,201.33
Supporting reasons: This level acts as a pullback support, potentially initiating a bullish reversal if the level holds as support.
1st Support: 38,965.01
Supporting reasons: This level acts as a pullback support, indicating a level where price has found strong support in the past.
1st Resistance: 39,614.25
Supporting reasons: This level is identified as a pullback resistance, marking it as a critical threshold for bullish momentum to overcome; resistance at this level could cap further upside movements.
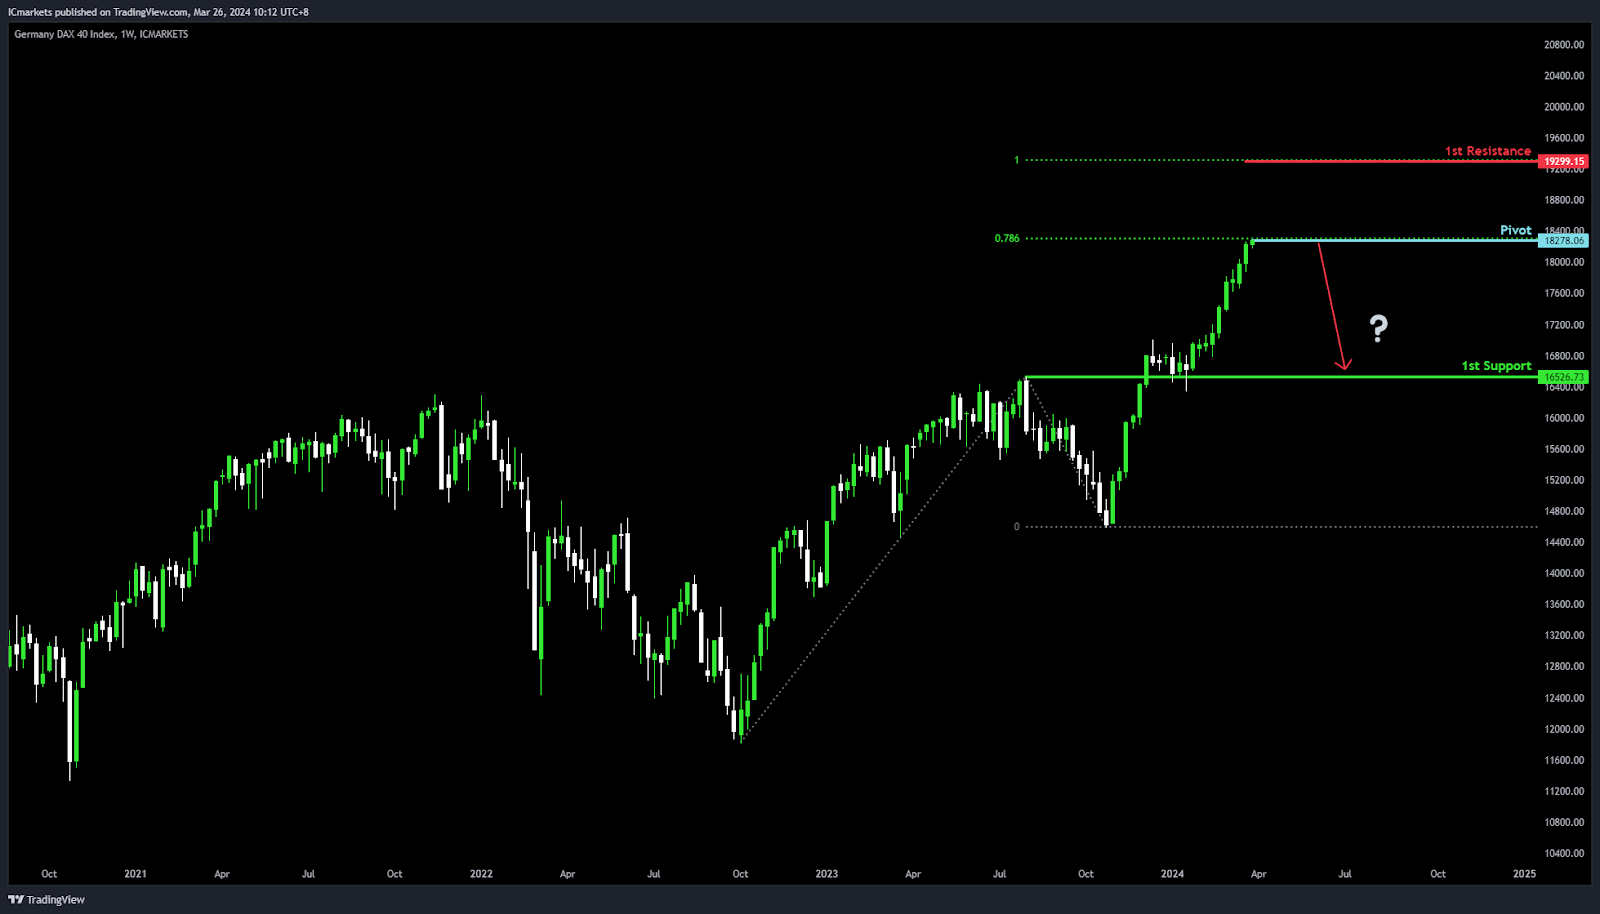
GER40:
Potential Direction: Weak Bearish
Overall momentum of the chart: Bullish
Price could potentially rise toward the pivot to make a bearish reaction and then drop towards the 1st support.
Pivot: 18,278.06
Supporting reasons: This level acts as a pullback resistance that aligns with a 78.60% Fibonacci projection, potentially initiating a bearish reversal if the level holds as resistance.
1st Support: 16,526.73
Supporting reasons: This level acts as an overlap support, indicating a level where price has found strong support in the past.
1st Resistance: 19,299.15
Supporting reasons: This level is identified as a resistance level that aligns with a 100.00% Fibonacci projection, marking it as a critical threshold for bullish momentum to overcome; resistance at this level could cap further upside movements.
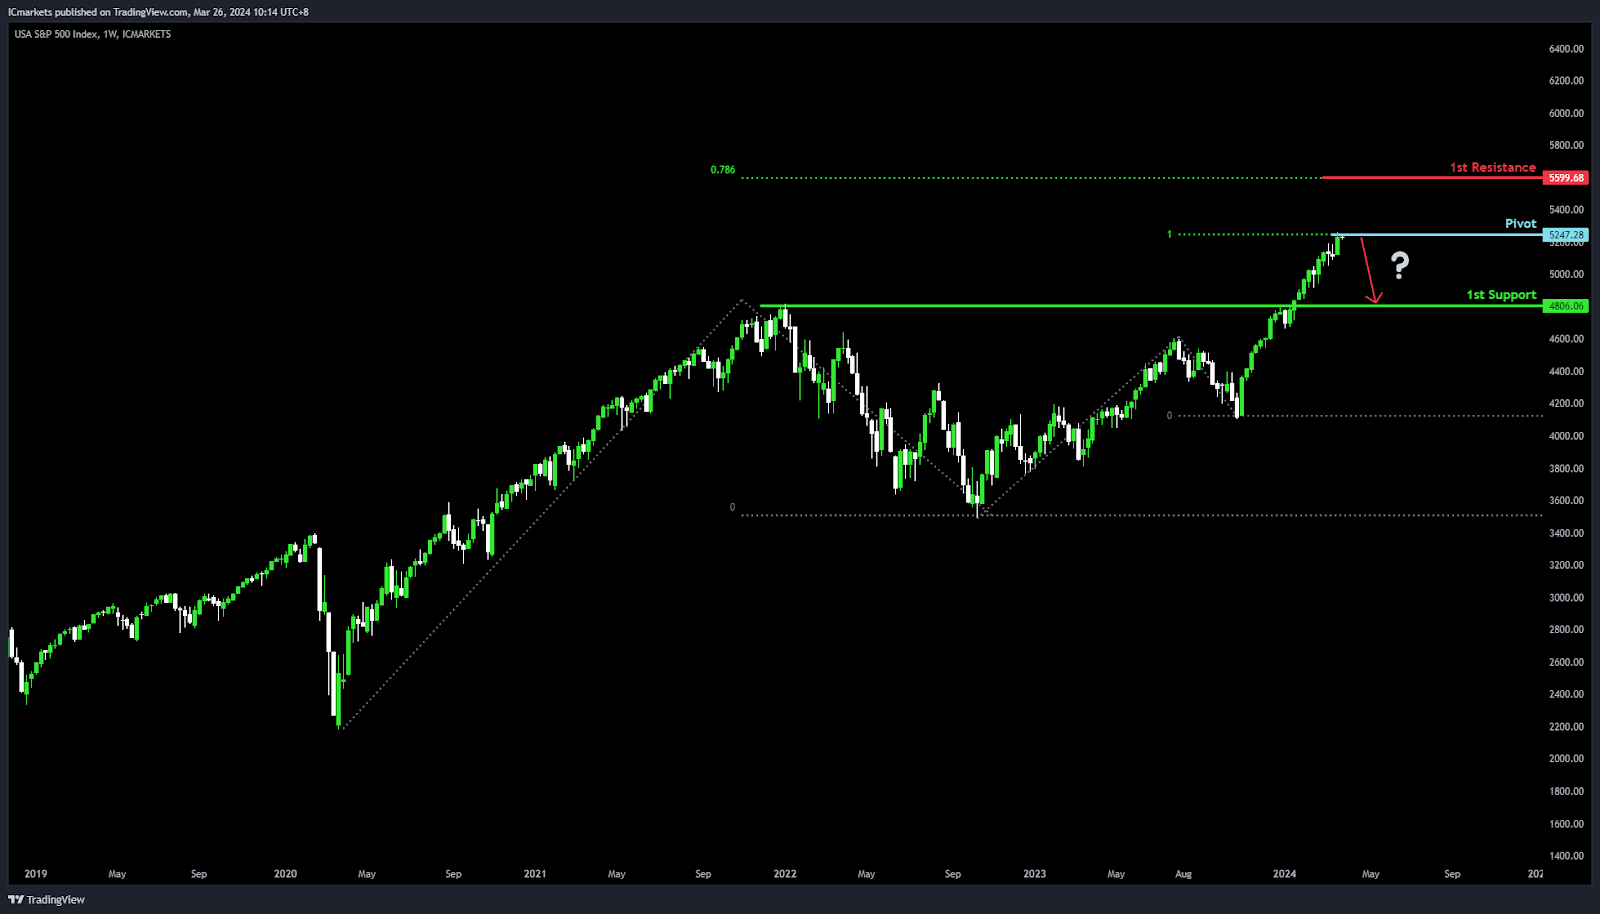
US500:
Potential Direction: Weak Bearish
Overall momentum of the chart: Bullish
Price could potentially rise toward the pivot to make a bearish reaction and then drop towards the 1st support.
Pivot: 5,247.28
Supporting reasons: This level acts as a pullback resistance that aligns with a 100.00% Fibonacci projection, potentially initiating a bearish reversal if the level holds as resistance.
1st Support: 4,806.06
Supporting reasons: This level acts as a pullback support, indicating a level where price has found strong support in the past.
1st Resistance: 5,599.68
Supporting reasons: This level is identified as a resistance level that aligns with a 78.60% Fibonacci projection, marking it as a critical threshold for bullish momentum to overcome; resistance at this level could cap further upside movements.
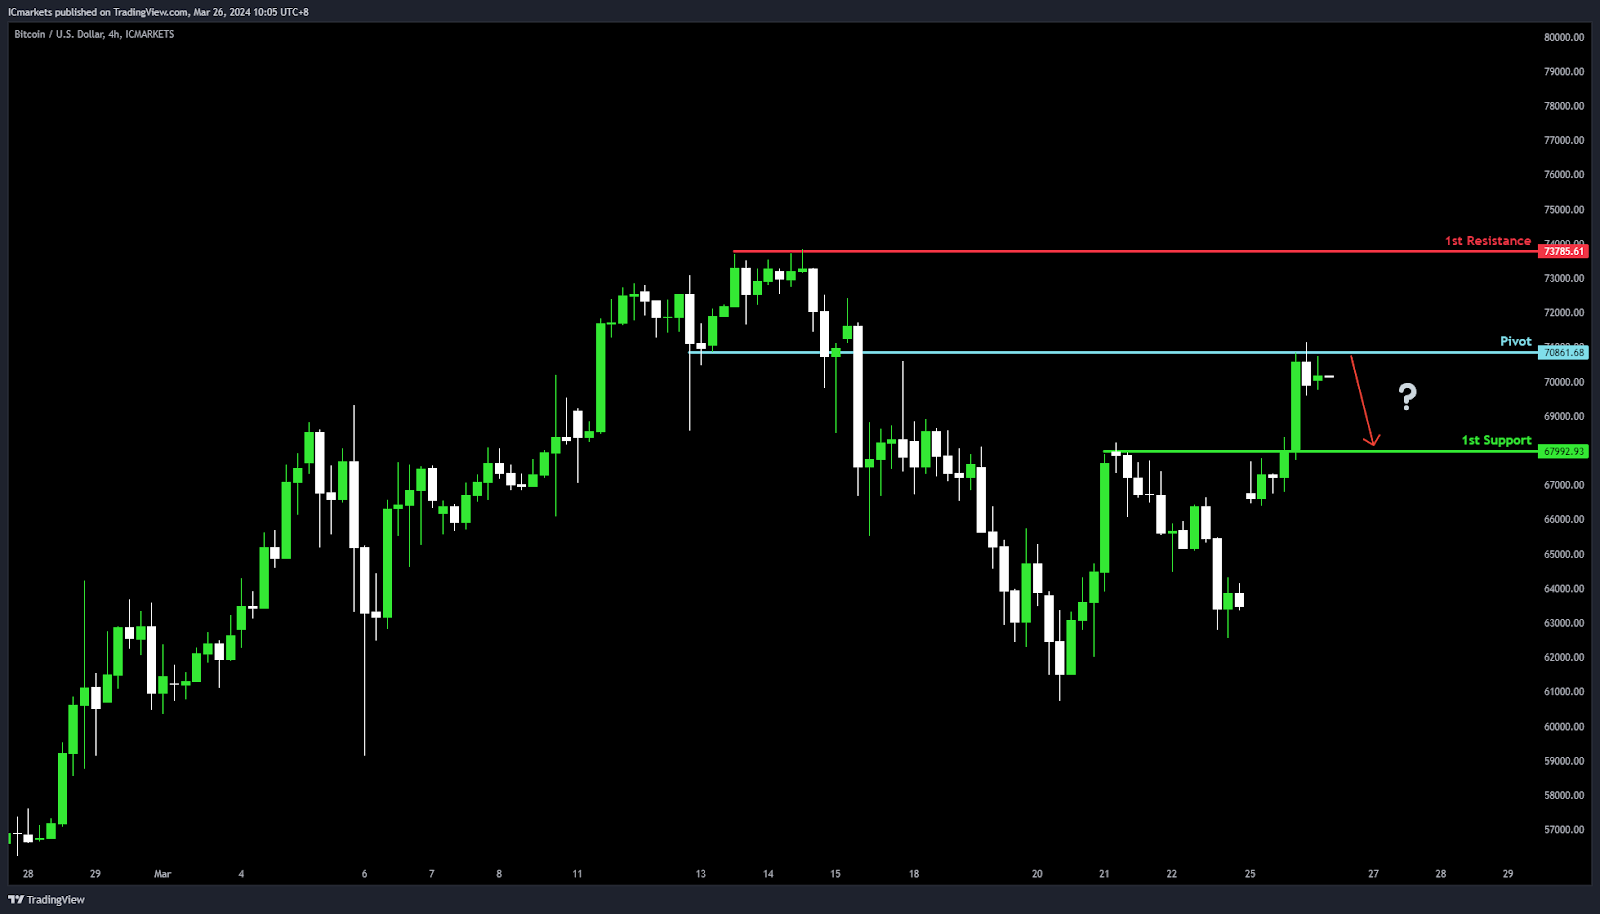
BTC/USD:
Potential Direction: Weak Bearish
Overall momentum of the chart: Bullish
Price could potentially rise toward the pivot to make a bearish reaction and then drop towards the 1st support.
Pivot: 70,861.68
Supporting reasons: This level acts as an overlap resistance, potentially initiating a bearish reversal if the level holds as resistance.
1st Support: 67,992.93
Supporting reasons: This level acts as a pullback support, indicating a level where price has found strong support in the past.
1st Resistance: 73,785.61
Supporting reasons: This level is identified as a swing-high resistance at the all-time high marking it as a critical threshold for bullish momentum to overcome; resistance at this level could cap further upside movements.
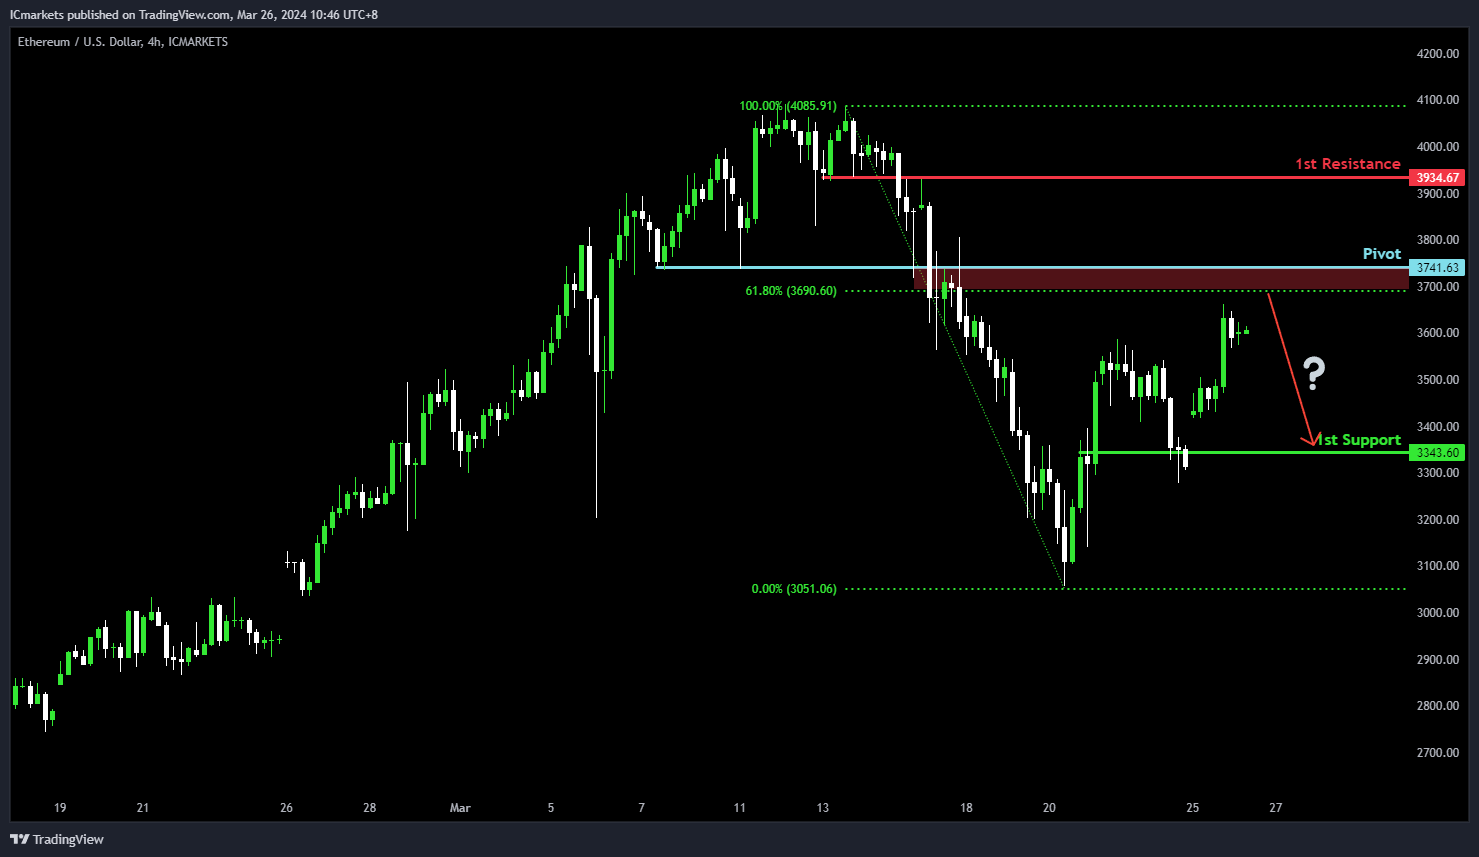
ETH/USD:
Potential Direction: Weak Bearish
Overall momentum of the chart: Bullish
Price could potentially rise toward the pivot to make a bearish reaction and then drop towards the 1st support.
Pivot: 3,741.63
Supporting reasons: This level acts as an overlap resistance that aligns close to a 61.80% Fibonacci retracement, potentially initiating a bearish reversal if the level holds as resistance.
1st Support: 3,343.60
Supporting reasons: This level acts as a pullback support, indicating a level where price has found strong support in the past.
1st Resistance: 3,934.64
Supporting reasons: This level is identified as an overlap resistance, aligning close to a 50.00% Fibonacci retracement, marking it as a critical threshold for bullish momentum to overcome; resistance at this level could cap further upside movements.
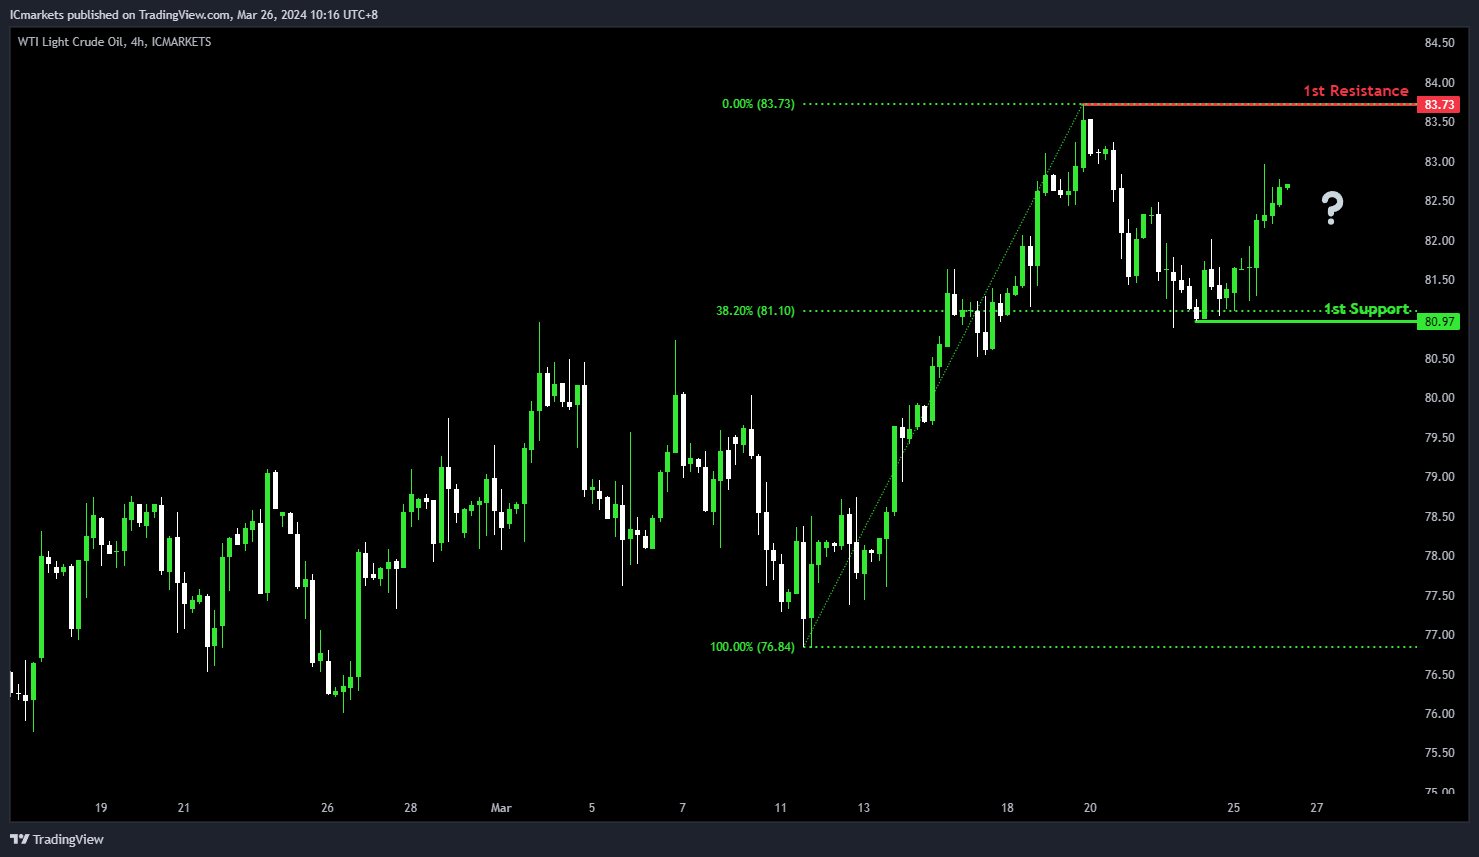
WTI/USD (Oil):
Potential Direction: Medium Bullish
Overall momentum of the chart: Neutral
Price could potentially make a bullish rise towards the 1st resistance.
1st Support: 80.97
Supporting reasons: This level acts as a pullback support that aligns with a 38.20% Fibonacci retracement, indicating a level where price has found strong support in the past.
1st Resistance: 83.73
Supporting reasons: This level is identified as a swing-high resistance, marking it as a critical threshold for bullish momentum to overcome; resistance at this level could cap further upside movements.
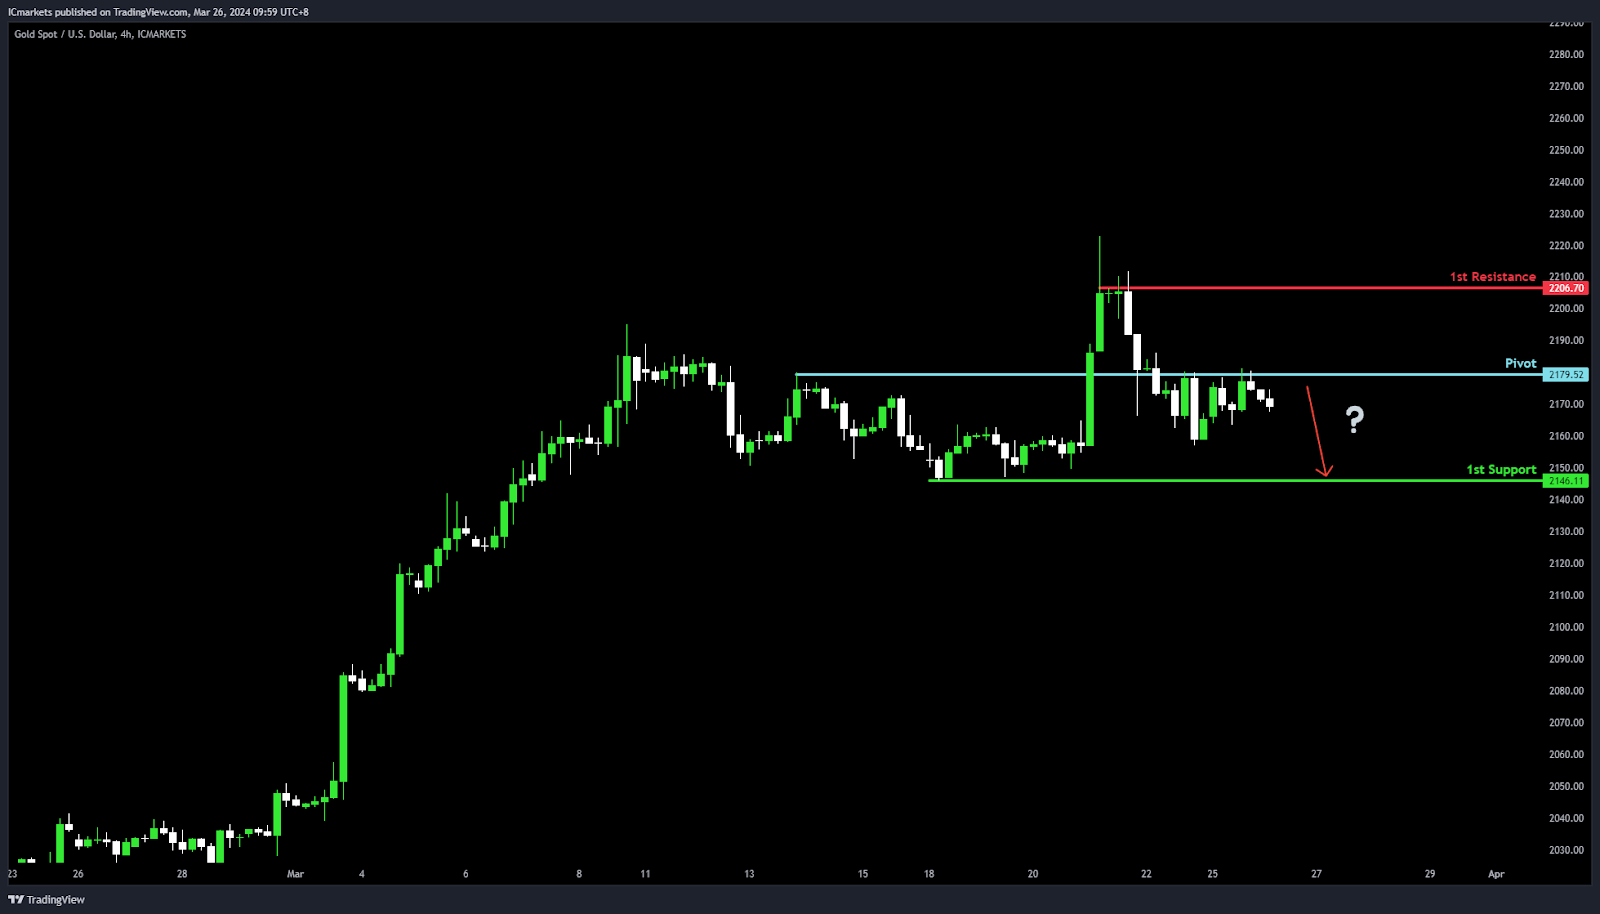
XAU/USD (GOLD):
Potential Direction: Bearish
Overall momentum of the chart: Bullish
Price could potentially make a bearish continuation towards 1st support
Pivot: 2179.52
Supporting reasons: Serves as an Overlap resistance, a key point where sellers could start to push prices down, showing it’s an important spot for possible changes in how the price moves.
1st support: 2146.11
Supporting reasons: Identified as Multi-swing low support, marking a key level where the market has previously found a foundation for rebounds, indicating its pivotal role in halting bearish momentum
1st resistance: 2206.70
Supporting reasons: Characterized by Multi-swing high resistance, highlighting a major barrier that has historically limited upward movements, positioning it as an essential threshold for bulls to breach in order to resume the bullish trend
The accuracy, completeness and timeliness of the information contained on this site cannot be guaranteed. IC Markets does not warranty, guarantee or make any representations, or assume any liability regarding financial results based on the use of the information in the site.
News, views, opinions, recommendations and other information obtained from sources outside of www.icmarkets.com, used in this site are believed to be reliable, but we cannot guarantee their accuracy or completeness. All such information is subject to change at any time without notice. IC Markets assumes no responsibility for the content of any linked site.
The fact that such links may exist does not indicate approval or endorsement of any material contained on any linked site. IC Markets is not liable for any harm caused by the transmission, through accessing the services or information on this site, of a computer virus, or other computer code or programming device that might be used to access, delete, damage, disable, disrupt or otherwise impede in any manner, the operation of the site or of any user’s software, hardware, data or property.


