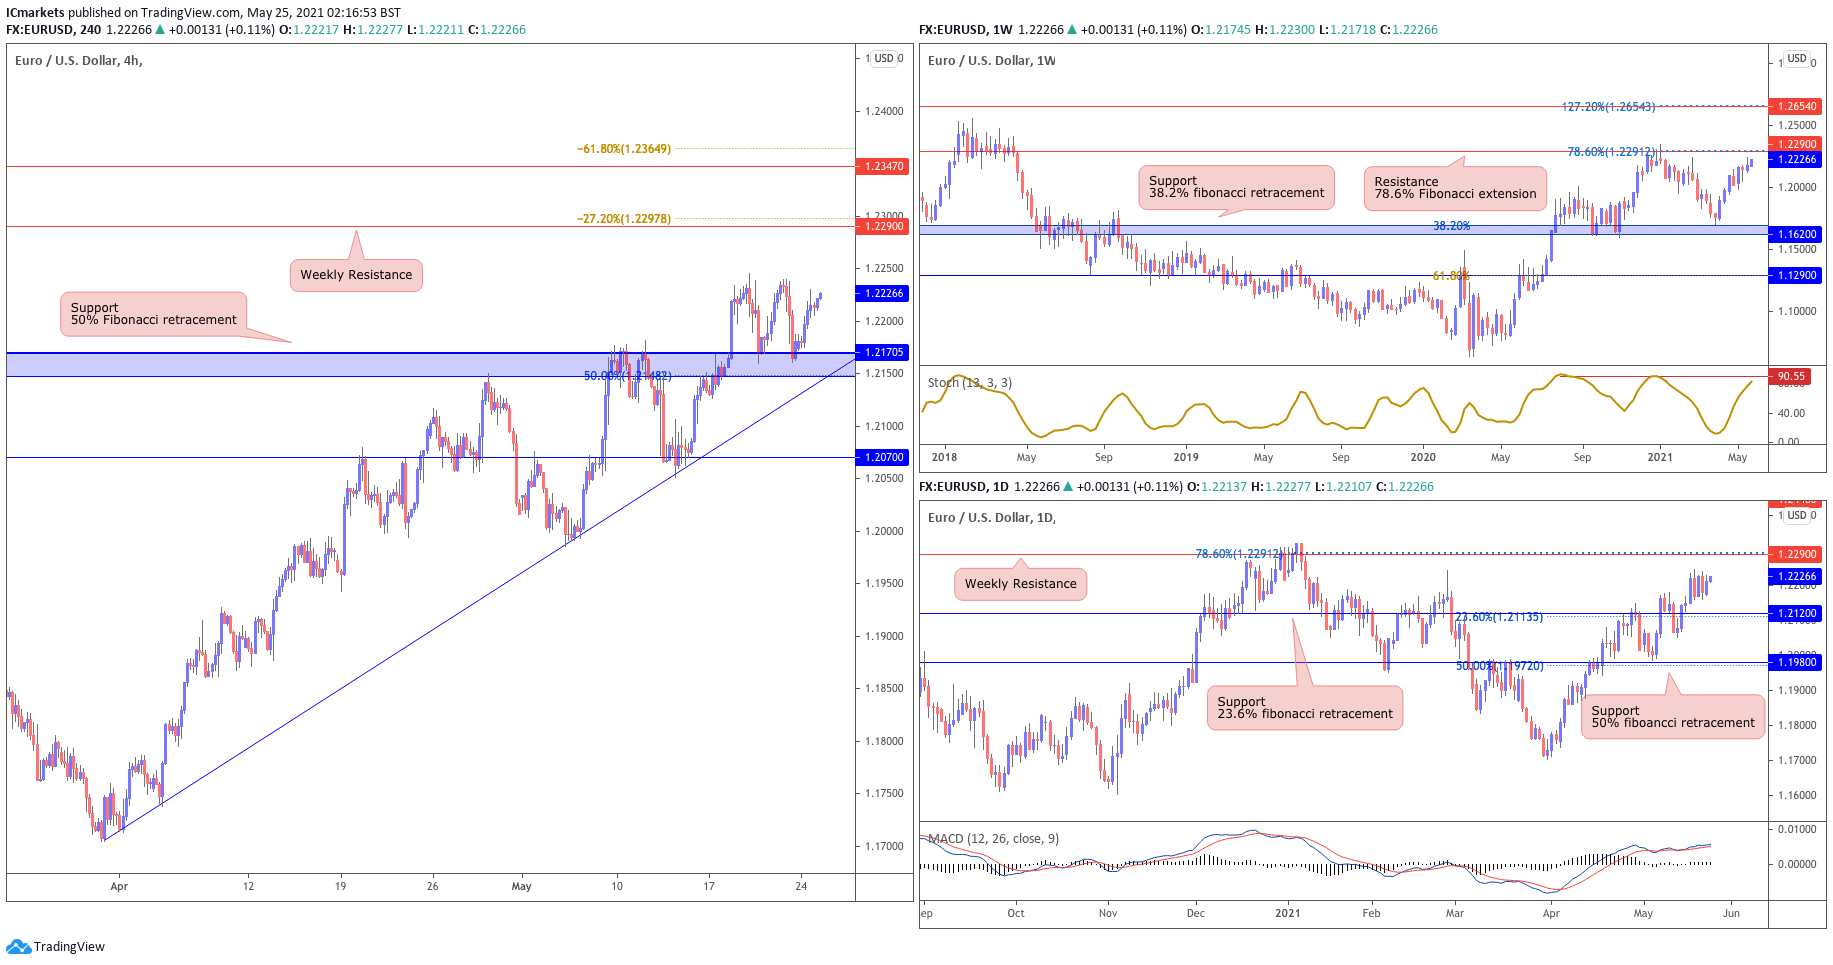
EUR/USD:
Looking at the weekly chart, we can see that prices are seeing further limited upside before it reaches our resistance area at 1.22900. On the daily chart, price is holding above support at 1.21200 where we could possibly see some bullish pressure with 1.22900 as our resistance target as well.
On the H4 timeframe, prices are facing bullish pressure from our support at 1.21705, in line with the ascending trend line and 50% fibonacci retracement where we could see a further upside above this level with 1.22900 as our first resistance target. Failure to hold above the 1.21705 support level could see a swing towards our next support target at 1.20700.
Areas of consideration:
- 1.22900 resistance area found on H4 time frame
- 1.21705 support area found on H4 time frame
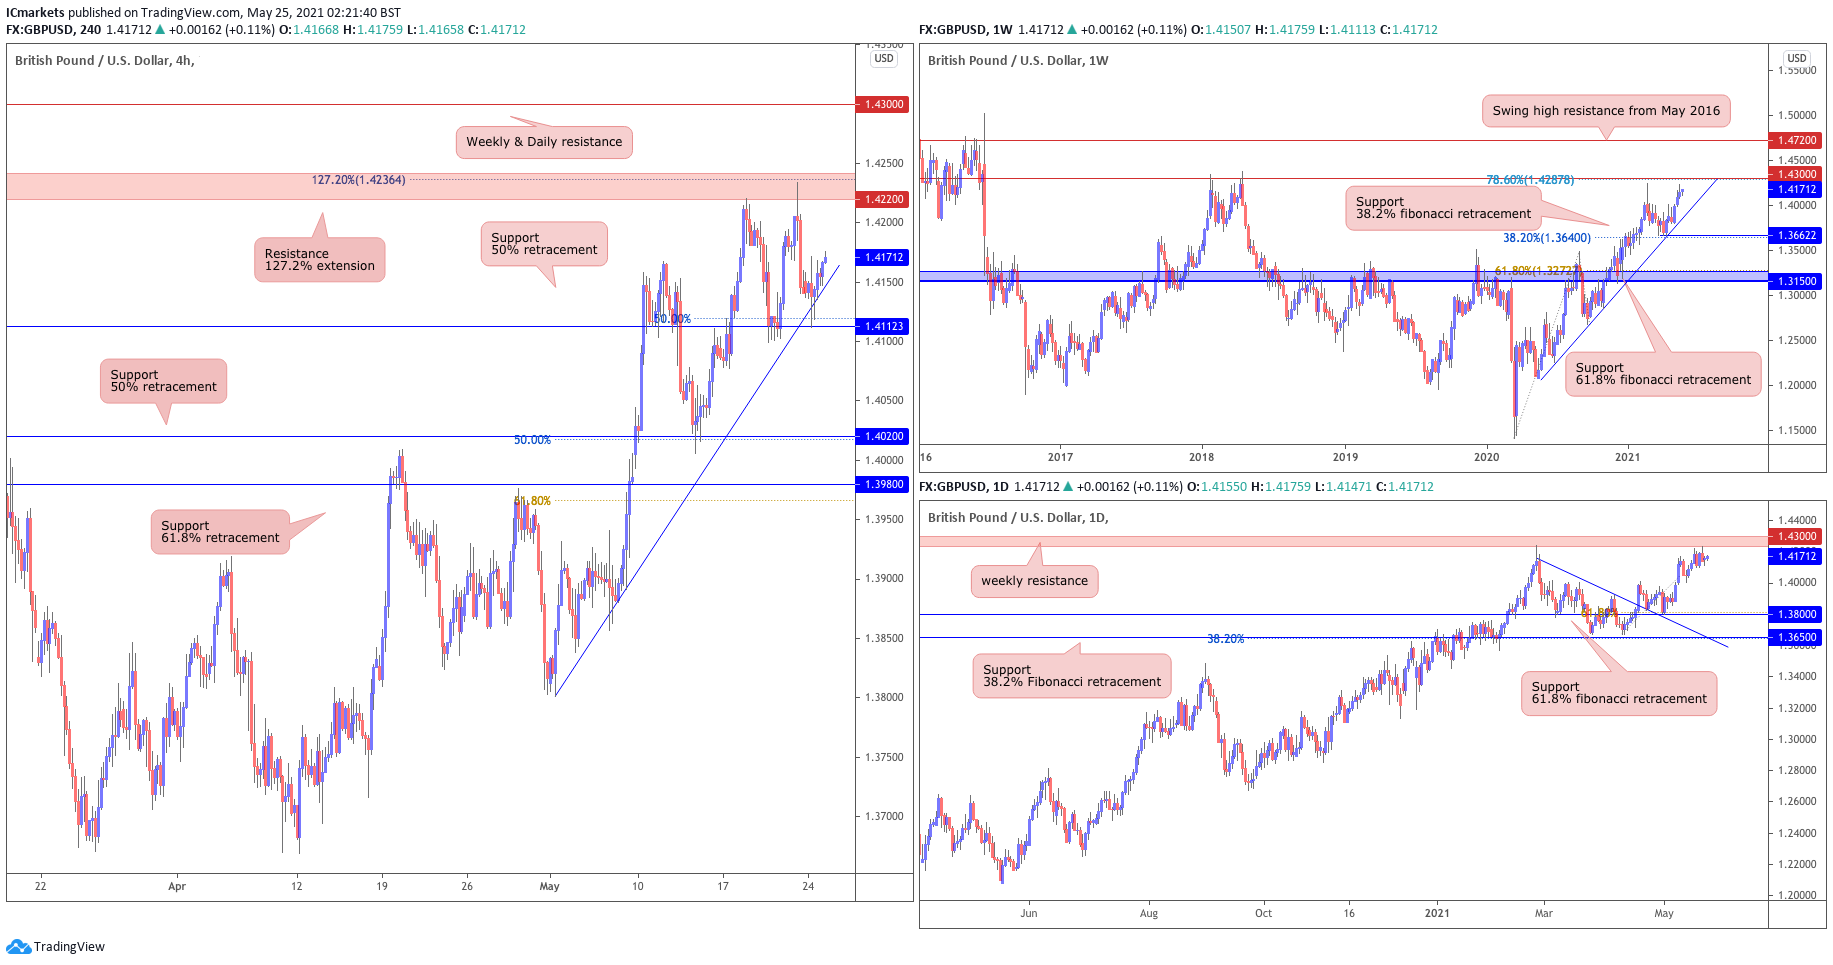
GBP/USD:
Looking at the weekly chart, we can see that prices are facing bullish pressure from our ascending trend line and support at 1.36622 where we could see a further upside above this level to our resistance target at 1.43000, in line with the 78.6% fibonacci extension. The daily time frame echoes the same bullish view as well where we could see a limited upside above our support level at 1.38000 with 1.43000 as our resistance target.
On the H4 timeframe, prices are facing bullish pressure from our support at 1.41123, in line with the 50% fibonacci retracement, horizontal swing low support and ascending trend line, where we could see a further upside above this level with 1.42200 as our resistance level. Failure to hold above our support level at 1.41123 could see price swing towards our next support target at 1.40200.
Areas of consideration:
- 1.42200 resistance area found on H4 time frame
- 1.41123 support area found on H4 timeframe
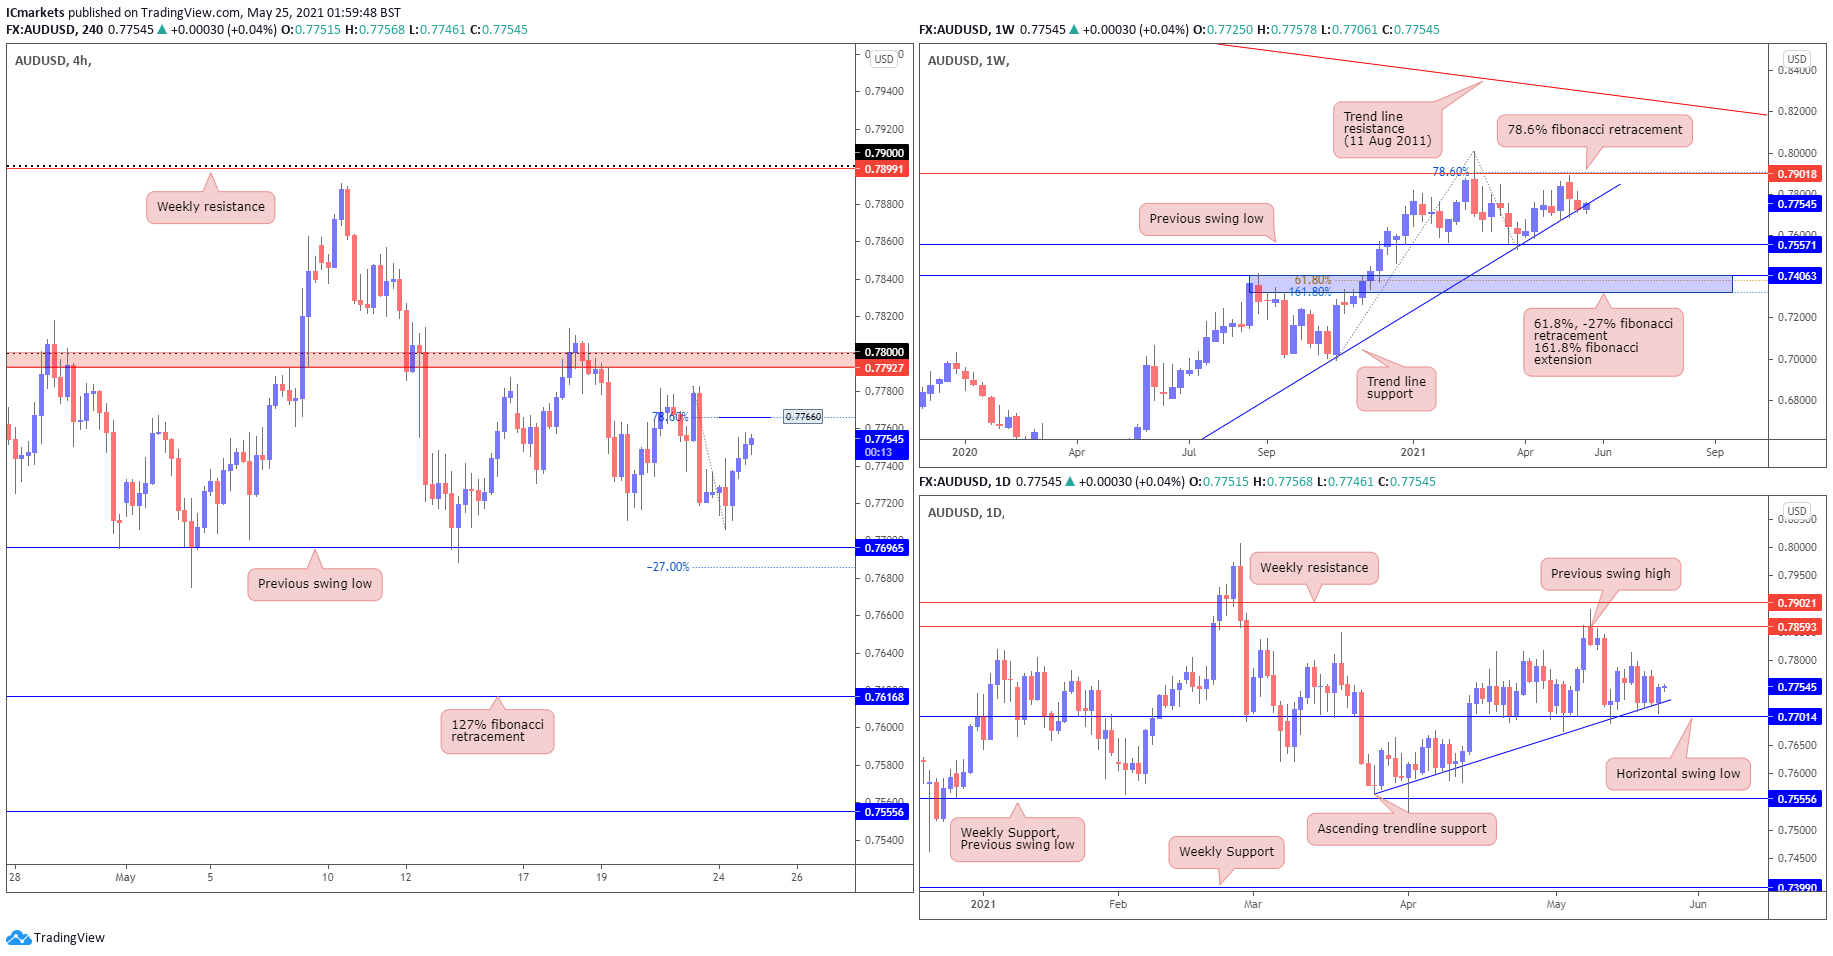
AUD/USD:
From the Weekly timeframe, we see price trending between the previous swing high in line with 78.6% fibonacci retracement, and the ascending trendline, which is currently being tested. From the daily timeframe, we see that price is holding above the ascending trendline and horizontal swing low. We may potentially see a breakout from this area before calling the next move from the bigger timeframes.
On the H4 timeframe, we are seeing price approaching the 0.77660 level, in line with 78.6% fibonacci retracement level where we may see a drop towards the previous swing low at 0.76965, in line with -27% fibonacci retracement level. Price has been making lower highs and lower lows, therefore, we may tap on the bigger support level before price continues its bullish momentum from the bigger time frame.
Areas of consideration:
- H4 timeframe, price may reverse from 0.7766 and drop towards 0.76965
- Daily and weekly time frames showing a test of the ascending trendline.
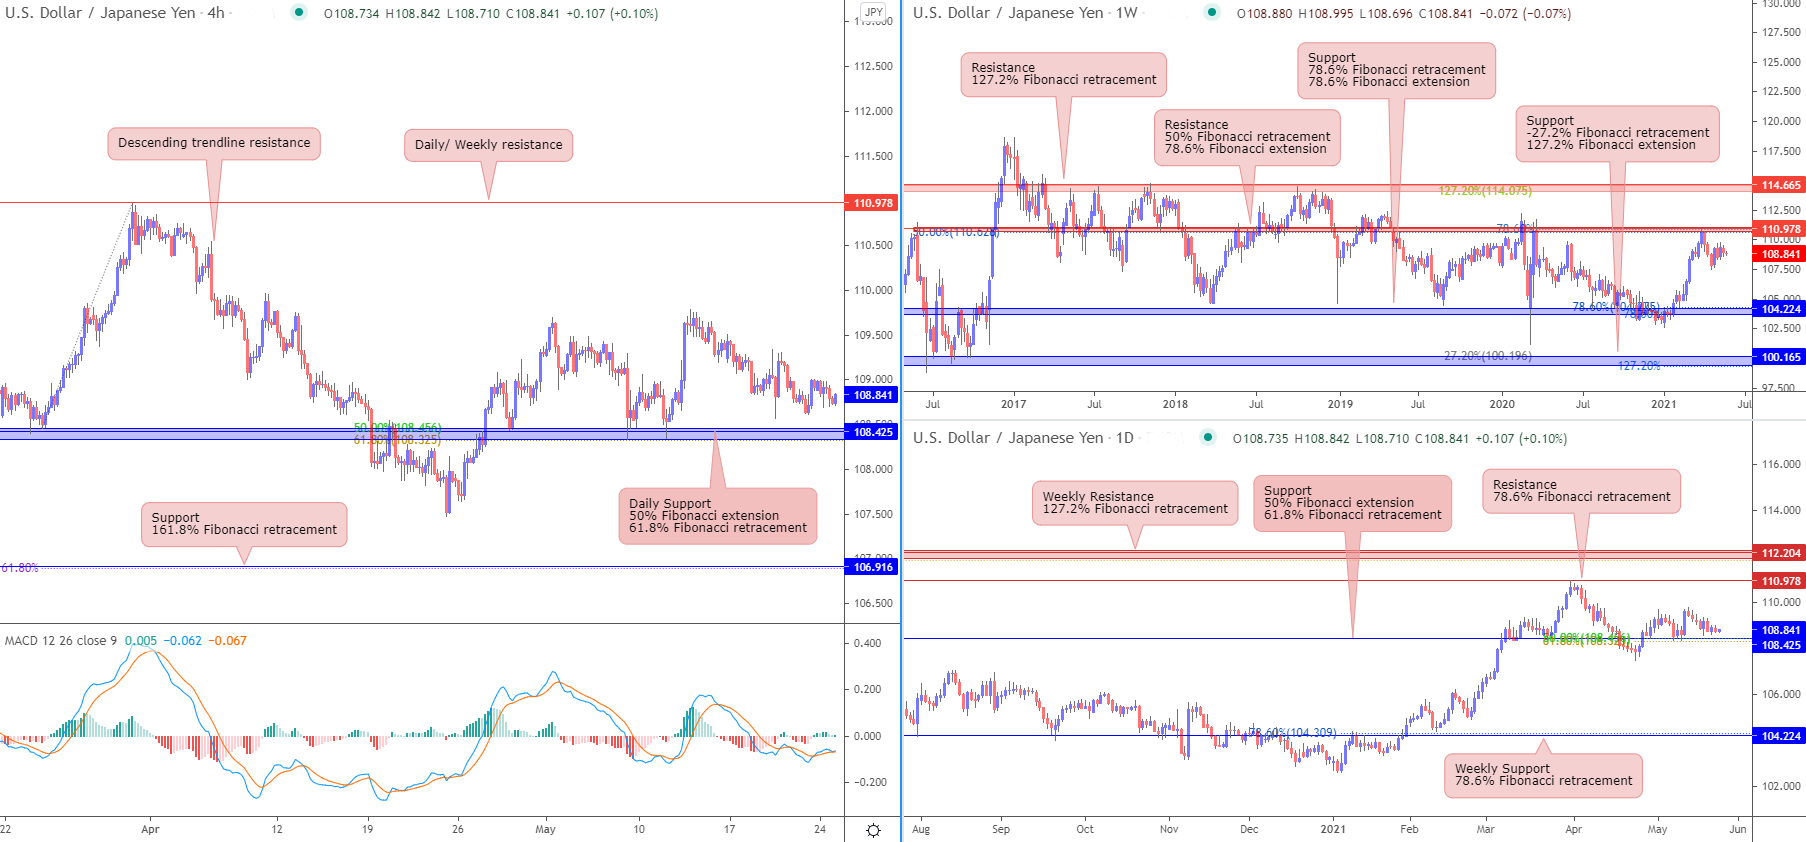
USD/JPY
From the weekly timeframe, prices are facing resistance from horizontal swing high resistance which coincides with 50% Fibonacci retracement and 78.6% Fibonacci extension, taking support from 104.224 level which is in line with 78.6% Fibonacci retracement and 78.6% Fibonacci extension. On the daily time frame, prices are facing support from 108.425 level which coincides with 61.8% Fibonacci retracement and 50% Fibonacci extension. Prices might bounce towards daily resistance level 110.978 in line with 78.6% Fibonacci retracement. Daily EMA is also below prices, showing a bullish pressure for prices.
On the H4 timeframe, prices might take support on 108.425 support level in line with 61.8% Fibonacci retracement and 50% Fibonacci extension. Prices might push up towards daily resistance level of 110.978. If prices did not push up further, prices could fall and take support on 106.916 level, in line with 161.8% Fibonacci retracement. MACD is also showing a crossover, giving a bullish pressure on prices.
Areas of consideration:
- On the H4, prices might push up towards 110.978 daily resistance level
- 108.425 support level on the H4 timeframe
- 108.425 support level on the daily timeframe
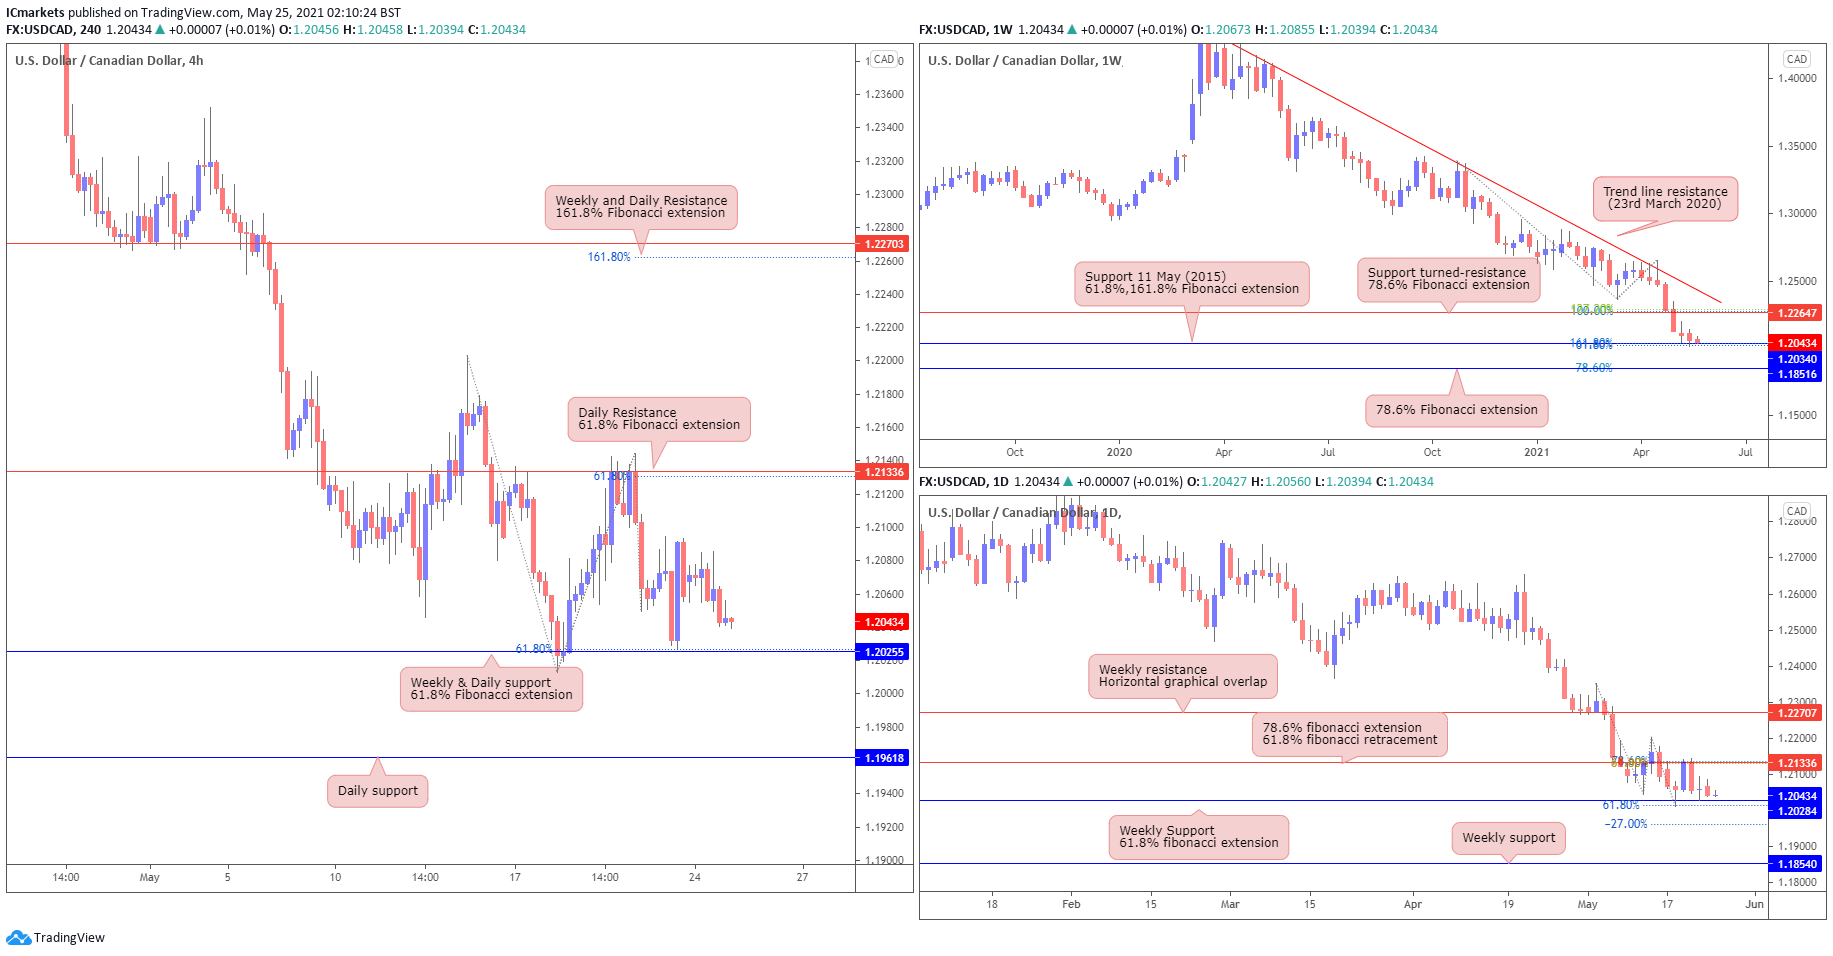
USD/CAD:
The weekly chart shows price testing the support level at 1.20340, in line with the 61.8%, 161.8% fibonacci extension and 11 May (2015). If price manages to break beneath this level, we may see a swing towards the 1.18516 level, in line with 78.6% fibonacci extension. In the daily time frame, we can see price reversed from the 61.8% fibonacci retracement, where we may see a push towards the -27% fibonacci level at 1.19619. Currently price still has to break beneath the Weekly support and 61.8% fibonacci extension level at 1.20446.
The H4 timeframe shows price creating lower highs and lower low, we are currently waiting for price to break beneath the 1.20255 level, in line with Weekly and daily support, 61.8% fibonacci extension, and horizontal swing low support.
Areas of consideration:
- The weekly and daily time frame shows a test in the support level where it may continue its bearish momentum.
- On H4, price may break past 1.20255 towards 1.19618
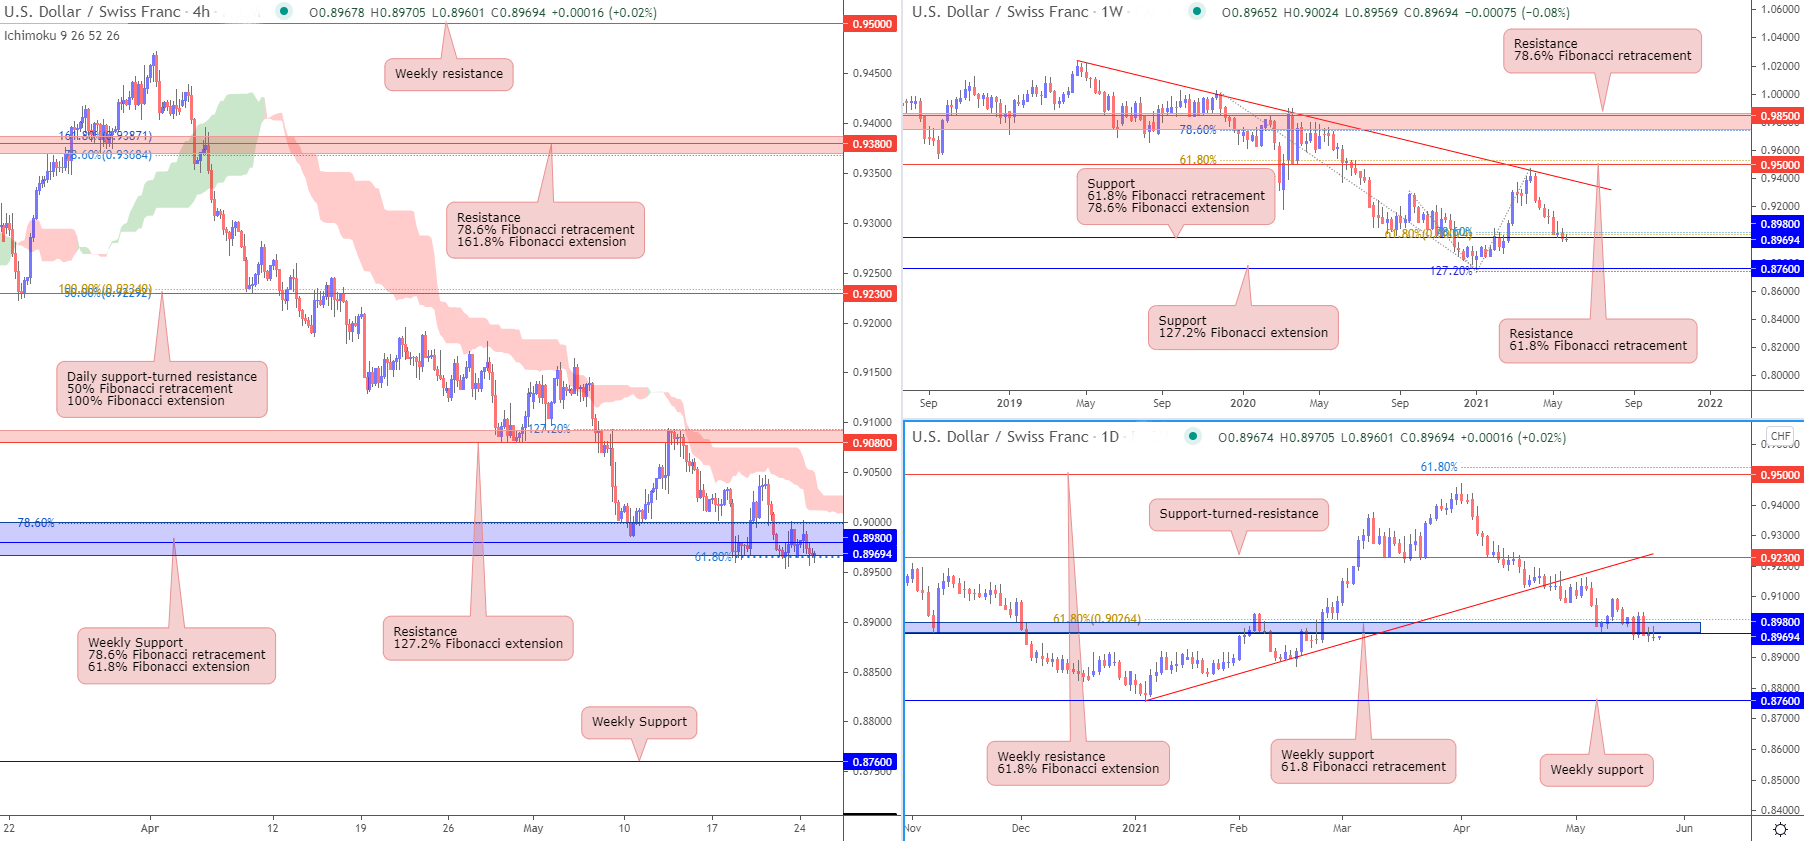
USD/CHF:
USD/CHF is now testing the weekly 0.89800 support, in line with 61.8% Fibonacci retracement and 78.6% Fibonacci extension. The daily chart shows that price is now holding below the key daily 0.92300 support-turned-resistance, and has also broken below the ascending trendline support-turned-resistance. The weekly 0.89800 support level is a key level to watch.
On the H4 chart, we can see that price continues to make sideways movement as it is now retesting the weekly 0.89800 support level, in line with 78.6% Fibonacci retracement and 61.8% Fibonacci extension. We also note that price is holding below the Ichimoku cloud resistance, showing bearish pressure in line with our analysis. In this scenario, a break and close below the key 0.89800 support would see price swing towards the next weekly 0.87600 support level. Otherwise, price could also pull back to retest the Ichimoku cloud resistance before pushing lower.
Areas of consideration:
- The 0.89800 weekly support is a key intraday level to watch as price makes a sideways movement.
- Price is facing bearish pressure as it holds below the Ichimoku cloud resistance.
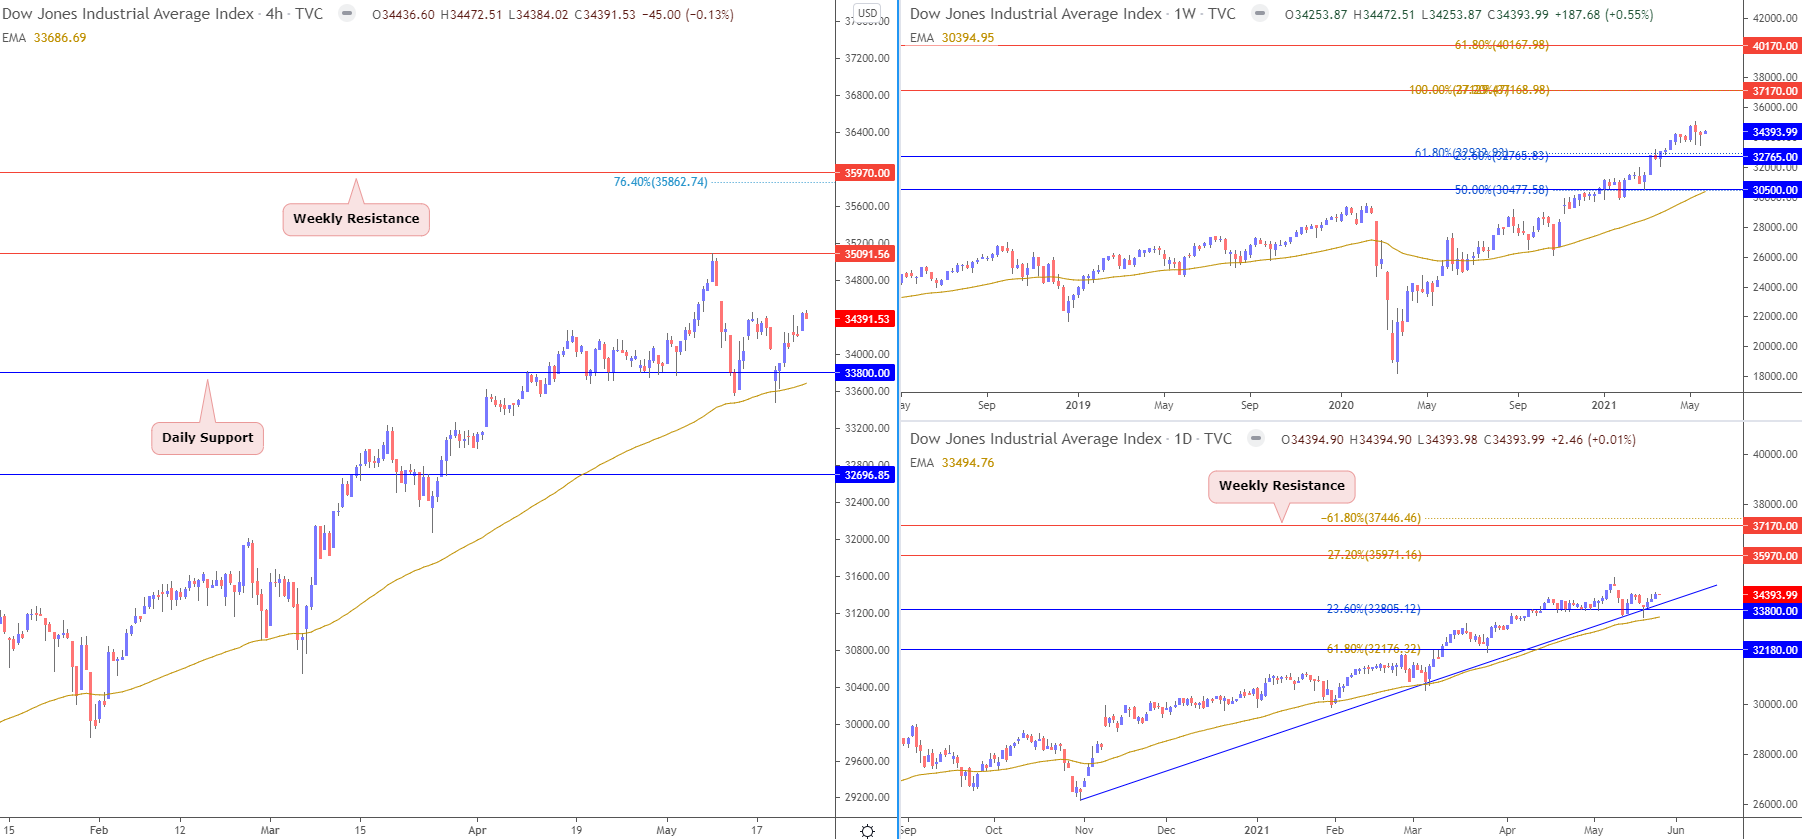
Dow Jones Industrial Average:
On the weekly chart, price traded sideways. With price holding above the long term moving average, we can expect further bullish pressure above 32765 support. On the daily chart, price pulled back lower and reacted above moving average and also above ascending trendline support. Buyers added to their longs and a bounce can be seen at the 33800 level as prices push up to daily resistance level of 35970, all the while trading above the daily EMA.
On the H4, prices bounced up from the 33800 support. We see a medium probability bullish scenario where buyers could add to their longs with a limited upside push above 33800 support towards 35090 resistance. We should see a short term push up towards 35091 level. If prices swing the other way, we could see it taking support from 32696 level.
Areas of consideration:
- Technical indicators across all timeframes confirm bullish momentum
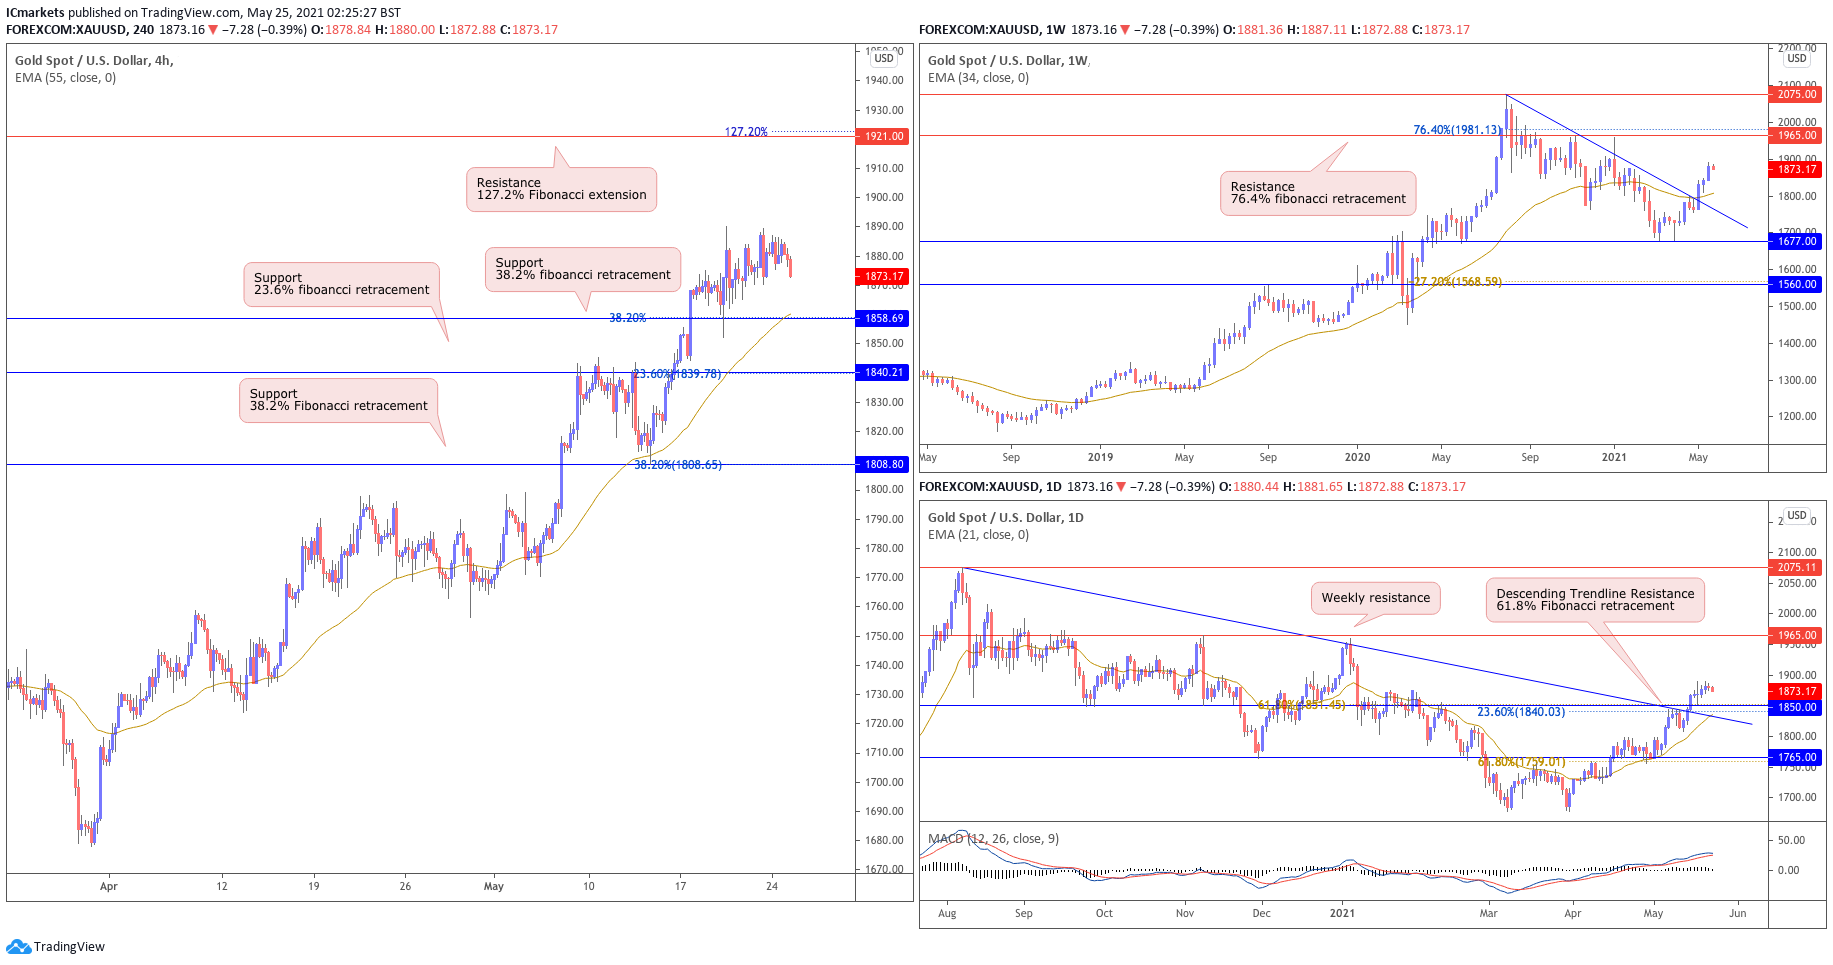
XAU/USD (GOLD):
On the weekly timeframe, prices are facing bullish pressure and could see a further upside, with 1965 as the weekly resistance target. We could see renewed bullish pressure this coming week. On the daily, price broke and closed above descending trendline resistance (now support). There is now a greater probability of a bullish scenario above 1850 support with much room towards 1965 resistance. Otherwise, a break below 1850 support will see price re-intergrate previous trend.
On the H4, price is approaching our support at 1858.69, in line with the 38.2% fibonacci retracement where we could see a further upside above this level, with 1921 as our resistance target. Failure to hold above the 1858.96 support could see a swing towards our next support target at 1840.21, in line with the 23.6% fibonacci retracement.
Areas of consideration:
- 1858.69 support level on the H4 time frame
- 1921 resistance level on the H4 time frame