
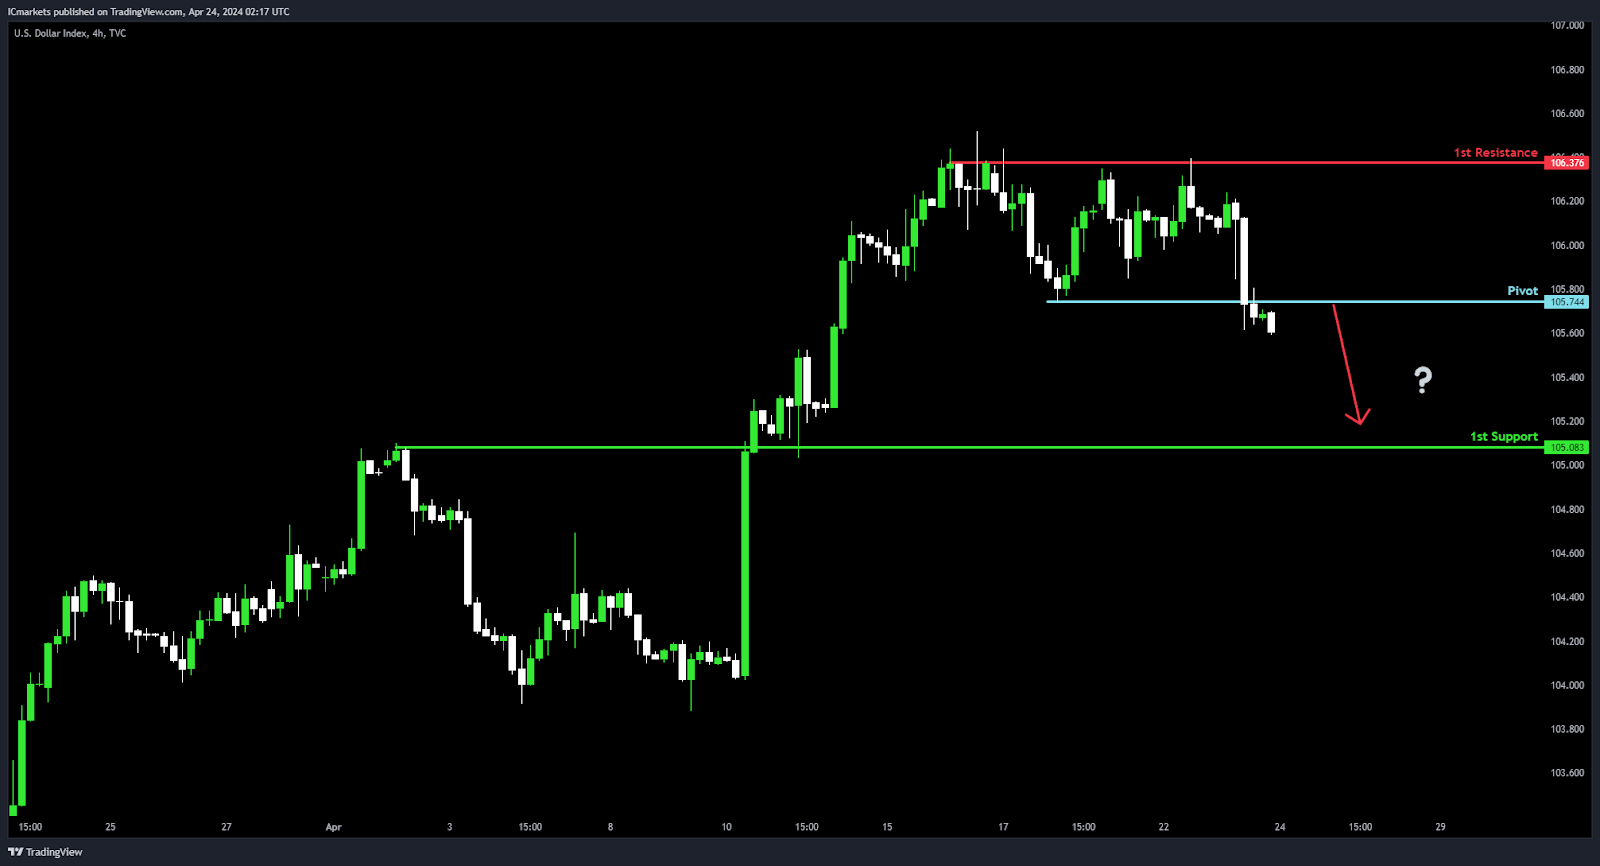
DXY (US Dollar Index):
Potential Direction: Bearish
Overall momentum of the chart: Bearish
Price could potentially make a bearish continuation towards 1st support.
Pivot: 105.74
Supporting reasons: An Overlap resistance, indicating a level where selling pressure might intensify, potentially leading to a continuation of the bearish momentum.
1st support: 105.08
Supporting reasons: An Overlap support, suggesting a level where buyers might step in to support the price, potentially providing a temporary halt or bounce in the bearish movement.
1st resistance: 106.37
Supporting reasons: Multi-swing high resistance, representing a level where selling pressure might increase, potentially acting as a barrier to further upside movement within the context of the overall bearish trend.
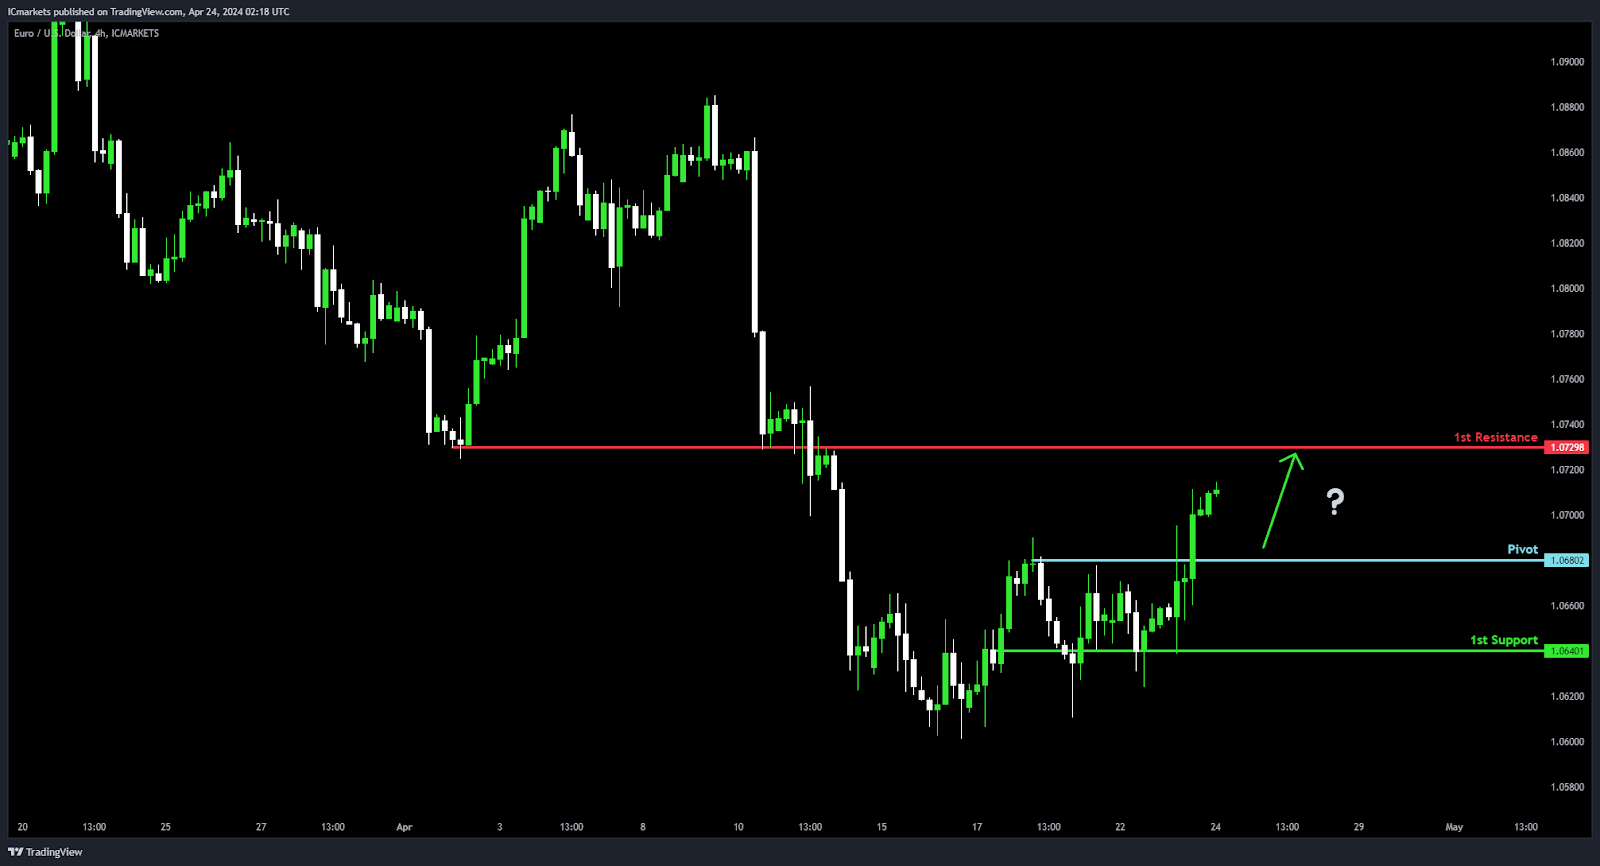
EUR/USD:
Potential Direction: Bullish
Overall momentum of the chart: Bullish
Price could potentially make a bullish bounce off pivot and head towards 1st resistance.
PIvot: 1.0680
Supporting reasons: Pullback support, indicating a level where buying interest might emerge, potentially providing a foundation for a bounce in the bullish movement.
1st support: 1.0640
Supporting reasons: An Overlap support, suggesting a level where buyers have previously stepped in to support the price, potentially acting as a foundation for further upward movement.
1st resistance: 1.0729
Supporting reasons: An Overlap resistance, representing a level where selling pressure might intensify, potentially acting as a barrier to further upside movement.
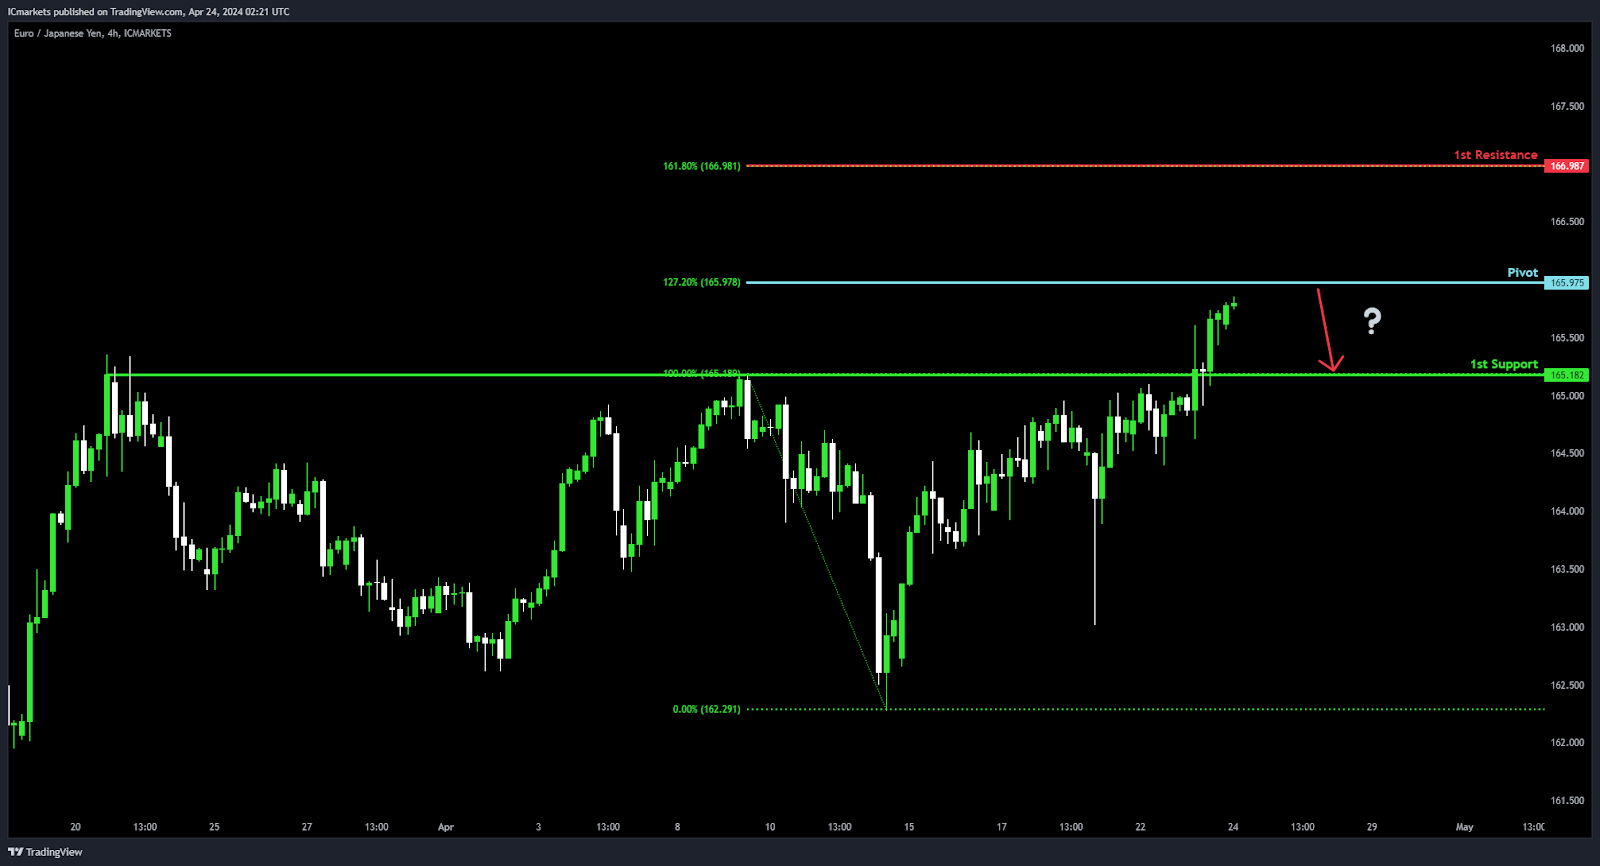
EUR/JPY:
Potential Direction: Bearish
Overall momentum of the chart: Bullish
Price could potentially make a bearish reaction off pivot and drop to 1st support.
Pivot: 165.97
Supporting reasons: 127.20% Fibonacci Extension level, indicating a significant level where selling pressure might intensify, potentially leading to a reversal or continuation of the bullish momentum.
1st support: 165.18
Supporting reasons: Pullback support, representing a level where buyers might step in to support the price, potentially providing a foundation for a bounce or temporary halt in the upward movement.
1st resistance: 166.98
Supporting reasons: 161.80% Fibonacci Extension level, suggesting a level where selling pressure might increase, potentially acting as a barrier to further upside movement within the context of the overall bullish trend.
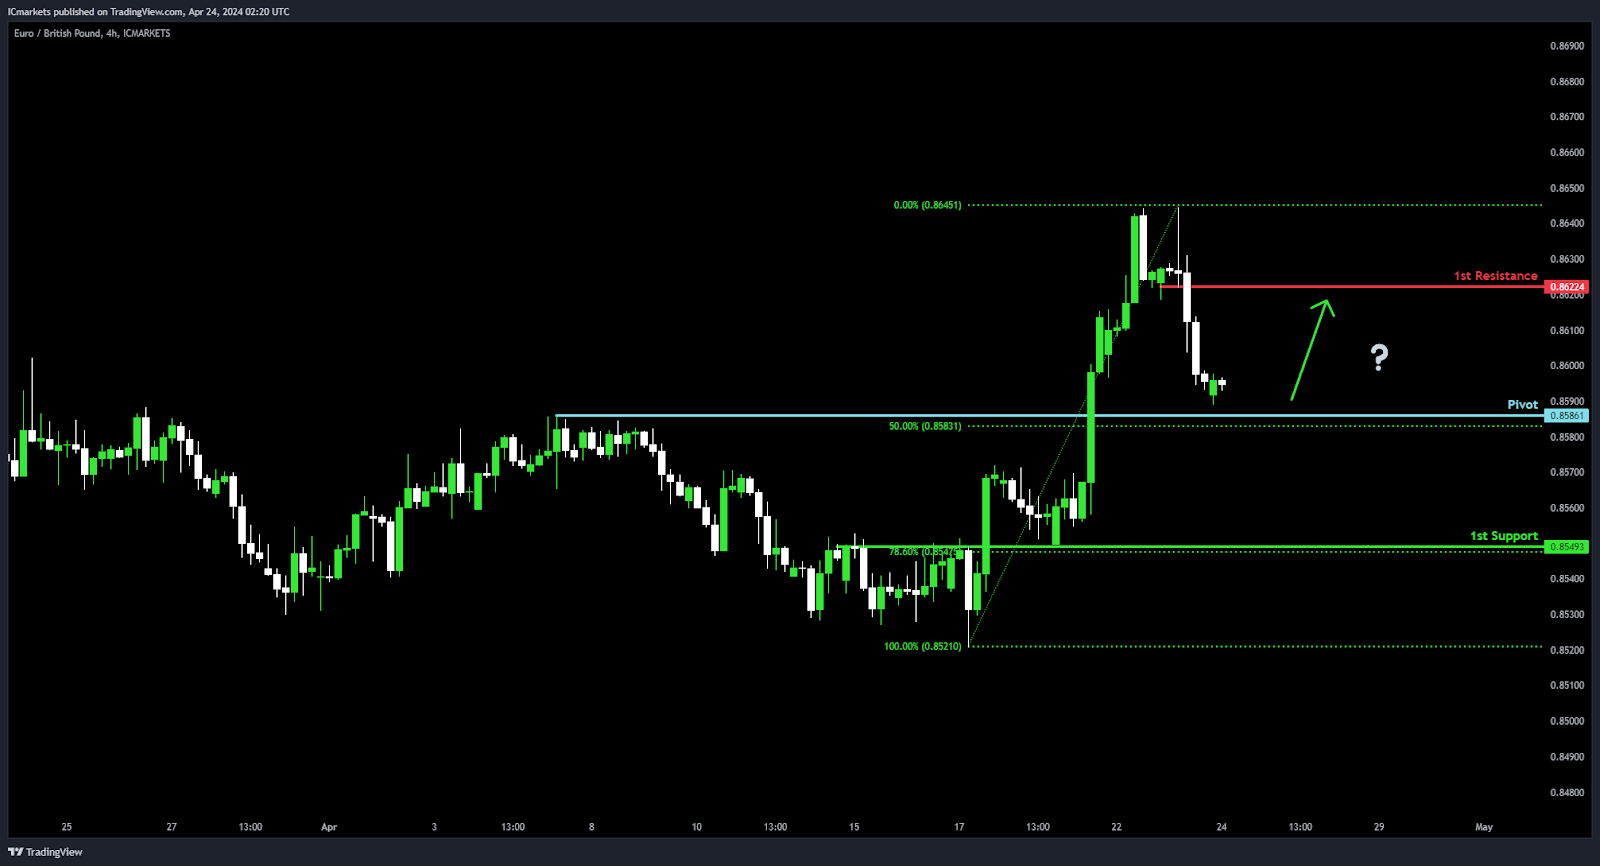
EUR/GBP:
Potential Direction: Bullish
Overall momentum of the chart: Bullish
Price could potentially make a bullish bounce off pivot and head towards 1st resistance.
Pivot: 0.8586
Supporting reasons: Pullback support combined with the 50% Fibonacci Retracement level, indicating a significant level where buyers might step in to support the price, potentially providing a foundation for a bounce or continuation of the bullish momentum.
1st support: 0.8549
Supporting reasons: An Overlap support combined with the 78.60% Fibonacci Retracement level, suggesting a level where buyers have previously intervened to support the price, potentially acting as a foundation for further upward movement.
1st resistance: 0.8622
Supporting reasons: Pullback resistance, representing a level where selling pressure might intensify, potentially acting as a barrier to further upward movement.
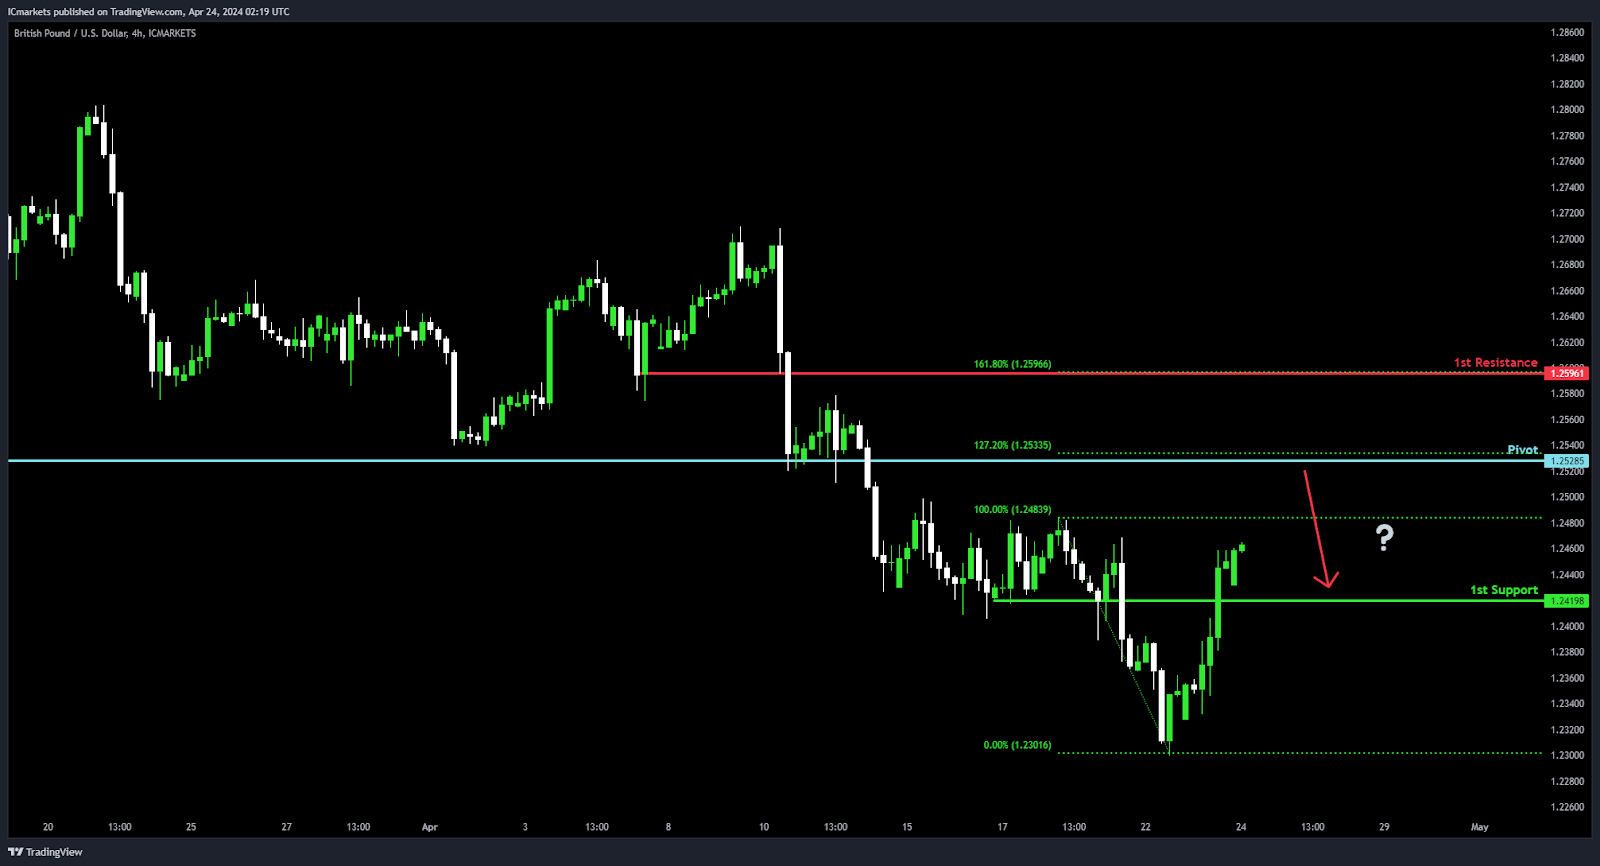
GBP/USD:
Potential Direction: Bearish
Overall momentum of the chart: Bullish
Price could potentially make a bearish reaction off pivot and drop to 1st support.
Pivot: 1.2528
Supporting reasons: Pullback resistance combined with the 127.20% Fibonacci Extension, indicating a significant level where selling pressure might intensify, potentially leading to a reversal or continuation of the bullish momentum.
1st support: 1.2419
Supporting reasons: Pullback support, suggesting a level where buyers might step in to support the price, potentially providing a foundation for a bounce or temporary halt in the downward movement.
1st resistance: 1.2596
Supporting reasons: Pullback resistance combined with the 161.80% Fibonacci Extension, representing a level where selling pressure might increase, potentially acting as a barrier to further upside movement within the context of the overall bullish trend.
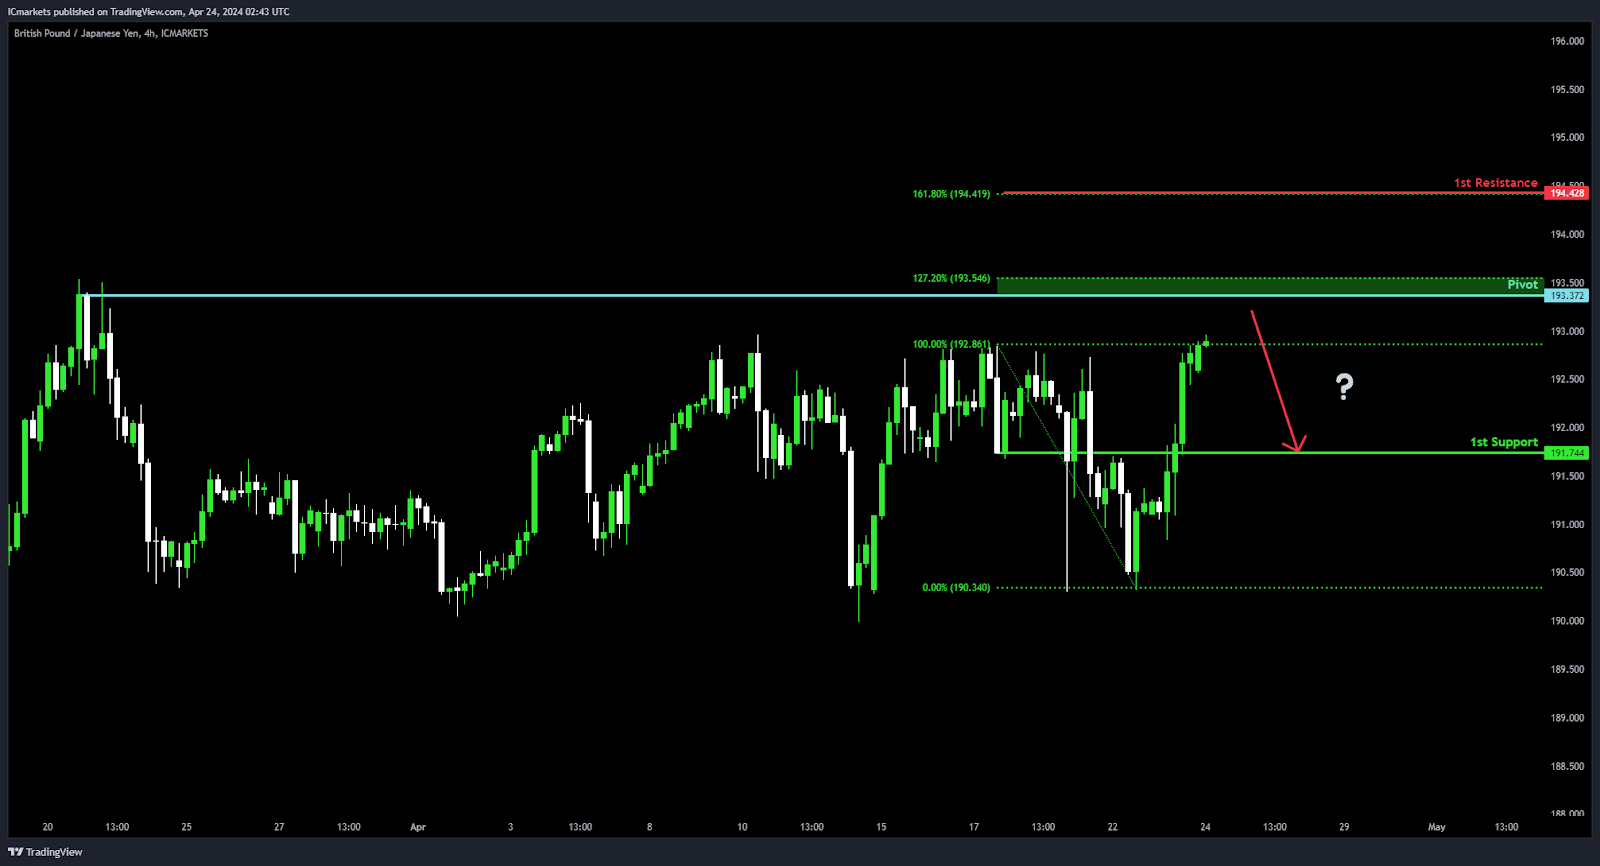
GBP/JPY:
Potential Direction: Bearish
Overall momentum of the chart: Bearish
Price could potentially make a bearish reaction off pivot and drop to 1st support.
Pivot: 193.37
Supporting reasons: Multi-swing high resistance combined with the 127.20% Fibonacci Extension, indicating a significant level where selling pressure might intensify, potentially leading to a reversal or continuation of the bearish momentum.
1st support: 191.74
Supporting reasons: Pullback support, suggesting a level where buyers might step in to support the price, potentially providing a foundation for a bounce or temporary halt in the downward movement.
1st resistance: 194.42
Supporting reasons: The 161.80% Fibonacci Extension represents a level where selling pressure might increase, potentially acting as a barrier to further upside movement within the context of the overall bearish trend.
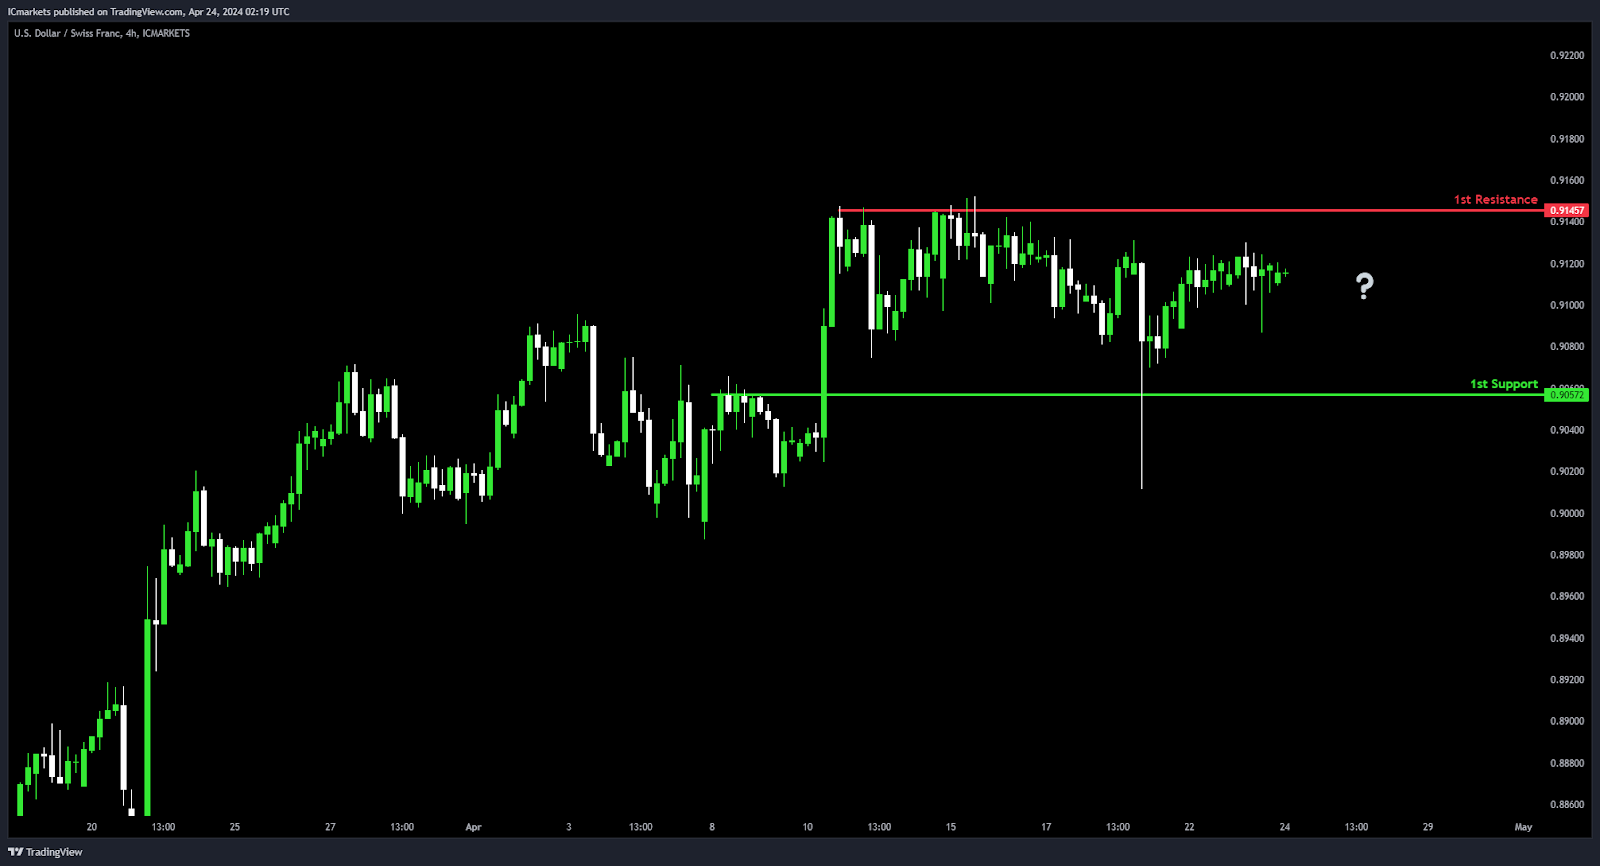
USD/CHF:
Potential Direction: Neutral
Overall momentum of the chart: Neutral
Price could potentially make a fluctuation between the 1st resistance and 1st support level.
1st support: 0.9057
Supporting reasons: An Overlap support, indicating a level where buyers might step in to support the price, potentially providing a foundation for a bounce or temporary halt in the momentum.
1st resistance: 0.9145
Supporting reasons: Multi-swing high resistance, representing a level where selling pressure might intensify, potentially acting as a barrier to further upside movement within the context of the overall neutral trend.
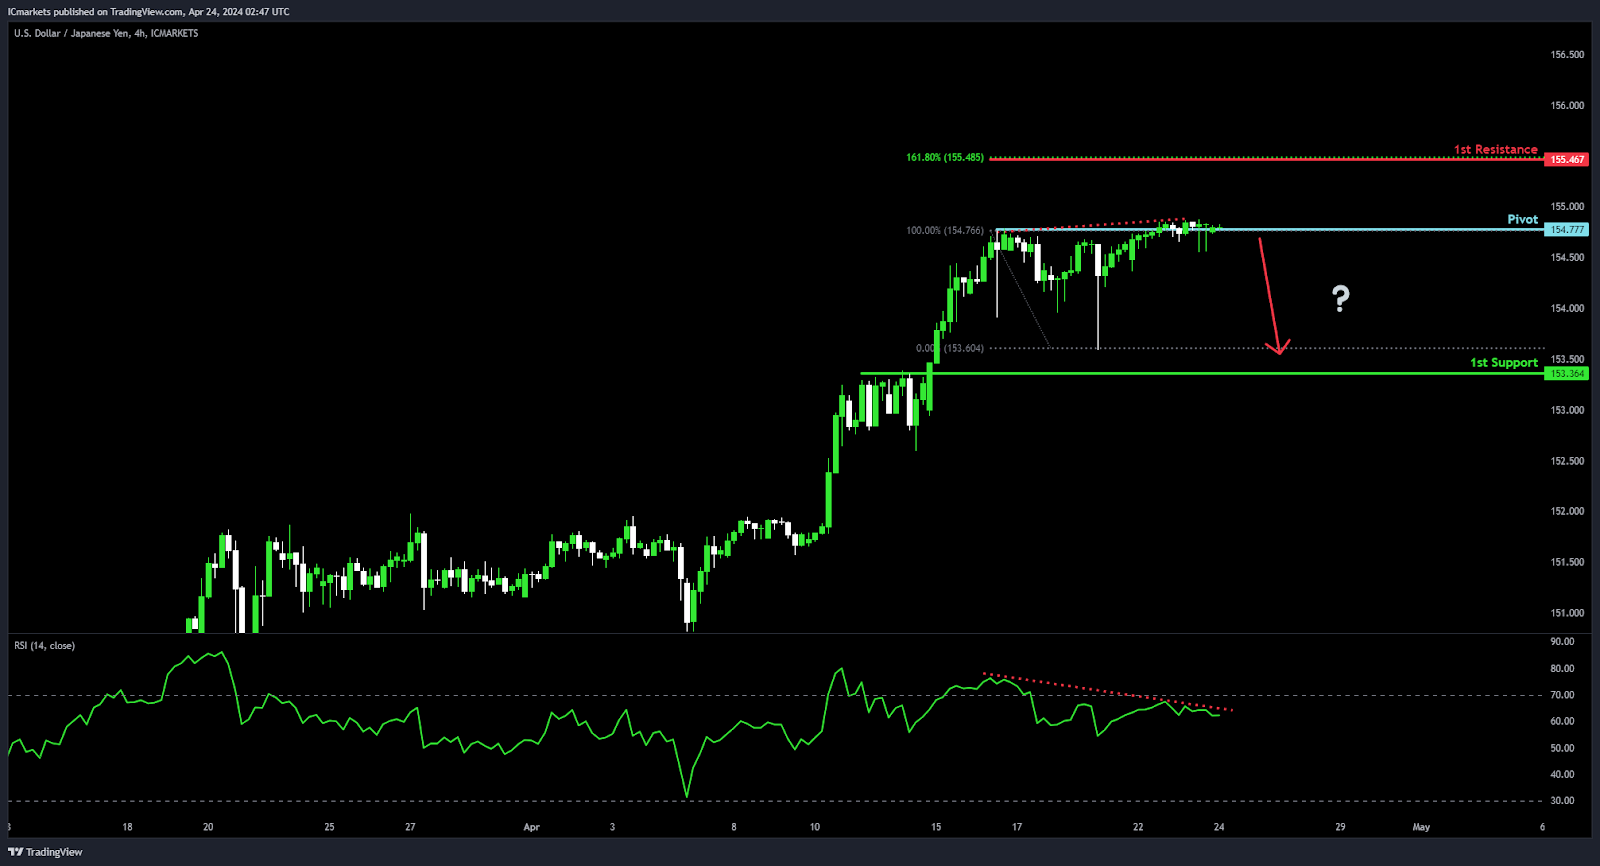
USD/JPY:
Potential Direction: Bearish
Overall momentum of the chart: Bullish
Price could potentially make a bearish reaction off pivot and drop to 1st support.
PIvot: 154.77
Supporting reasons: Multi-swing high resistance, indicating a level where selling pressure might intensify, potentially leading to a reversal or continuation of the bullish momentum.
1st support: 153.36
Supporting reasons: Pullback support, suggesting a level where buyers might step in to support the price, potentially providing a foundation for a bounce or temporary halt in the bullish momentum.
1st resistance: 155.46
Supporting reasons: 161.80% Fibonacci Extension level, representing a significant resistance where selling pressure might increase. Additionally, RSI is displaying bearish divergence versus price, suggesting that a reversal might occur soon.
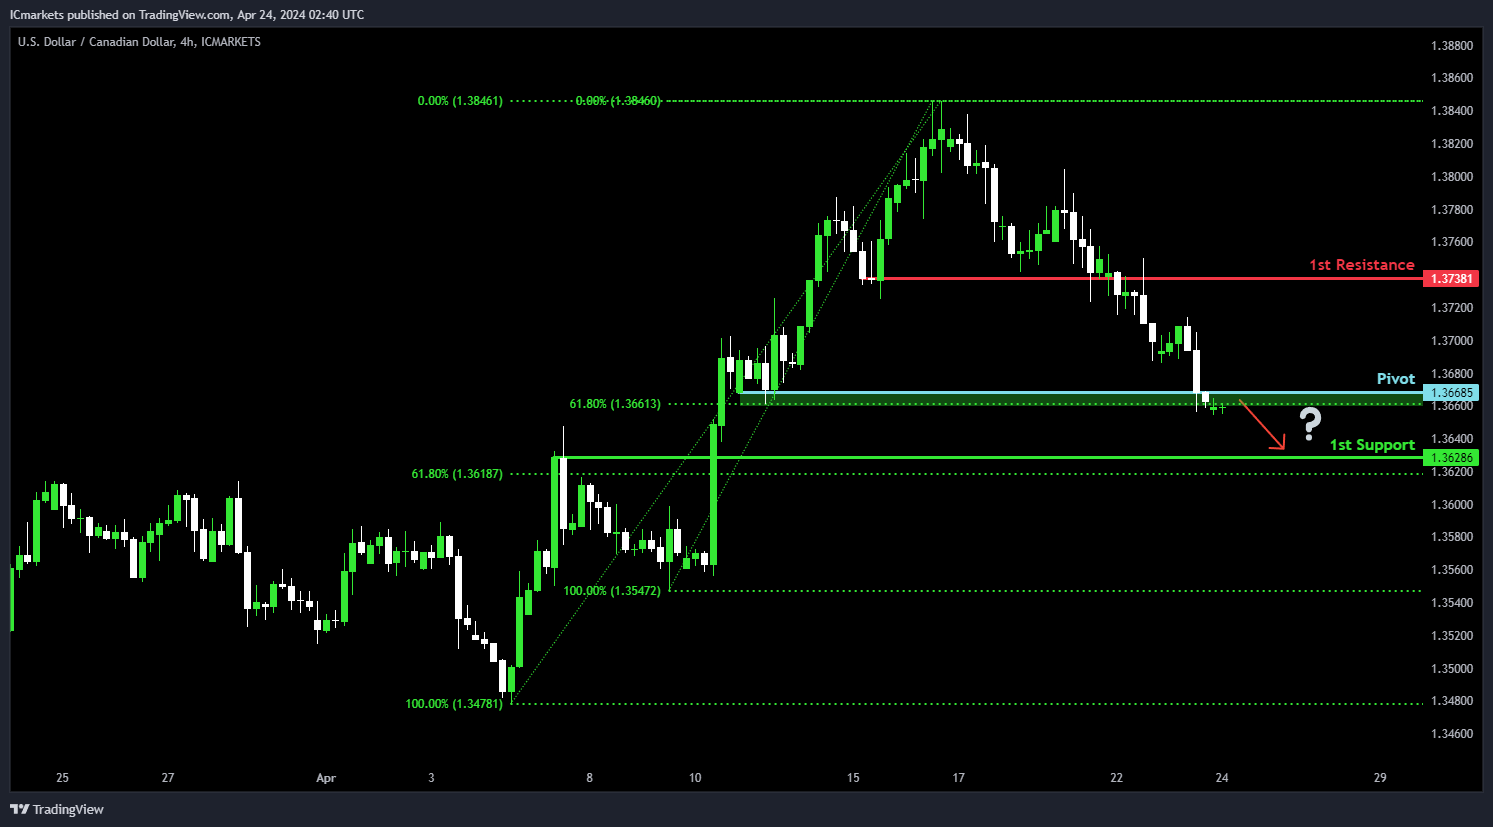
USD/CAD:
Potential Direction: Bearish
Overall momentum of the chart: Bearish
Price has made a bearish reaction through the pivot and could potentially fall towards the 1st support
Pivot: 1.3668
Supporting reasons: Acts as a pullback support that aligns with a 61.8% Fibonacci retracement level, suggesting a significant area where price could find a solid foundation for potential price stabilization or a rebound.
1st support: 1.3628
Supporting reasons: Identified as a pullback support that aligns close to a 61.8% Fibonacci retracement level, suggesting an area where price has previously found strong buying interest to potentially halt any further downward movement.
1st resistance: 1.3738
Supporting reasons: Identified as an overlap resistance, marking a significant barrier that could cap further upward movements.
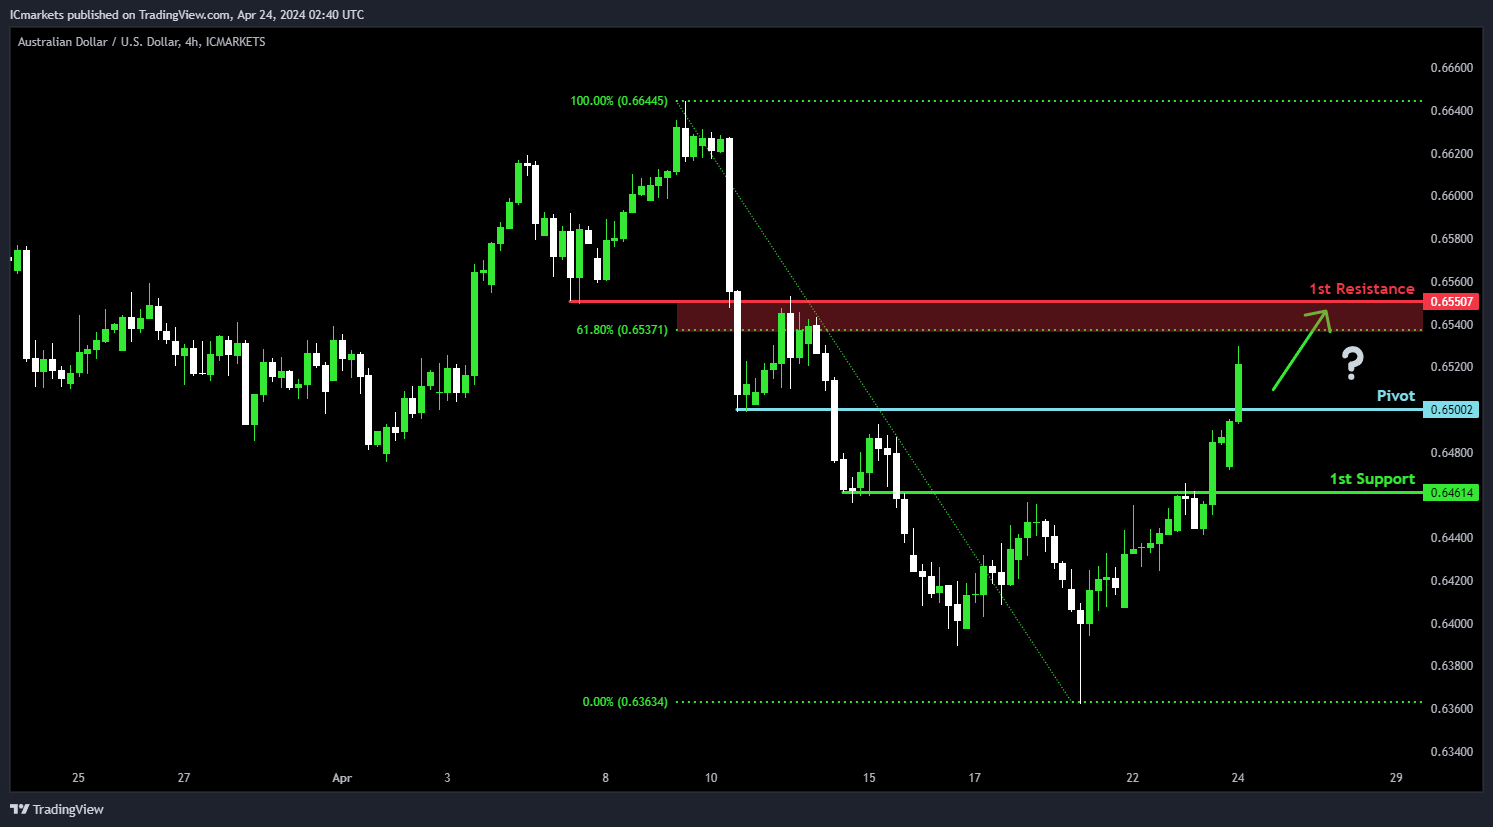
AUD/USD:
Potential Direction: Bullish
Overall momentum of the chart: Bullish
Price has made a bullish reaction through the pivot and could potentially rise towards the 1st resistance
Pivot: 0.6500
Supporting reasons: Previously functioned as a pullback resistance which now has been broken.
1st support: 0.6461
Supporting reasons: Acts as an overlap support, suggesting a significant area where price has previously found strong support and could provide a basis to halt further downward movement.
1st resistance: 0.6550
Supporting reasons: Identified as an overlap resistance that aligns close to a 61.8% Fibonacci retracement level, marking a barrier that has previously capped upward movements.
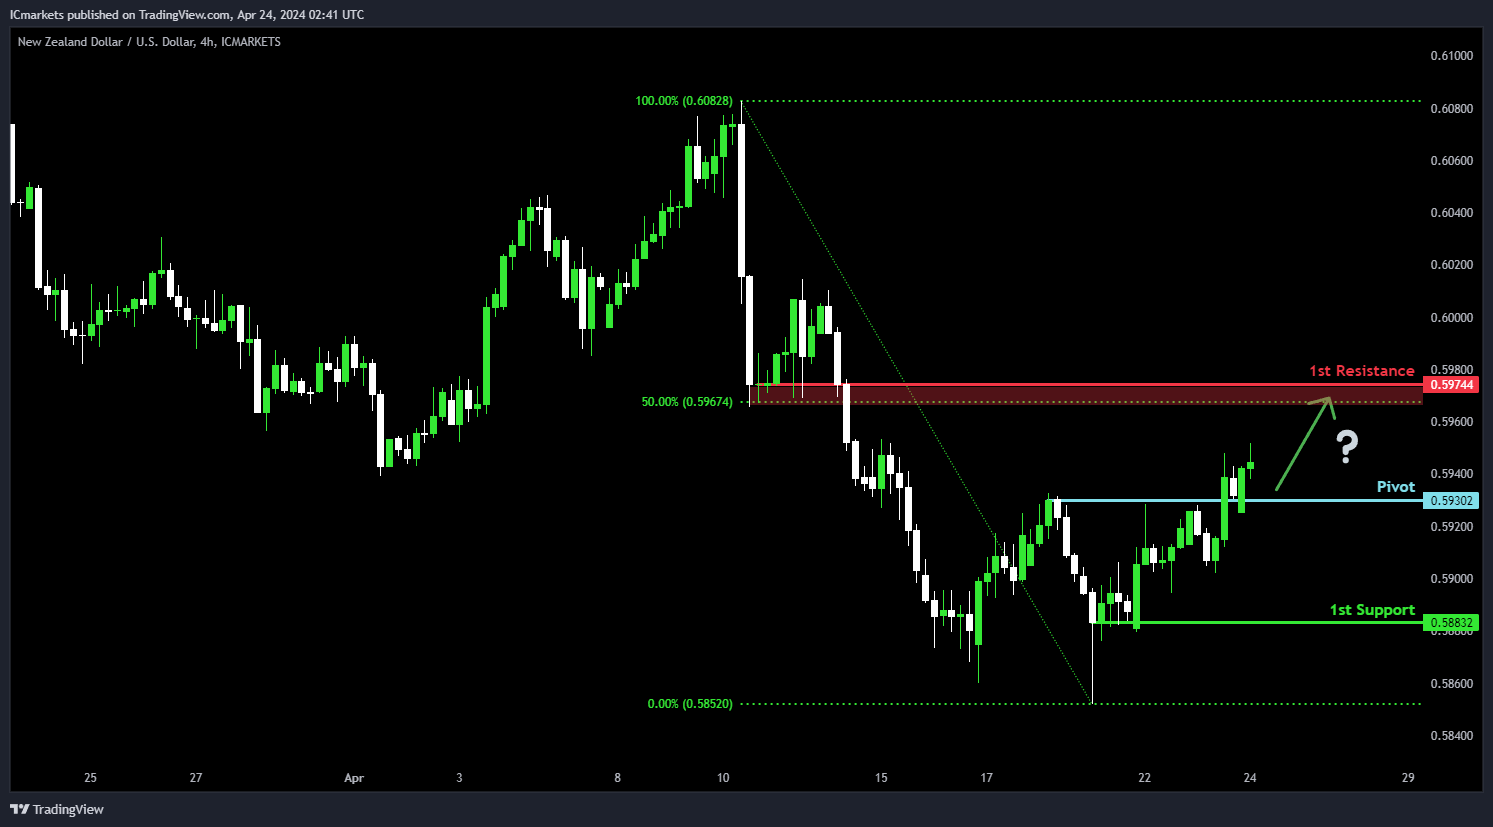
NZD/USD
Potential Direction: Bullish
Overall momentum of the chart: Bullish
Price has made a bullish reaction through the pivot and could potentially rise towards the 1st resistance
Pivot: 0.5930
Supporting reasons: Previously functioned as a pullback resistance which now has been broken.
1st support: 0.5883
Supporting reasons: Acts as a pullback support, suggesting a potential area where price has previously found strong support and could provide a basis to halt further downward movement.
1st resistance: 0.5974
Supporting reasons: Identified as a pullback resistance that aligns close to a 50% Fibonacci retracement level, marking a barrier that has previously capped upward movements.
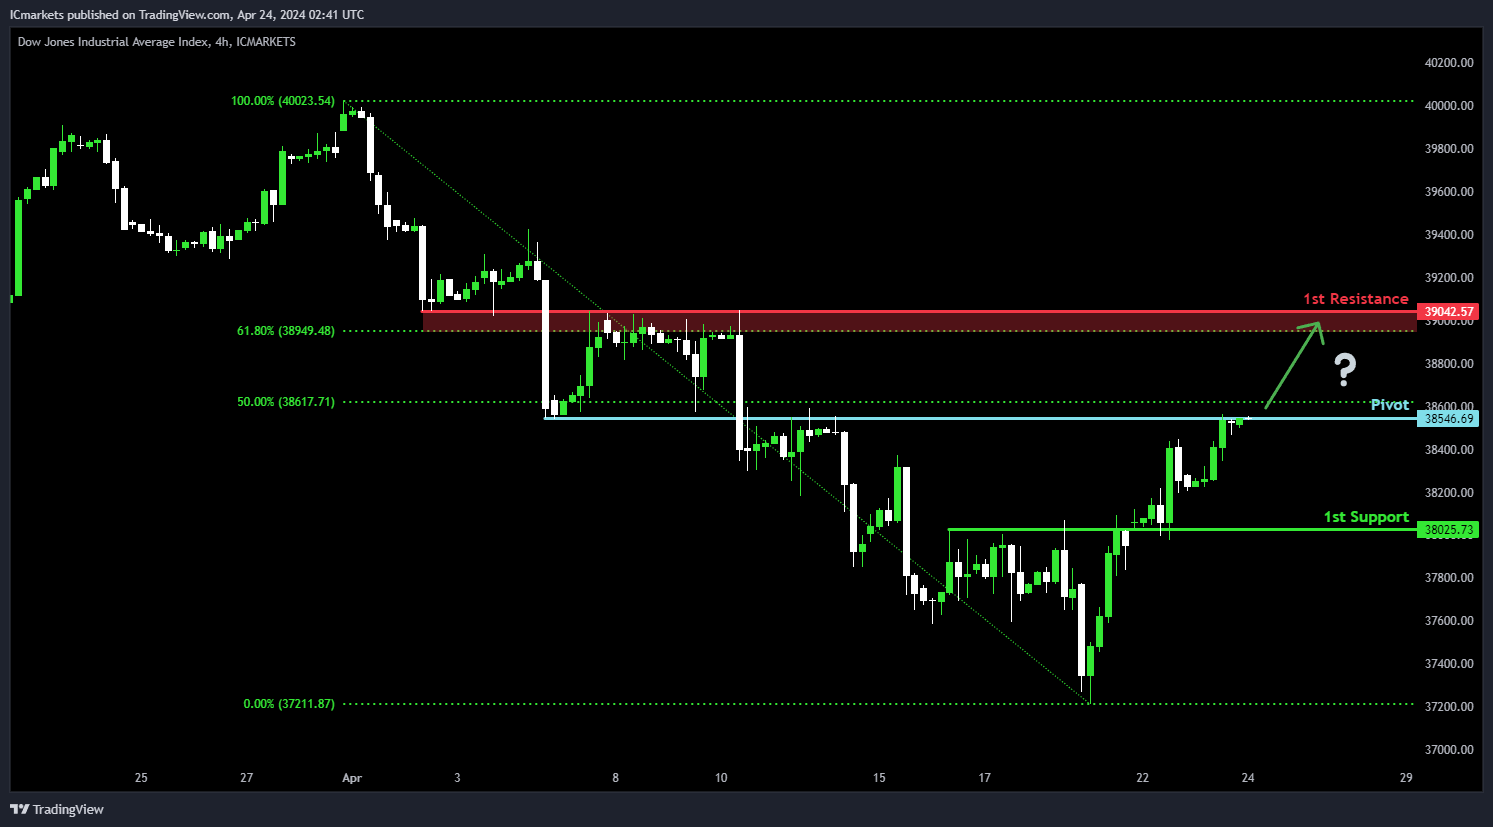
US30 (DJIA):
Potential Direction: Bullish
Overall momentum of the chart: Bullish
Price could potentially make a bullish reaction through the pivot and rise towards the 1st resistance
Pivot: 38,546.69
Supporting reasons: Acts as a potential breakout level where the strong bullish momentum could drive price above this level.
1st support: 38,025.73
Supporting reasons: Identified as an overlap support, suggesting a significant area where price has previously found strong buying interest and could provide a solid foundation to halt further downward movement.
1st resistance: 39,042.57
Supporting reasons: Identified as an overlap resistance that aligns close to a 61.8% Fibonacci retracement level, indicating a potential barrier that could cap any upward movements.
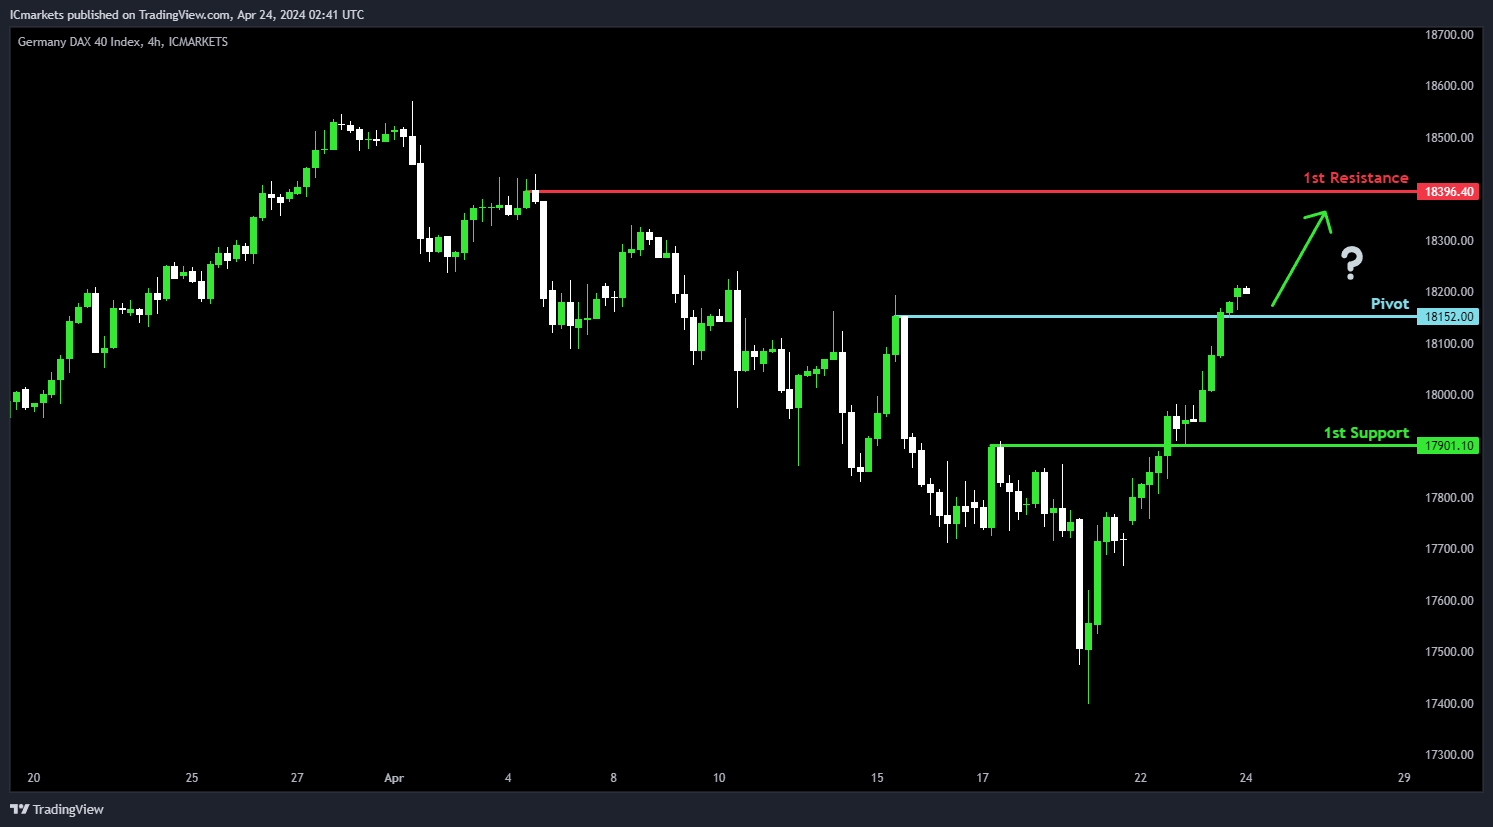
DE40 (DAX):
Potential Direction: Bullish
Overall momentum of the chart: Bullish
Price has made a bullish reaction through the pivot and could potentially rise towards the 1st resistance
Pivot: 18,152.00
Supporting reasons: Previously functioned as a pullback resistance which now has been broken and could serve as a pullback support.
1st support: 17,901.10
Supporting reasons: Acts as an overlap support, suggesting a significant area where price has previously found strong buying interest and could provide a solid foundation to halt further downward movement.
1st resistance: 18,396.40
Supporting reasons: Identified as a pullback resistance, potentially functioning as a barrier that could cap any upward movements.
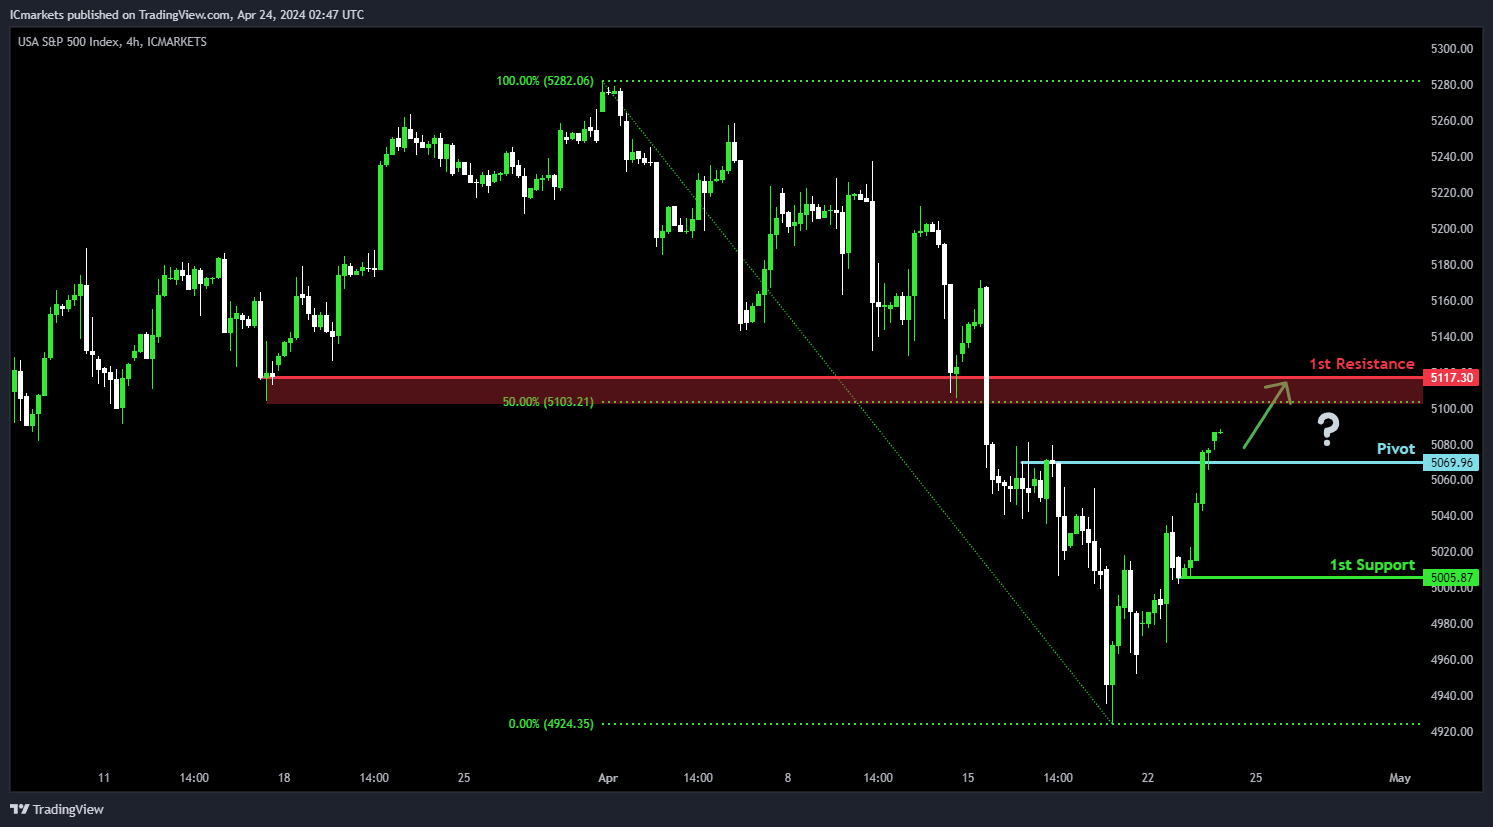
US500 (S&P 500):
Potential Direction: Bullish
Overall momentum of the chart: Bullish
Price has made a bullish reaction through the pivot and could potentially rise towards the 1st resistance
Pivot: 5,069.96
Supporting reasons: Previously functioned as a pullback resistance which now has been broken and could serve as a pullback support.
1st support: 5,005.87
Supporting reasons: Acts as a pullback support, suggesting a significant area where price has previously found strong buying interest and could provide a solid foundation to halt further downward movement.
1st resistance: 5,117.30
Supporting reasons: Marked by a pullback resistance that aligns close to a 50% Fibonacci retracement level, which could function as a potential barrier and cap any upward movements.
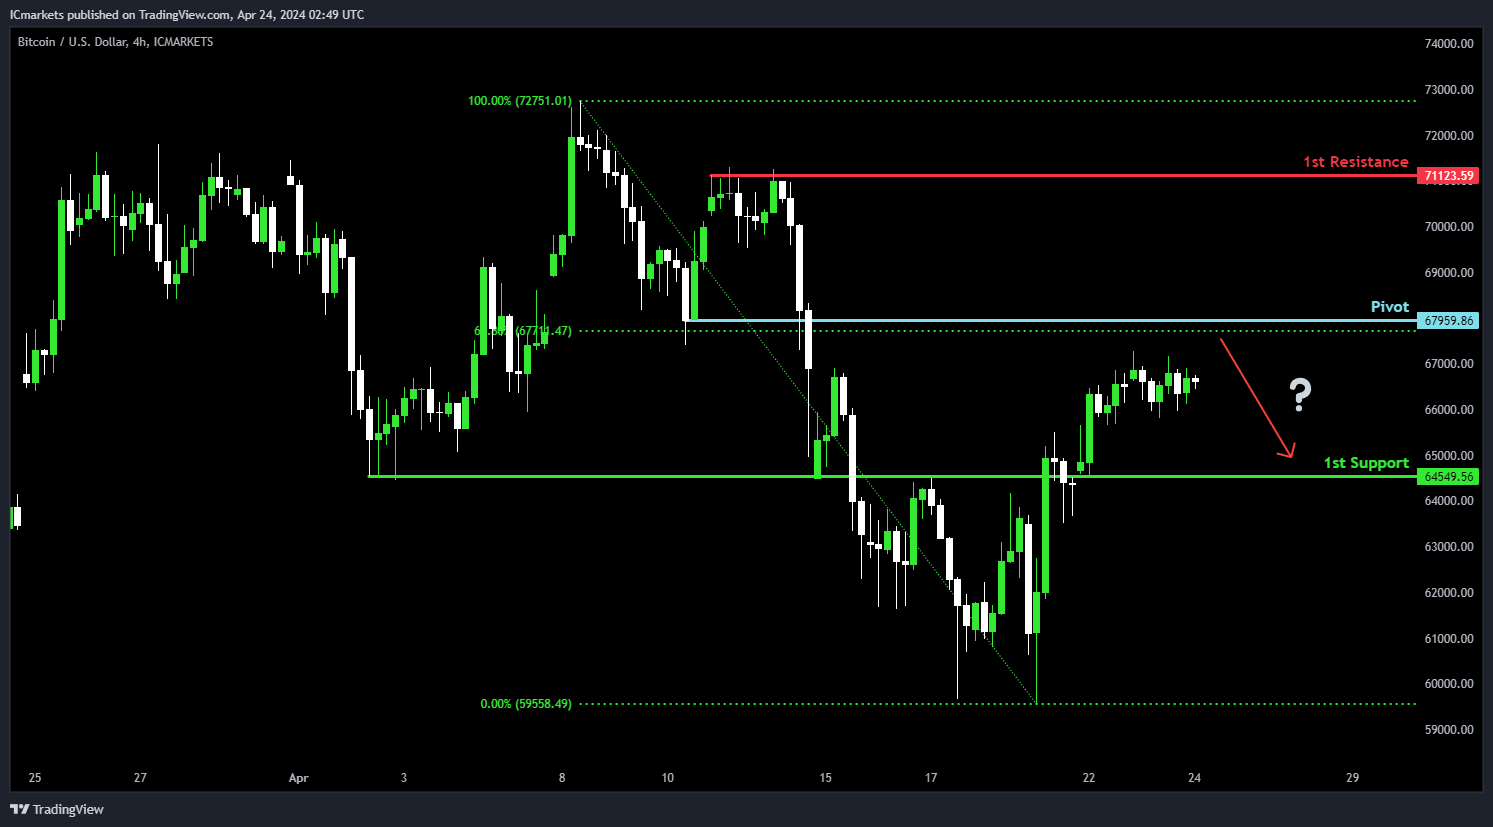
BTC/USD (Bitcoin):
Potential Direction: Bearish
Overall momentum of the chart: Neutral
Price could rise towards the pivot and potentially make a bearish reaction off this level to drop towards the 1st support
Pivot: 67,959.86
Supporting reasons: Acts as a pullback support that aligns with a 61.8% Fibonacci retracement level, suggesting a significant area where price could face strong selling pressures and potentially stall around this level before reversing to drop lower.
1st support: 64,549.56
Supporting reasons: Acts as an overlap support, suggesting a significant area where price has previously found support and could provide a strong foundation to halt further downward movements.
1st resistance: 71,123.59
Supporting reasons: Marked by a pullback resistance, indicating a significant barrier that could cap further upward movements.
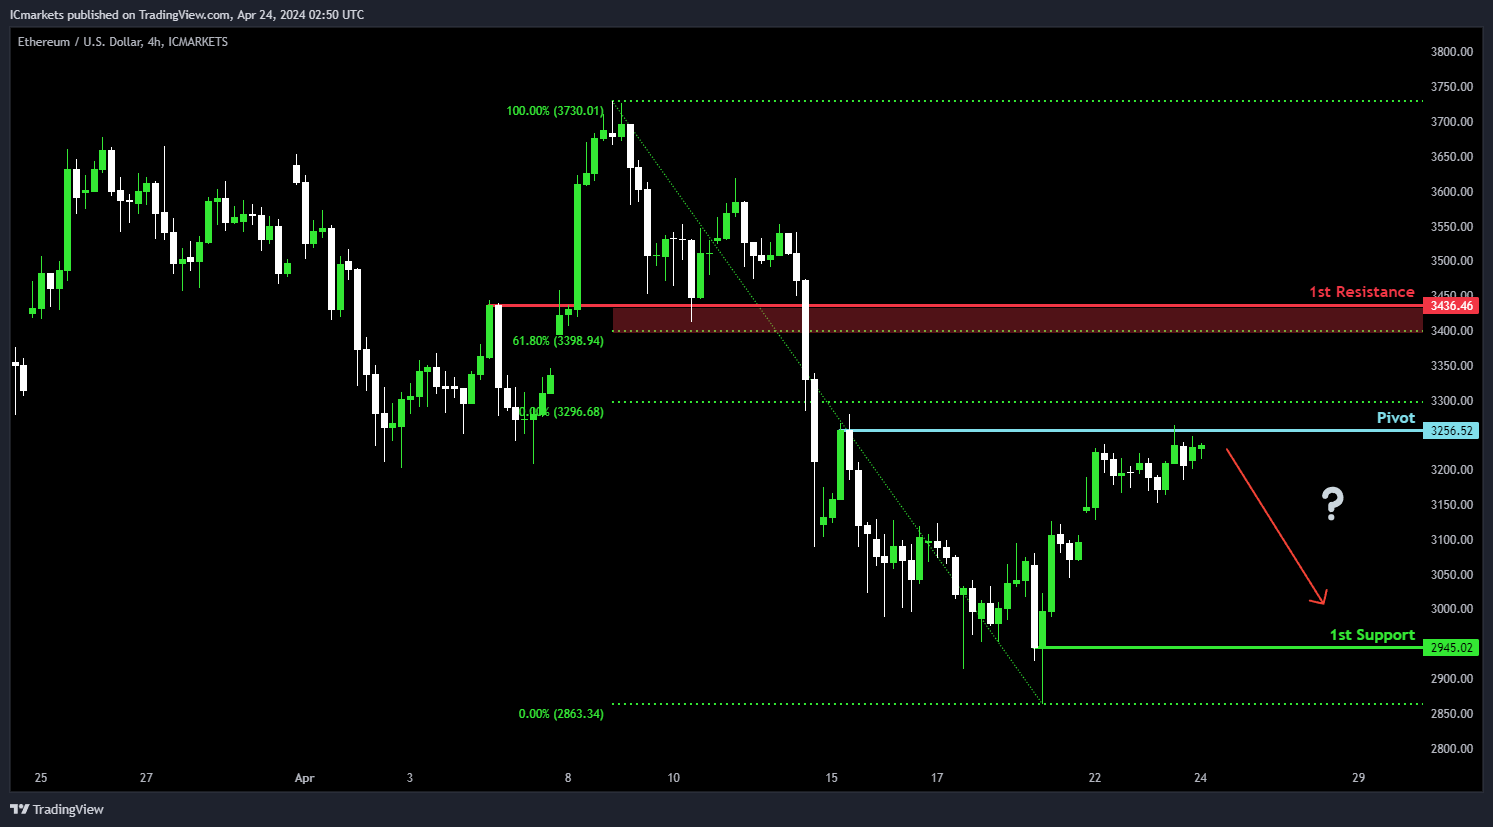
ETH/USD (Ethereum):
Potential Direction: Bearish
Overall momentum of the chart: Neutral
Price could rise towards the pivot and potentially make a bearish reaction off this level to drop towards the 1st support
Pivot: 3,256.52
Supporting reasons: Acts as a pullback support that aligns close to a 50% Fibonacci retracement level, suggesting a significant area where price could face strong selling pressures and potentially stall around this level before reversing to drop lower.
1st support: 2,945.02
Supporting reasons: Identified as a pullback support, suggesting a significant area where price has previously found support and could provide a strong foundation to halt further downward movements.
1st resistance: 3,436.46
Supporting reasons: Identified as an overlap resistance that aligns close to a 61.8% Fibonacci retracement level, marking a significant barrier that could cap further upward movements.
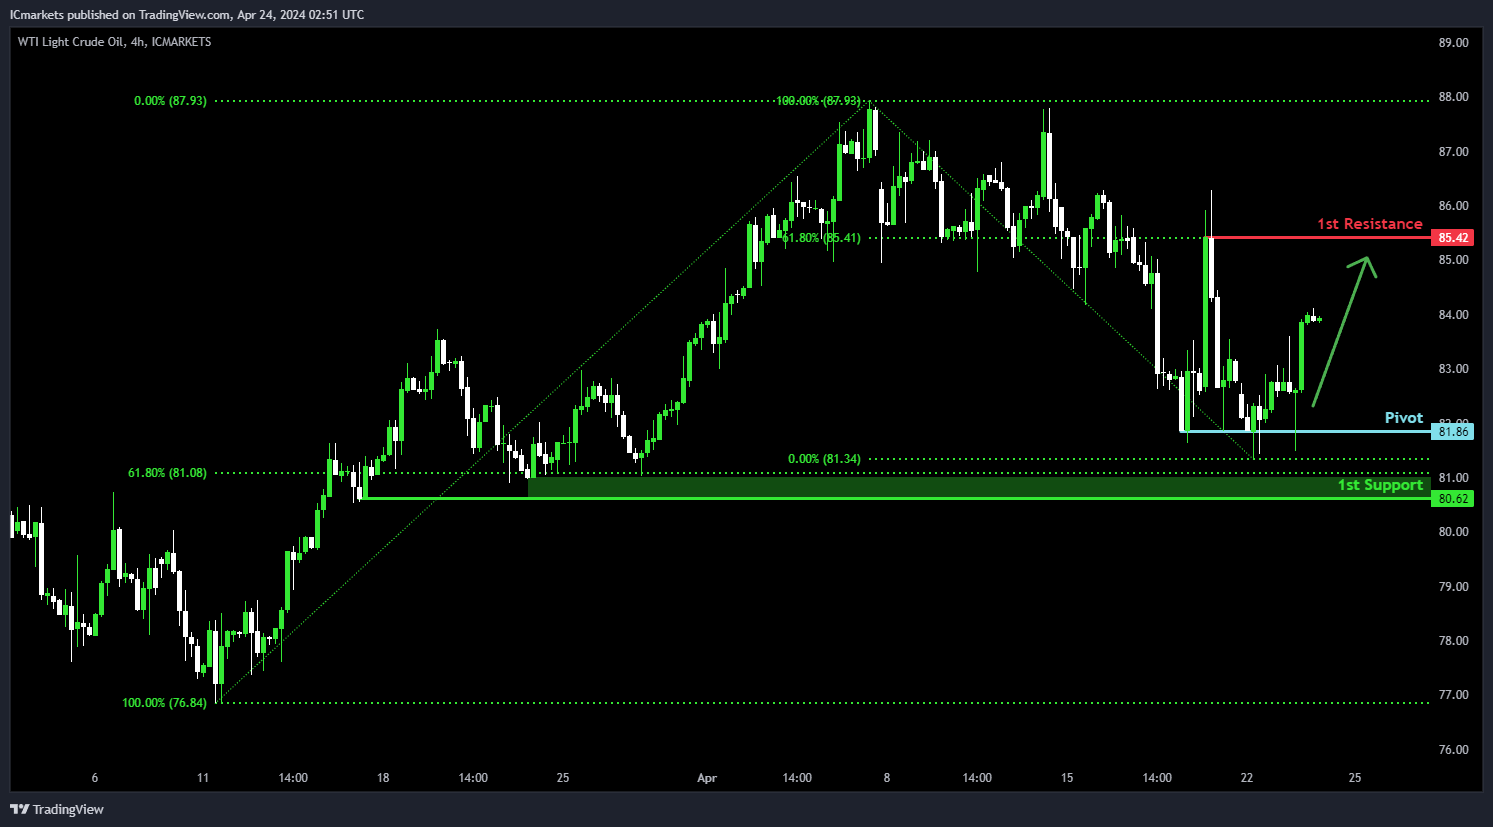
WTI/USD (Oil):
Potential Direction: Bullish
Overall momentum of the chart: Neutral
Price has made a bullish reaction off the pivot and could potentially rise towards the 1st resistance
Pivot: 81.86
Supporting reasons: Acts as a pullback support, suggesting a significant area where price has previously found support to provide a strong foundation for a potential rebound.
1st support: 80.62
Supporting reasons: Identified as a pullback support that aligns close to a 61.8% Fibonacci retracement level, suggesting a significant area where price has previously found strong buying interest and could provide a solid foundation to halt further downward movements.
1st resistance: 85.42
Supporting reasons: Identified as a pullback resistance that aligns with a 61.8% Fibonacci retracement level, marking a significant barrier that could cap further upward movements.
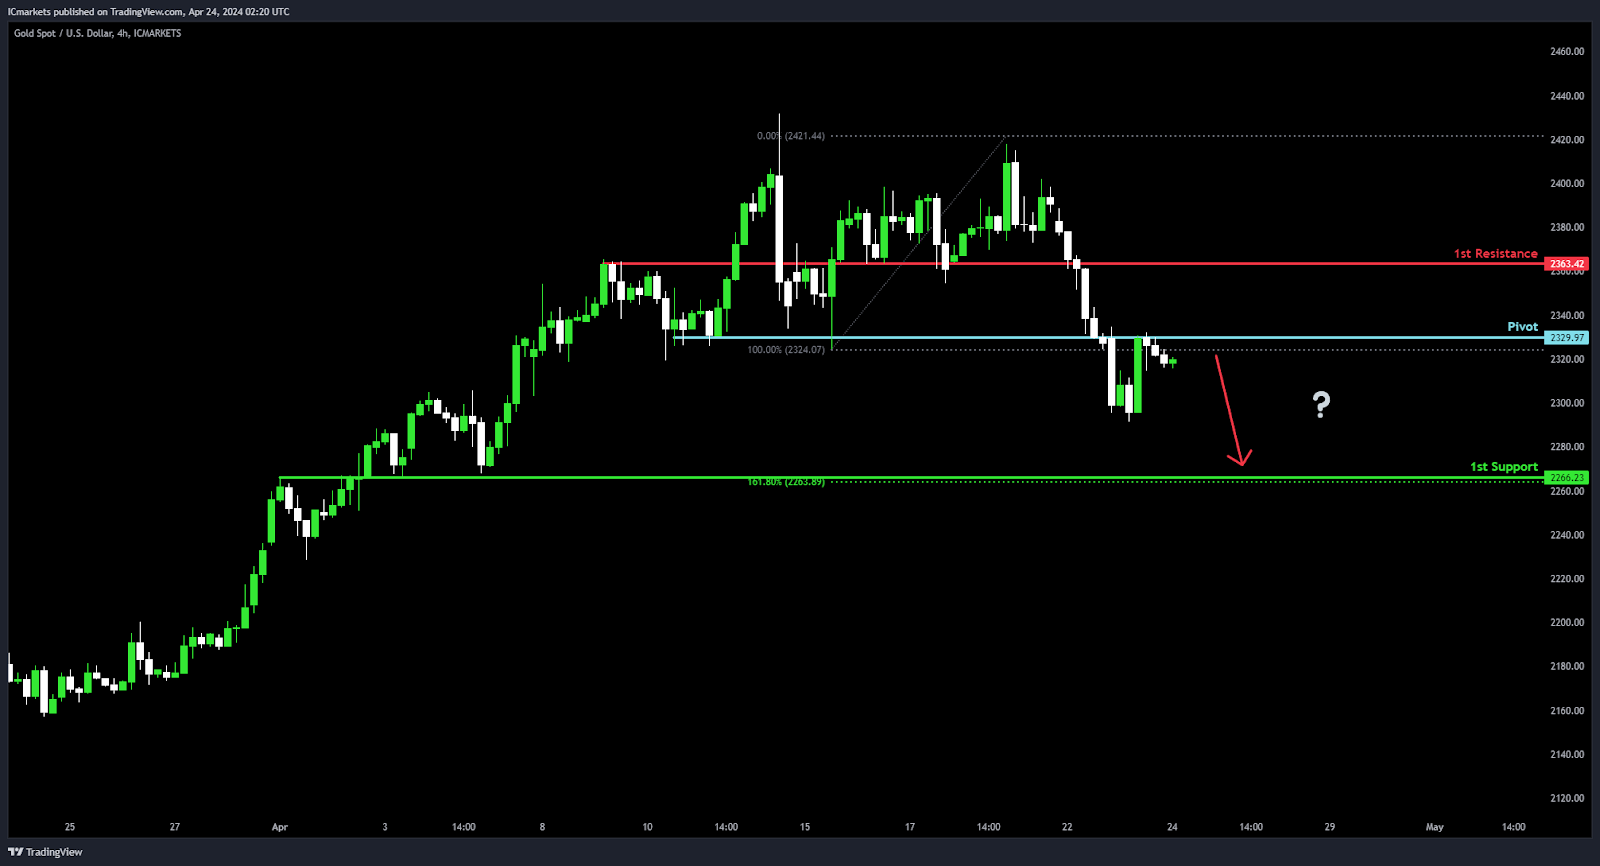
XAU/USD (GOLD):
Potential Direction: Bearish
Overall momentum of the chart: Bearish
Price could potentially make a bearish continuation towards 1st support.
Pivot: 2329.97
Supporting reasons: An Overlap resistance, indicating a significant level where selling pressure might intensify, potentially leading to a continuation of the bearish momentum.
1st support: 2266.23
Supporting reasons: An Overlap support combined with the 161.80% Fibonacci Extension, suggesting a level where buyers might step in to support the price, potentially providing a foundation for a bounce or temporary halt in the bearish momentum.
1st resistance: 2363.42
Supporting reasons: Pullback resistance, representing a level where selling pressure might increase, potentially acting as a barrier to further upside movement.
The accuracy, completeness and timeliness of the information contained on this site cannot be guaranteed. IC Markets does not warranty, guarantee or make any representations, or assume any liability regarding financial results based on the use of the information in the site.
News, views, opinions, recommendations and other information obtained from sources outside of www.icmarkets.com, used in this site are believed to be reliable, but we cannot guarantee their accuracy or completeness. All such information is subject to change at any time without notice. IC Markets assumes no responsibility for the content of any linked site.
The fact that such links may exist does not indicate approval or endorsement of any material contained on any linked site. IC Markets is not liable for any harm caused by the transmission, through accessing the services or information on this site, of a computer virus, or other computer code or programming device that might be used to access, delete, damage, disable, disrupt or otherwise impede in any manner, the operation of the site or of any user’s software, hardware, data or property.


