
Key risk events today:
RBA Assist Gov Bullock Speaks; OPEC Meetings; FOMC Member Williams Speaks; US CB Consumer Confidence; US Richmond Manufacturing Index; Fed Chair Powell Speaks.
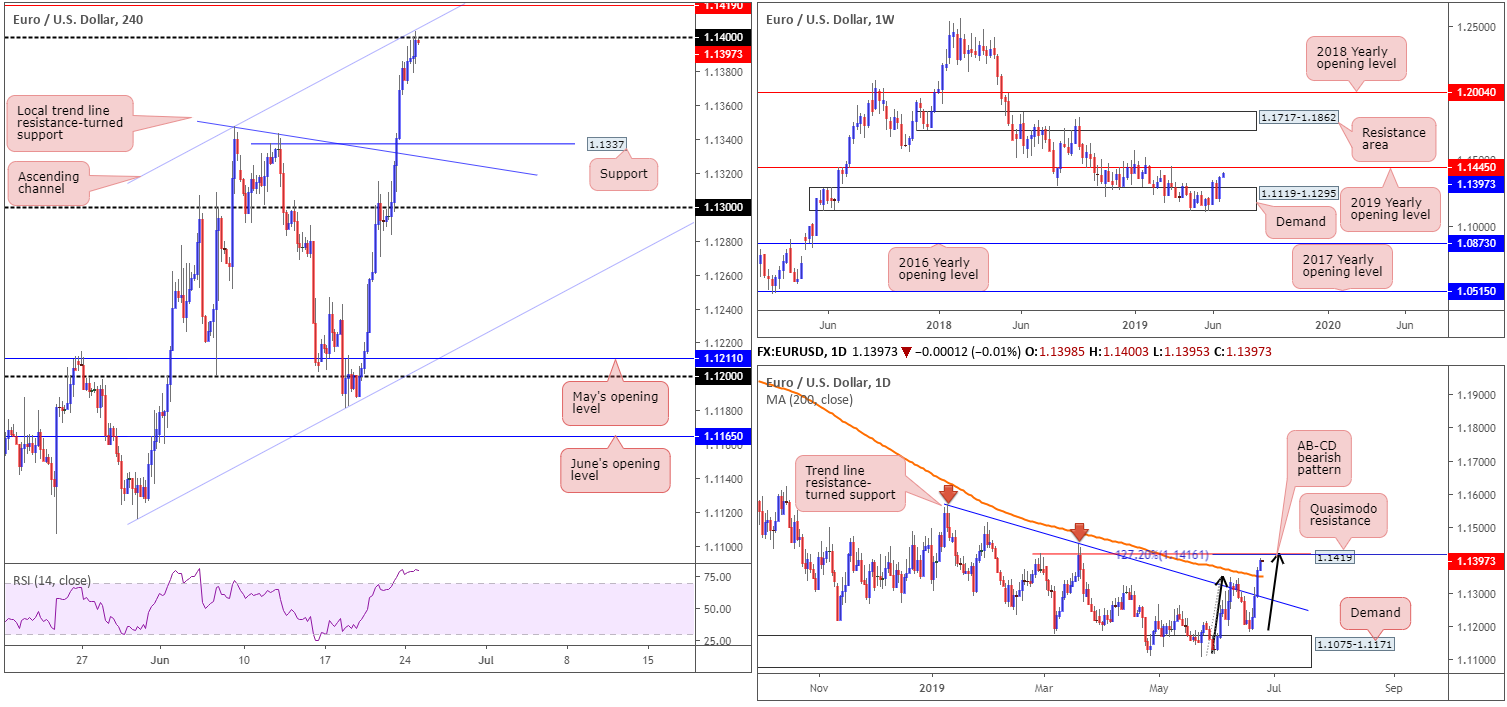
EUR/USD:
The greenback began the week on soft footing, testing and marginally surpassing the 96.00 handle (dollar index). This elevated the euro to a fresh three-month high at 1.1404, though finished the day closing a touch sub 1.14. Technically speaking, psychological numbers are valid support and resistances, and when combined with a nearby H4 channel resistance taken from the high 1.1347 as well as the RSI indicator testing overbought waters, a selloff may ensue, with the next downside target on the H4 scale not visible until support coming in at 1.1337.
On a wider perspective, the euro picked up steam against the dollar after dethroning the 200-day SMA on the daily timeframe. While this is likely aiding recent upside, traders are urged to pencil in strong resistance at 1.1419: a Quasimodo resistance along with a merging 127.2% AB=CD (black arrows) bearish pattern at 1.1416. Also worthy of air time is the weekly timeframe, seen nearing the 2019 yearly opening level (resistance) at 1.1445. Despite recent buying, longer-term traders may also want to note the overall trend remains facing in a southerly direction since topping in early 2018. For that reason, 1.1445 is likely to act as strong resistance.
Areas of consideration:
Higher-timeframe structure highlights weekly resistance around the 1.1445 point, with daily flow demonstrating a potential ceiling at 1.1419.
On account of the above, selling between 1.1445/1.14 (comprised of the weekly resistance level at 1.1445, the daily Quasimodo resistance at 1.1419 and the round number 1.14) is an option.
As for entry and exit, stop-loss placement is best set beyond the sell zone at around 1.1447, with an initial target fixed at the 200-day SMA (currently trading at 1.1351). Of course, the higher you manage to short within the pre-defined sell zone, the better the risk/reward.
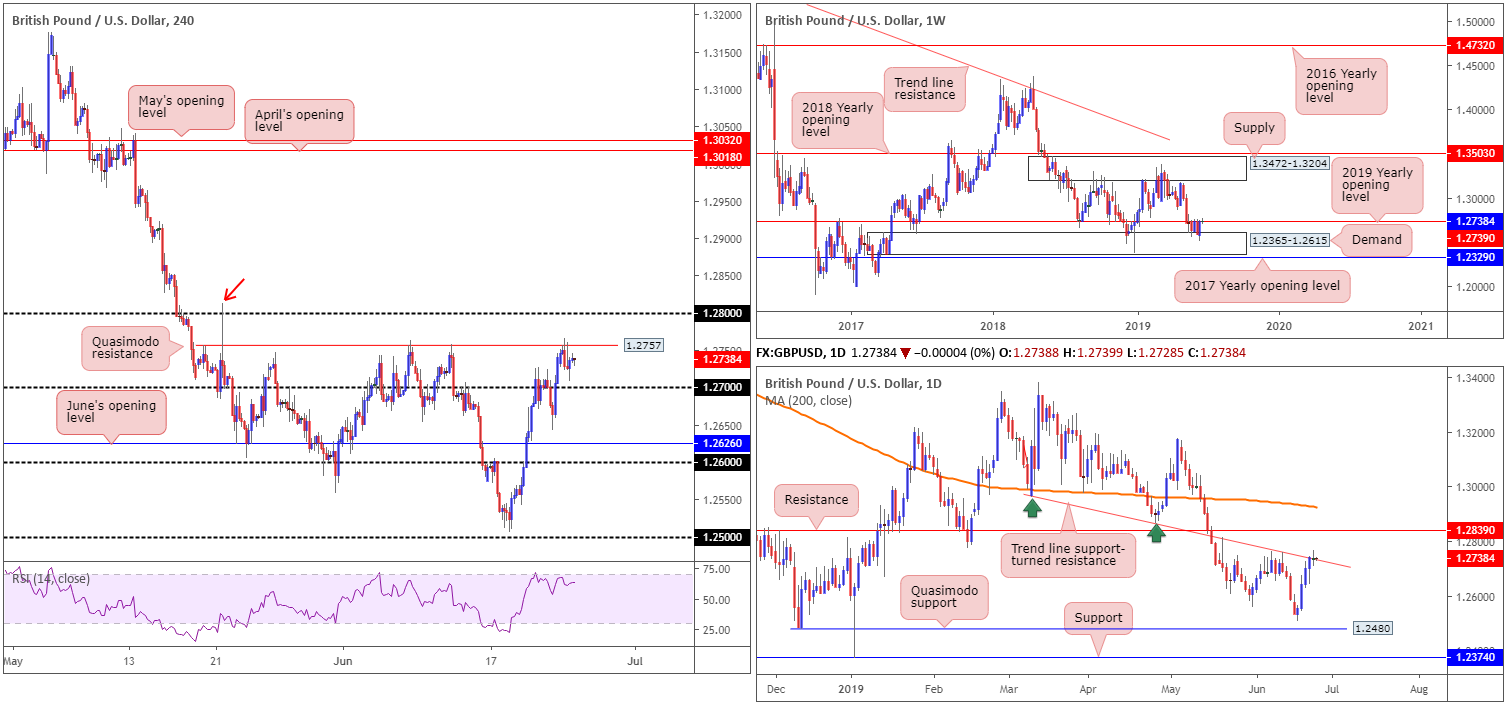
GBP/USD:
Failing to gain traction beyond the H4 Quasimodo resistance at 1.2757, despite continued USD selling (DXY tested 96.00), led to a test of session lows just north of 1.27 at 1.2708.
On the whole, the GBP/USD concluded Monday unchanged, with the daily timeframe chalking up a clear-cut indecision candle at trend line support-turned resistance taken from the low 1.2960.
For traders who read Monday’s report you may recall the following:
Traders are encouraged to include the H4 Quasimodo resistance at 1.2757 in their analysis today/early week, due to its surrounding confluence underscored above (the daily trend line resistance and the 2019 yearly opening level on the weekly timeframe at 1.2739). However, traders should prepare for the possibility of a fakeout through this level, as the market may want to bring in additional sellers from 1.28 positioned nearby.
As a result of the above, the area between 1.28 and 1.2757 is of interest for selling. Favoured stop-loss placement, according to our technical studies, is beyond the 1.2813 May 21 high (red arrow), with the initial downside target placed at 1.27.
Areas of consideration:
For folks short the GBP, as highlighted above, the next support target can be seen at the 1.27 handle. Stop-loss placement remains best above the 1.2813 May 21 high until 1.27 is breached. At that point, traders have the option of taking partial profits and reducing risk to breakeven.
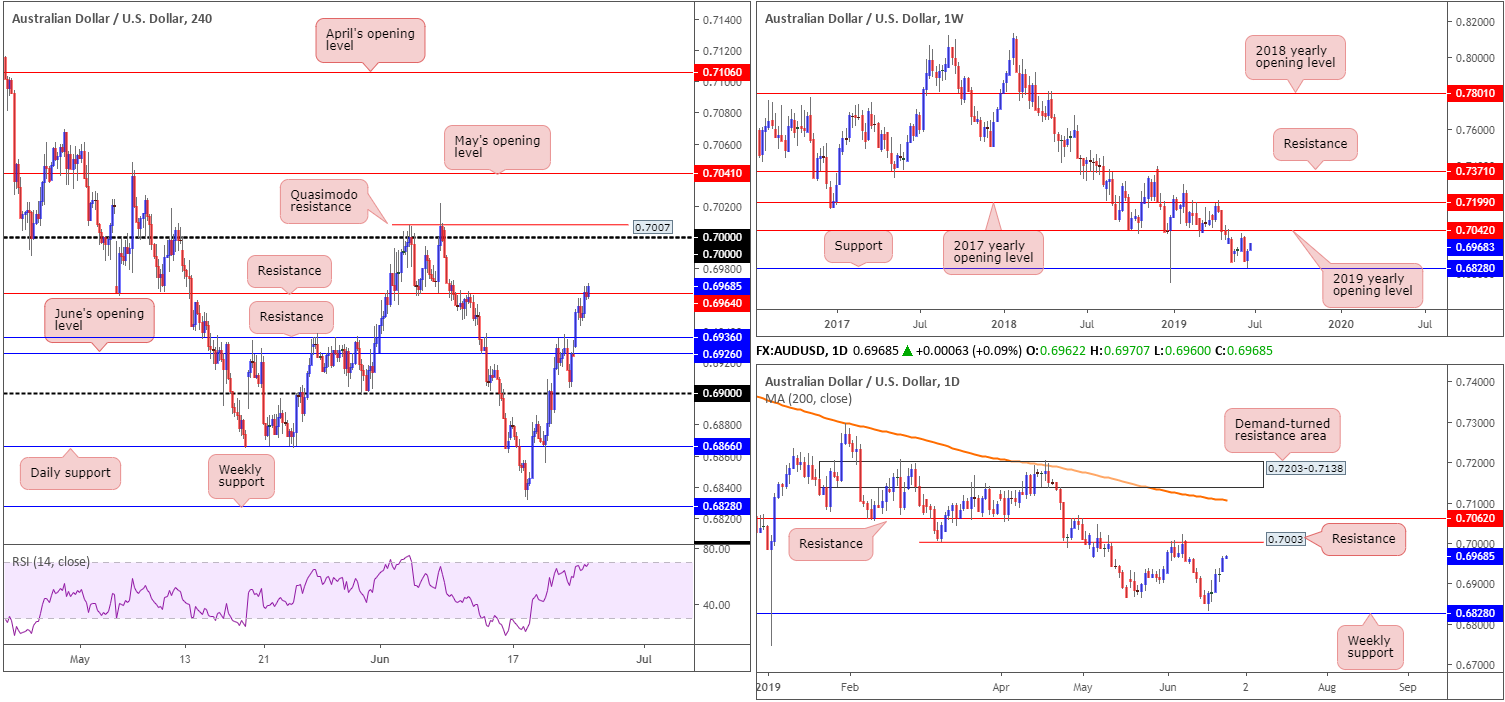
AUD/USD:
Optimism remains ahead of this week’s G20 meeting, and the highly anticipated extended meeting between US President Trump and China President Xi. This, alongside the US dollar continuing to explore lower ground on the back of expectations of a potential rate cut, witnessed the Australian dollar extend last week’s gains Monday, up 0.55%.
In recent hours, the market observed the H4 candles shake hands with resistance at 0.6964, after overthrowing resistance (now acting support) at 0.6936. The next port of call beyond 0.6964 can be seen around the key figure 0.70 and closely merging Quasimodo resistance at 0.7007.
Higher-timeframe analysis had the following to report in Monday’s briefing:
Weekly timeframe:
Over the course of last week’s sessions, price action came within a couple of points of connecting with notable support pencilled in at 0.6828 (a level offering history as far back as mid-2003) before rotating higher. Adding more than 50 points, and likely sparking buyer interest, further upside could be on the cards this week, with an initial objective set at the 2019 yearly opening level 0.7042.
Daily timeframe:
Shifting focus to the daily timeframe, we can see the unit finished Friday in the shape of an indecision candle, following a three-day bullish phase. Technically speaking, room to manoeuvre higher this week is visible, targeting resistance plotted at 0.7003. Note this level held price action lower since early May.
Areas of consideration:
In light of the above reading, two scenarios are on the menu:
- A H4 close above 0.6964, followed up with a retest, offers short-term traders the chance to buy this market, ultimately targeting 0.70 (entry and risk can be structured according to the rejection candle’s parameters).
- A sell from 0.70, knowing we have the following confluence: a H4 Quasimodo resistance level at 0.7007 and a daily resistance at 0.7003. Although the threat of further upside beyond 0.70 is present on the weekly timeframe to 0.7042, a short from 0.70 remains valid. Those concerned by weekly structure, however, could opt to wait for additional confirmation before pulling the trigger, formed by way of a H4 or H1 bearish candlestick signal. Not only does the bearish candlestick signal identify seller intent, it also helps traders locate entry and risk levels to work with.
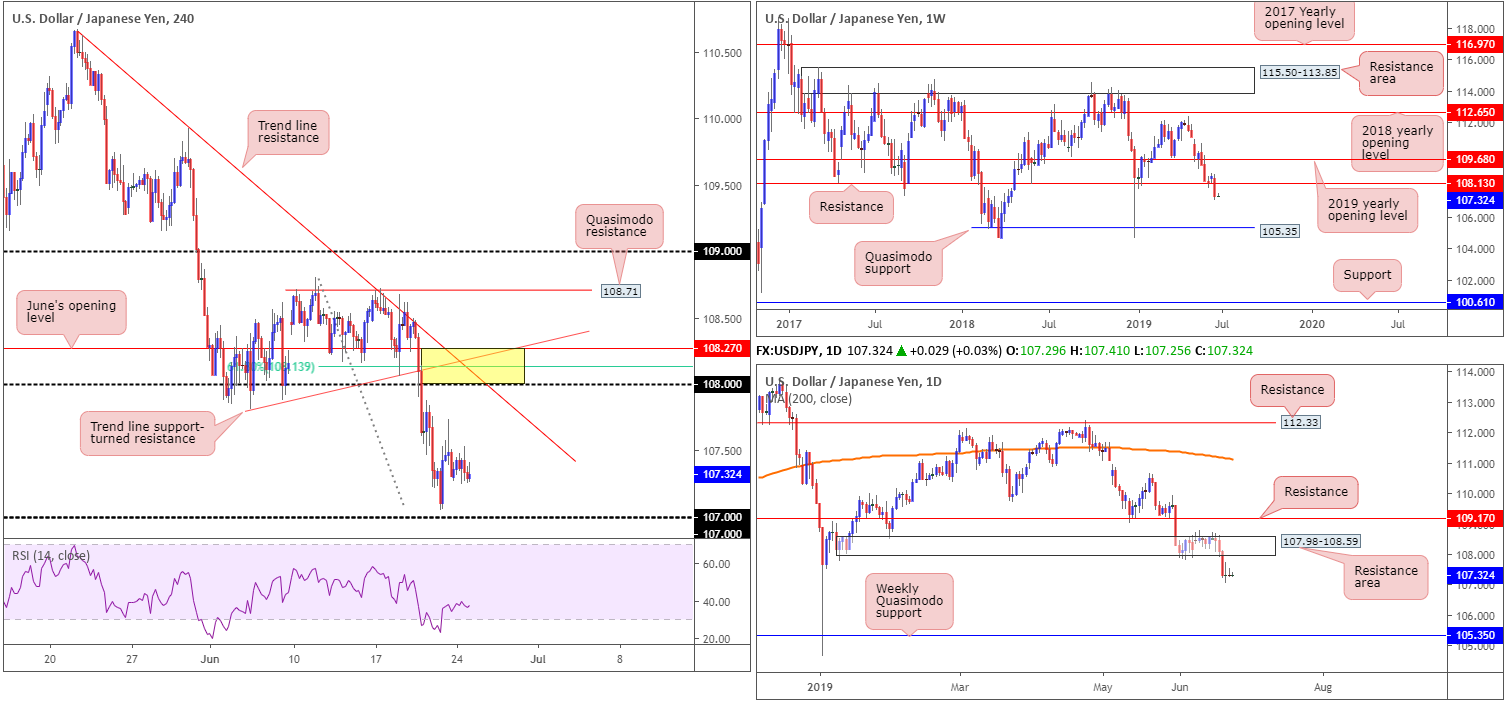
USD/JPY:
USD/JPY flows struggled to pin down short-term direction Monday, leaving the unit unchanged at the close. In light of the lacklustre performance, much of the following report will echo thoughts put forward in Monday’s weekly briefing.
From the weekly timeframe, the weekly report had the following to say:
The break of key support at 108.13 is critical, given the next available support, according to our technical reading, does not emerge until Quasimodo support at 105.35.
Although violating 108.13 is considered a sell signal, the possibility of price action pulling back and retesting the underside of the broken level as resistance is certainly there. As such, those short on the breakout candle may experience drawdown.
From the daily timeframe:
A closer reading of price action on the daily timeframe witnessed the unit sink a long-suffering demand at 107.98-108.59 in the shape of a near-full-bodied bearish candle Thursday. Similar to the weekly timeframe, the research team sees limited support until connecting with weekly Quasimodo support at 105.35, though remain open to the possibility a pullback could ensue before further selling materialises.
And finally, the H4 timeframe:
Although the US dollar index continued to explore lower ground Friday and Monday, the USD/JPY concluded unchanged. The H4 candles remain loitering just north of the 107 handle.
Areas of consideration:
Although the technical picture portends a downside bias this week that’ll likely bring in 107 buyers on the H4 timeframe, selling is problematic. An ideal scenario would be for the H4 candles to pull back and retest the 108 region, which happens to align closely with the lower edge of the recently engulfed daily demand at 107.98, two H4 trend line resistances (110.67/107.81), a 61.8% Fibonacci retracement value at 108.13 and June’s opening level at 108.27.
From here, traders have the opportunity to consider selling, with the first downside target likely best set at any demand formed on the approach. However, do keep in mind both weekly and daily timeframes show room to press as far south as the weekly Quasimodo support at 105.35, so further selling beyond the first take-profit target is most likely on the cards.
Entry at 108 seems reasonable, with a protective stop-loss order plotted beyond 108.27.
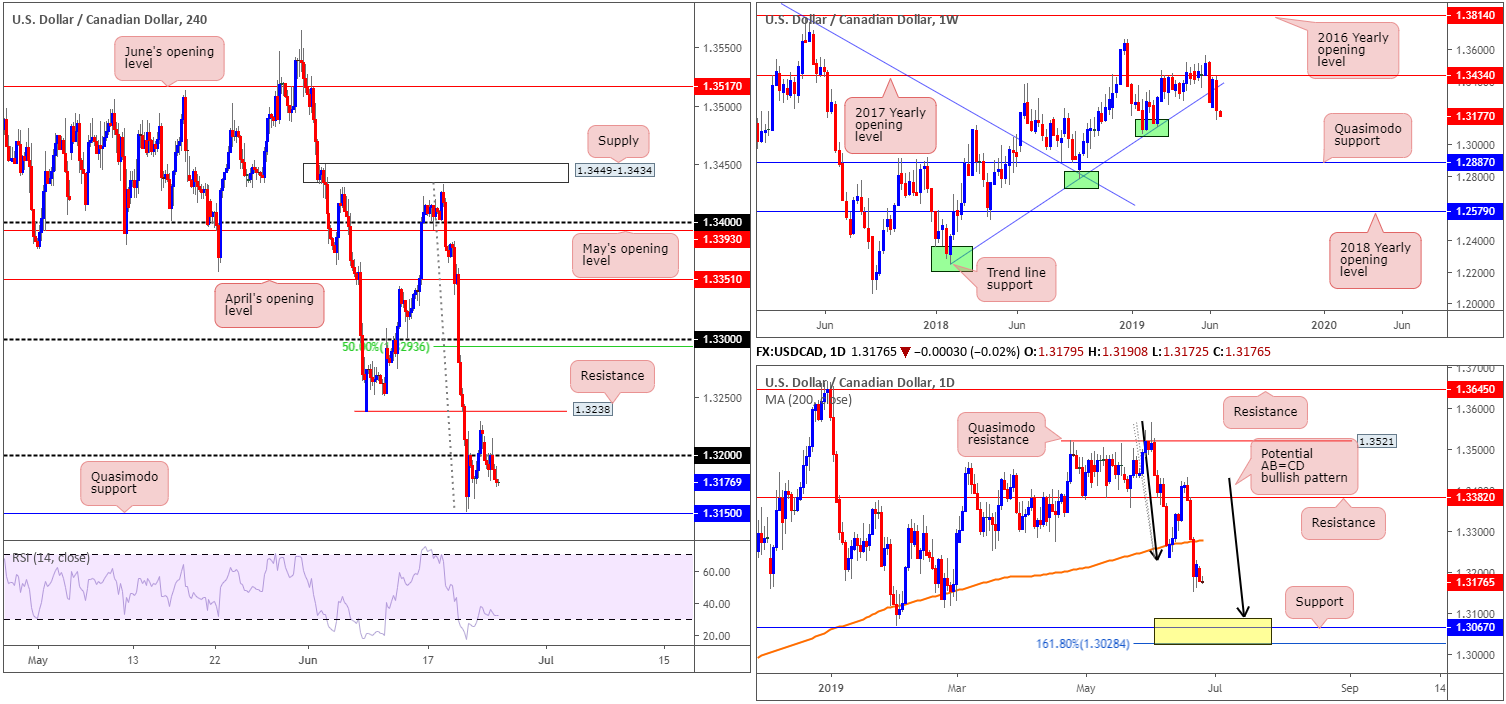
USD/CAD:
The week began with the USD/CAD kicking lower and reclaiming 1.32 to the downside. Note the level served well as resistance amid US hours and held to a session low of 1.3177. On the H4 timeframe, this potentially exposed Quasimodo support at 1.3150 as the next downside objective.
Higher-timeframe analysis, on the other hand, is interesting and sports a downside tone at the moment.
From the weekly timeframe, we can see that since coming within two points of the 2017 yearly opening level at 1.3434 (resistance), the pair reclaimed trend line support (extended from the low 1.2247) in strong fashion last week. Limited demand is visible to the left of current price, therefore the possibility of further downside this week is in store, targeting Quasimodo support at 1.2887.
A closer reading of price action on the daily timeframe recently observed a decisive close beneath the 200-day SMA and opened the door for a possible run to a support area fixed between 1.3028/1.3089 (yellow). Comprised of an AB=CD (black arrows) formation at 1.3089, a support at 1.3067 and a 161.8% Fibonacci extension at 1.3028 (forms part of the AB=CD structure), this area likely has enough confluence to hold price should we reach this far south this week.
Areas of consideration:
With a clear downside tone emphasised on the higher timeframes, at least until reaching the daily support area mentioned above at 1.3028/1.3089, selling this market could be an option worth exploring. Selling at current price is chancy, however, since active buyers may reside around the H4 Quasimodo support at 1.3150. Once (if) this level is cleared, though, a sell is high probability to the top edge of the aforementioned daily support area.
A break of 1.3150 could be sold on the back of the breakout candle’s structure, or alternatively traders may wish to wait and see if a retest of 1.3150 develops. Traders can then consider entering on the back of the rejection candle’s structure.
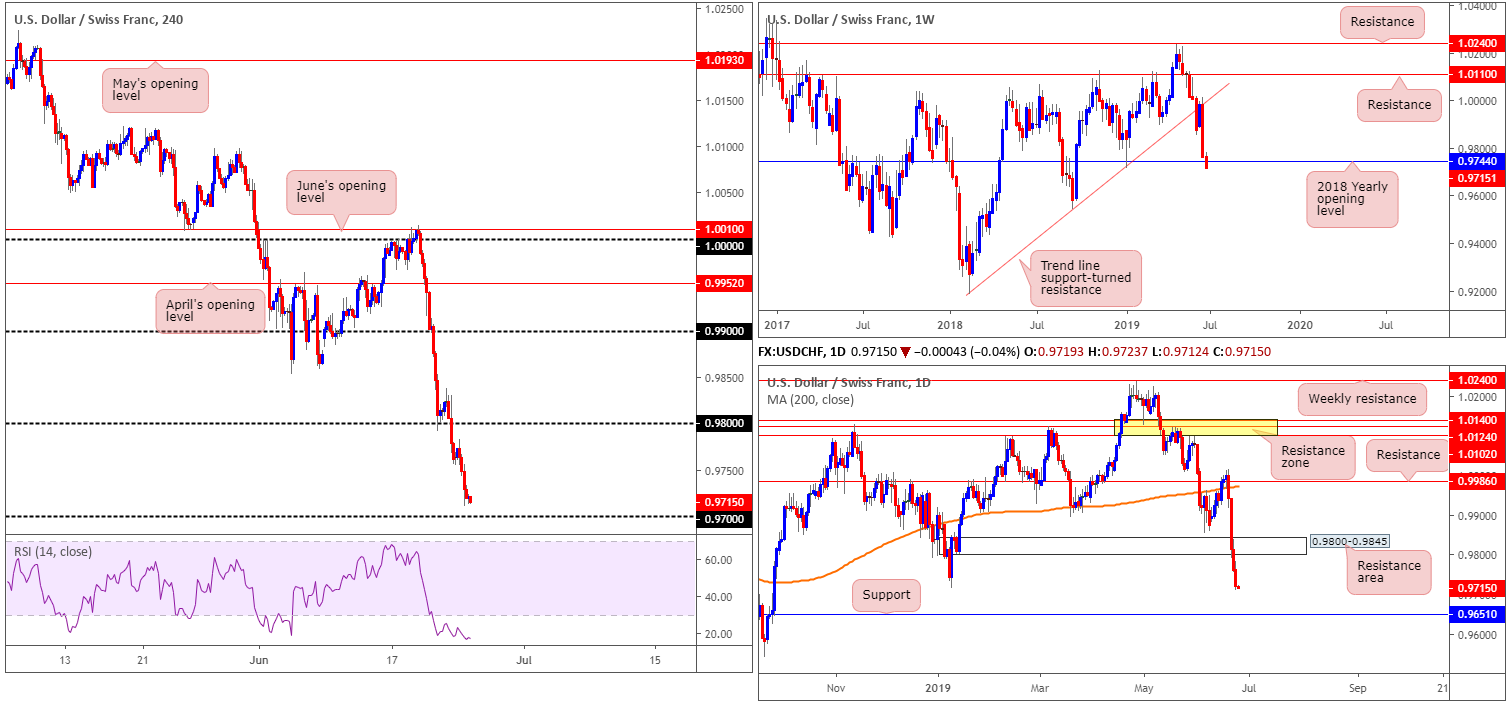
USD/CHF:
USC/CHF flow sustained further losses Monday, down 0.43%. Recording its fourth consecutive daily loss, the pair is now within touching distance of the 0.97 handle on the H4 timeframe after punching beneath weekly support at 0.9744 (the 2018 yearly opening level). Indicator-based traders may also wish to note the RSI is testing waters deep within oversold territory. Beyond the weekly level, the research team sees limited support until connecting with the 0.9542 September 17 low.
The story on the daily timeframe, however, ended Monday’s session within close proximity of the 0.9716 January 10 low (being tested as we write). Consumption of this point unbolts the door to support coming in at 0.9651.
Areas of consideration:
With strong downside momentum materialising over the past few days, buying this market off a round number, despite additional support emerging from the 0.9716 January 10 low visible on the daily timeframe, is chancy. This is particularly true according to the weekly timeframe which recently slipped beneath support at 0.9744.
Instead of looking to fade 0.99, traders are urged to wait and see if the candles break through the psychological mark for a possible sell. A H4 close beyond this number, together with a retest (entry and risk can be determined according to the rejection candle’s structure), potentially clears the path south for a run towards daily support at 0.9651.
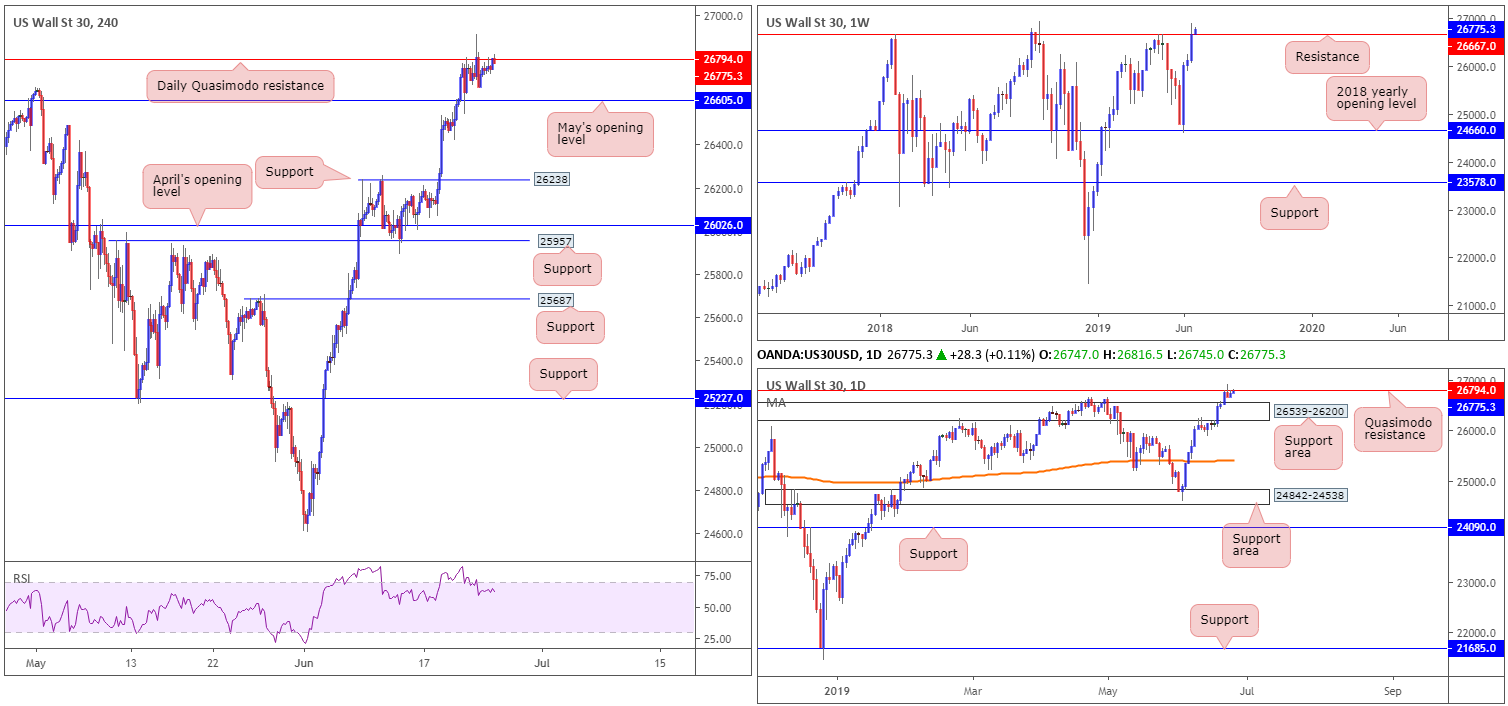
Dow Jones Industrial Average:
US equity indexes were reasonably lacklustre Monday, as investors await the high-stakes meeting between US and Chinese leaders at the G20 summit later this week. Optimism over a revival in trade talks between the two countries and hopes the Federal Reserve will cut interest rates, have bolstered US stocks of late.
Technically speaking, Monday saw the H4 candles struggle to pin down short-term direction beneath daily Quasimodo resistance at 26794. Given the lack of enthusiasm from sellers here, with little sign of testing May’s opening level at 26605, traders are likely preparing for a continuation north it seems. This, coupled with the weekly timeframe recently pushing through resistance at 26667, adds weight to a possible move higher, targeting the all-time high at 26939.
Areas of consideration:
Having seen H4 and daily sellers capped beneath a daily Quasimodo resistance at 26794 and weekly price heading a move above resistance at 26667, trading this market is difficult given the conflicting signals. Therefore, opting to remain on the sidelines until clearer price action is visible is certainly worth considering.
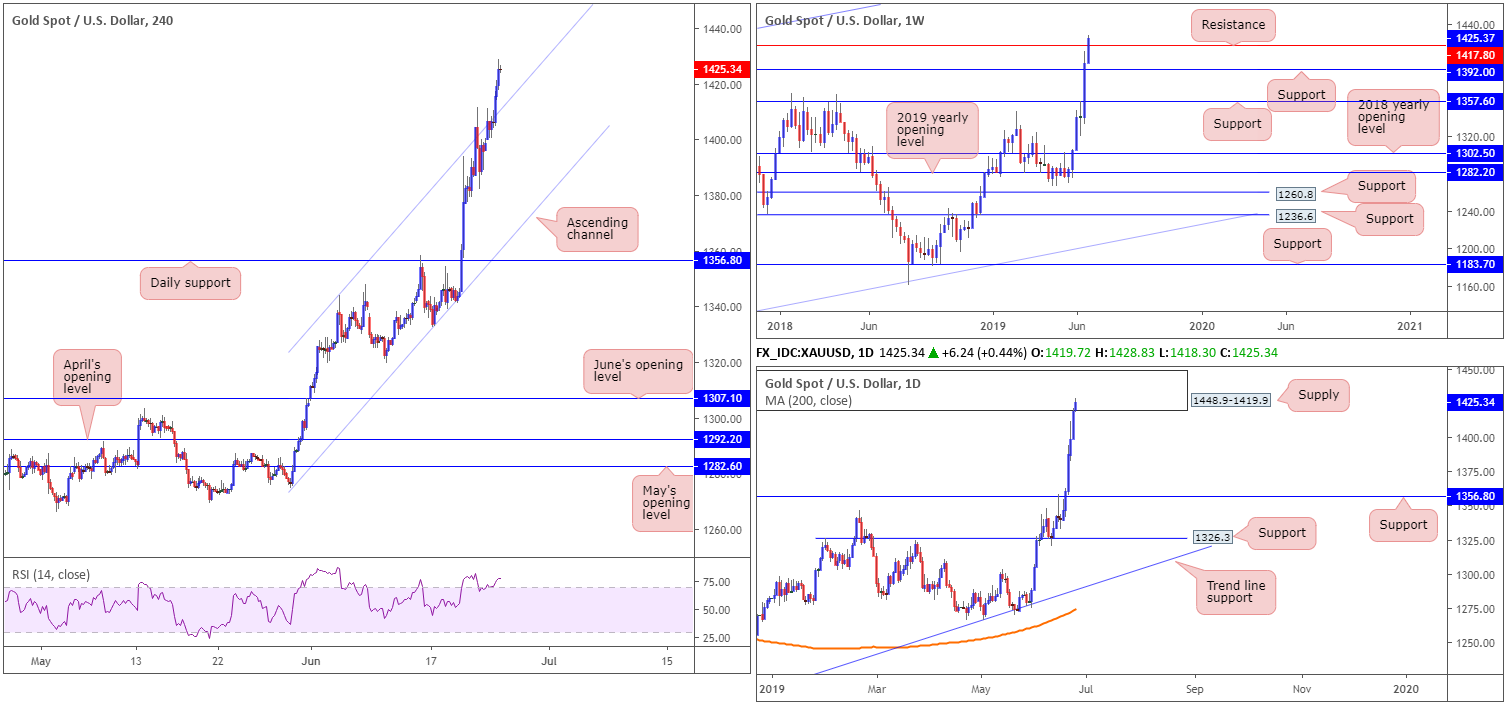
XAU/USD (GOLD):
Kicking things off from the top this morning, the research team notes weekly price recently crossed above resistance at 1417.8 in the latest bout of gold buying. Further upside from this point has weekly supply at 1487.9-1470.2 to target, followed closely by a channel resistance taken from the high 1375.1.
Closer analysis on the daily timeframe had supply at 1448.9-1419.9 recently enter the mix. Drawn from mid-2013, and holding price lower on two occasions since then, there’s a chance active sellers may inhabit this region.
Looking closer at price action on the H4 timeframe, we can see recent buying broke out of an ascending channel formation (1274.8/1344.0). With weekly flow suggesting further buying above resistance at 1417.8, a retest of the recently broken channel resistance as support may be of interest to some traders today. The only drawback to this, of course, is the fact daily price recently entered the walls of supply coming in at 1448.9-1419.9. However, given the trend’s strength to the upside right now, longs are likely the more favoured route.
Areas of consideration:
Keeping it simple this morning, the main focus today is on a retest of the H4 channel resistance-turned support highlighted above. Traders are urged to consider waiting for additional candlestick confirmation (entry and risk levels can be determined according to the selected candlestick structure) before pulling the trigger, since let’s not forget daily players are testing supply at 1448.9-1419.9.
As for the initial upside target, this is difficult in light of recent buying. As such, traders may wish to begin trailing their position behind resistance-turned support levels after the position offers more than 1:1 risk/reward.
The accuracy, completeness and timeliness of the information contained on this site cannot be guaranteed. IC Markets does not warranty, guarantee or make any representations, or assume any liability with regard to financial results based on the use of the information in the site.
News, views, opinions, recommendations and other information obtained from sources outside of www.icmarkets.com.au, used in this site are believed to be reliable, but we cannot guarantee their accuracy or completeness. All such information is subject to change at any time without notice. IC Markets assumes no responsibility for the content of any linked site. The fact that such links may exist does not indicate approval or endorsement of any material contained on any linked site.
IC Markets is not liable for any harm caused by the transmission, through accessing the services or information on this site, of a computer virus, or other computer code or programming device that might be used to access, delete, damage, disable, disrupt or otherwise impede in any manner, the operation of the site or of any user’s software, hardware, data or property.


